Date: Sat, Dec 27, 2025 | 10:25 AM GMT
Dash (DASH), the privacy-focused token, has struggled alongside the broader altcoin market over the past month, shedding nearly 35% of its value amid persistent selling pressure. However, price action is now starting to stabilize, with DASH trading in the green today and posting a modest 4% recovery. More importantly, the latest chart structure suggests that the recent rebound may not be just a short-lived bounce, but part of a developing bullish setup.
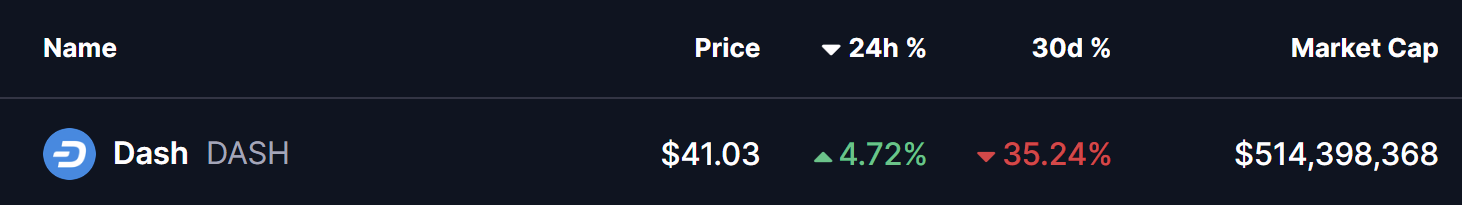
Source: Coinmarketcap
Harmonic Pattern Hints at Potential Upside
On the 4-hour timeframe, DASH is forming a Bearish Butterfly harmonic pattern. While the name may sound negative, this pattern typically allows for a strong upside move during its CD leg before price reaches the final reversal zone.
The structure began at Point X near $42.64, followed by a sharp decline into Point A. From there, DASH rebounded toward Point B, where sellers briefly reasserted control, before price dipped once again into Point C around $36.17. This region has since acted as a firm base, with buyers stepping in aggressively to defend the lows.
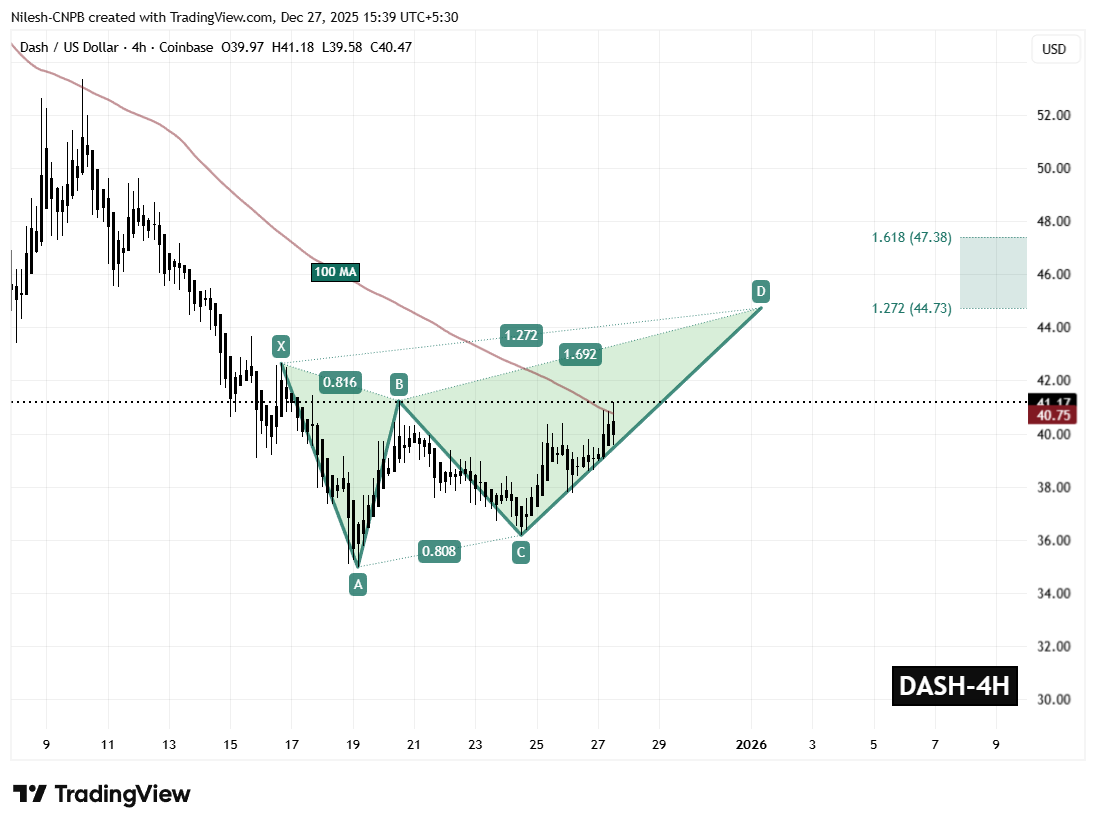
Dash (DASH) 4H Chart/Coinsprobe (Source: Tradingview)
From Point C, DASH has staged a steady recovery and is currently trading near $41.17. This move indicates improving momentum and suggests that the CD leg of the harmonic structure is actively unfolding.
Adding further strength to this setup is DASH’s successful reclaim of the 100-period moving average near $40.75. This level had previously acted as dynamic resistance throughout the downtrend, and flipping it into support marks a meaningful shift in short-term market structure.
What’s Next for DASH?
As long as DASH holds above the $39.58 support zone, the bullish harmonic structure remains intact. Continued strength above the 100 MA would likely reinforce buyer confidence and keep the CD leg in play.
If momentum persists, the Bearish Butterfly projection points toward the Potential Reversal Zone (PRZ) between $44.73 and $47.38. This area represents the typical completion zone for the pattern and offers an upside window of roughly 14% from current levels before sellers may attempt to regain control.
On the flip side, a breakdown below $39.58 would weaken the bullish outlook and risk invalidating the harmonic structure. Such a move could expose DASH to renewed downside pressure and delay any sustained recovery attempt.
For now, DASH’s ability to hold above reclaimed moving average support and continue building higher lows will be critical in determining whether this recovery can extend further in the sessions ahead.
Disclaimer: The views and analysis presented in this article are for informational purposes only and reflect the author’s perspective, not financial advice. Technical patterns and indicators discussed are subject to market volatility and may or may not yield the anticipated results. Investors are advised to exercise caution, conduct independent research, and make decisions aligned with their individual risk tolerance.
Disclaimer: The information on this page may come from third parties and does not represent the views or opinions of Gate. The content displayed on this page is for reference only and does not constitute any financial, investment, or legal advice. Gate does not guarantee the accuracy or completeness of the information and shall not be liable for any losses arising from the use of this information. Virtual asset investments carry high risks and are subject to significant price volatility. You may lose all of your invested principal. Please fully understand the relevant risks and make prudent decisions based on your own financial situation and risk tolerance. For details, please refer to
Disclaimer.
Related Articles
Bitcoin ETF ends with seven straight red days, and renewed downward pressure hits the Bitcoin price
Recently, after experiencing a net inflow for seven consecutive trading days, the U.S. Bitcoin spot ETF saw a significant outflow, with a net outflow of $163.5 million on the 18th and another outflow of $51.9 million on the 19th, indicating a simultaneous weakening of market capital and prices. Bitcoin's price briefly fell below $70,000, highlighting that the fund flows of the ETF can no longer support its rebound, and the deteriorating macro environment is putting pressure on risk assets, causing a noticeable contraction in investor preference. The testing of the $70,000 threshold has become a barometer for short-term market sentiment.
区块客23m ago
On the 28th day of the US-Iran war, JPMorgan stated that Bitcoin has passed the qualification exam for "digital gold."
JPMorgan's report points out that during the ongoing war in Iran, Bitcoin has shown demand similar to that of safe-haven assets, with stable capital flows, in contrast to the trend of gold, which is historically experiencing consecutive declines. This demonstrates Bitcoin's resilience in geopolitical crises, prompting a market reassessment. JPMorgan's analysts believe that Bitcoin has exhibited its potential as digital gold, but uncertainty remains for the future.
動區BlockTempo43m ago
The Futarchy of Privacy: Umbra's Fit in a Private Crypto World
The essay discusses the need for "Verifiable Privacy" in professional trading, highlighting Umbra's unique technical approach and performance-based tokenomics. It notes the privacy sector’s strong growth and upcoming catalysts for Umbra’s expansion.
CoinDesk47m ago
Gold plummets, "safe haven for funds" changes hands? JPMorgan: During the war, "Bitcoin becomes the new darling of hedging."
JPMorgan pointed out that in the Middle East conflict, Bitcoin has shown strong resilience against declines, with significant inflows and active trading, while gold and silver are facing capital outflows. Under pressure from high interest rates and a strong dollar, gold prices have fallen by about 15%. With its borderless characteristics, Bitcoin has become a safe-haven choice, and institutional investors are also adjusting their positions, indicating a decrease in gold liquidity while Bitcoin liquidity is increasing.
区块客48m ago
Solana Rebound Hopes Rise After TD Sequential Issues a Buy Signal on SOL
_TD Sequential flashes buy signal as Solana trades near $75–$80 support zone_
_SOL remains in downtrend with lower highs despite short-term stabilization signs_
_Resistance at $100 holds while RSI stays neutral and MACD shows weak momentum_
Solana Rebound Hopes Rise After TD Sequential
LiveBTCNews1h ago
ARK Invest Cuts Meta, Nvidia, and Bitcoin ETF Holdings as Markets Turn Volatile
ARK Invest's recent sale of shares in Meta, Nvidia, and its Bitcoin ETF marks a defensive shift amid rising geopolitical tensions and market volatility, aiming to lower risk and maintain liquidity, rather than abandoning its long-term growth strategies.
CryptometerIo1h ago
