Cardano (ADA) records a nearly 4% increase on Monday, pushing the price close to the psychological level of $0.40. Signals from the derivatives market clearly reflect an improvement in investors’ risk appetite, as open interest (OI) on ADA futures contracts, along with the number of long positions, are simultaneously increasing. On the technical side, the trend picture continues to lean positive: market momentum is being reinforced, opening up room for ADA to challenge higher resistance levels in the near future.
Increased buying position thanks to stable DEX volume on Cardano
Data from Taptools shows a significant breakout in transaction volume within the Cardano ecosystem, rising from $3.19 million on Thursday to $4.06 million on Sunday. This development indicates a notable recovery in community interest, a trend that has remained stable since Cardano launched a privacy-focused sidechain called Midnight.
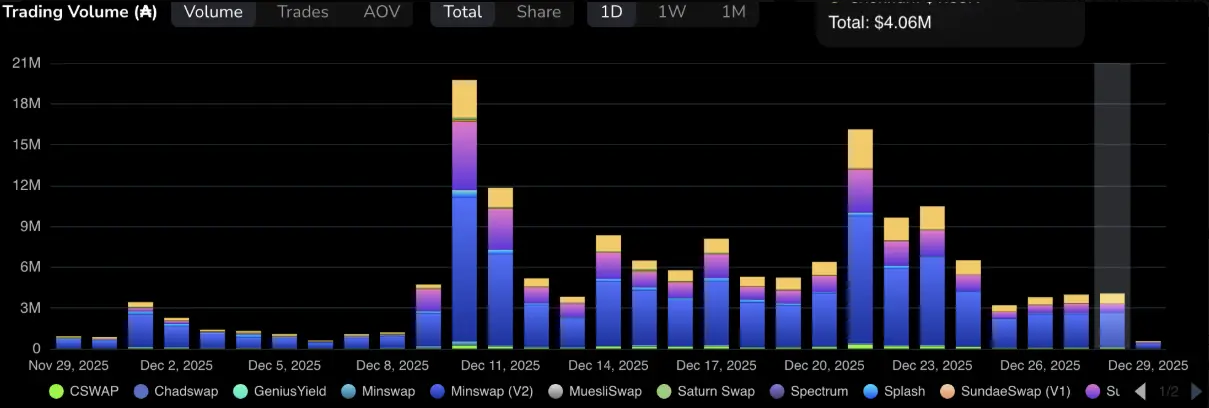 Cardano Transaction Volume | Source: TaptoolsIn the derivatives market, data from CoinGlass indicates that open contracts of Cardano futures have increased by 2.33% within 24 hours, reaching $729.41 million. This reflects a bullish sentiment among traders, with a higher risk appetite being demonstrated.
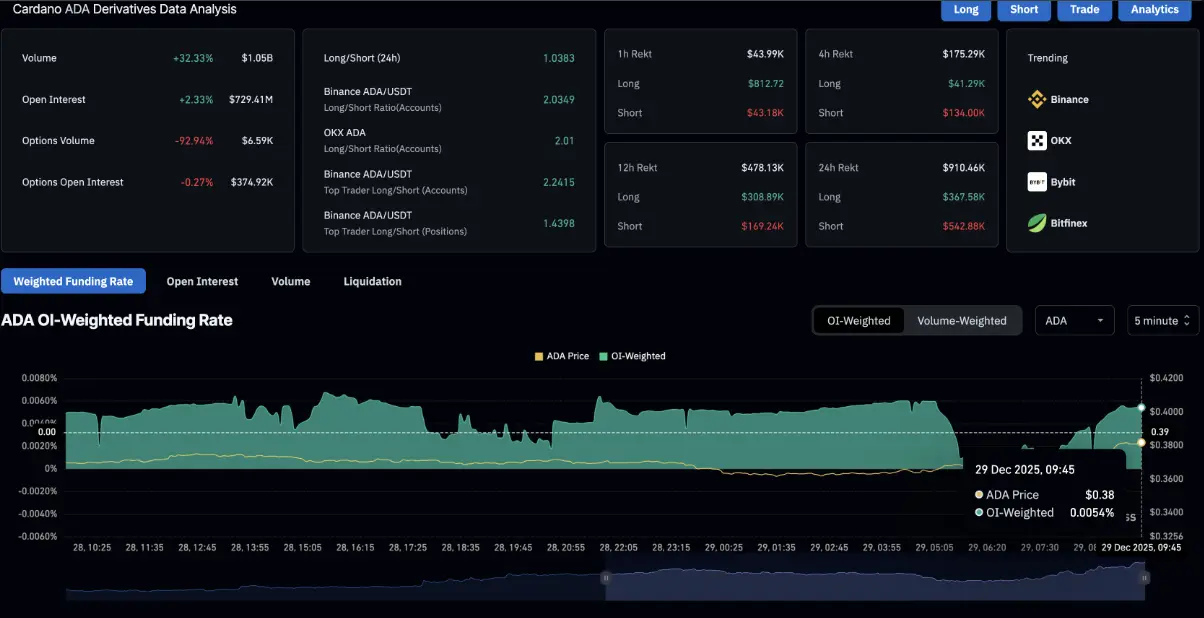 Cardano Derivatives Products | Source: CoinGlassNotably, the funding rate based on OI stands at 0.0054%, suggesting a bullish bias as traders are willing to pay fees to maintain long positions. Meanwhile, the long/short ratio increased to 54.73% on Monday, compared to 48.42% on the previous Sunday. If the accumulation of long positions continues to strengthen, Cardano is likely to enter a new bullish phase, driven strongly by leverage in the market.
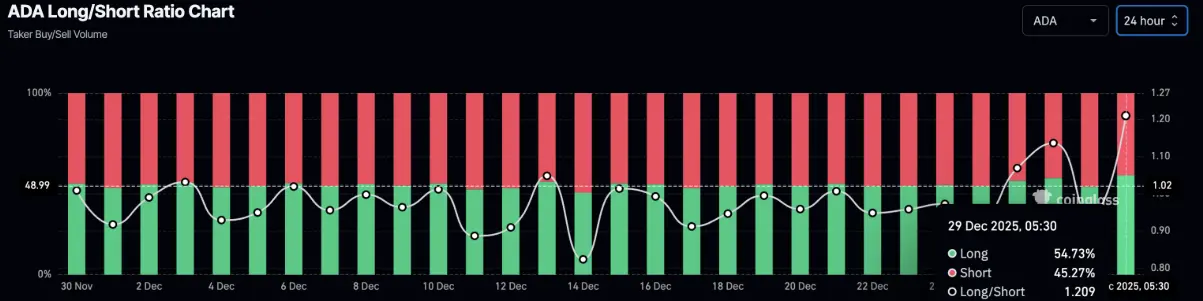 Long/Short Ratio Chart of Cardano | Source: CoinGlass## Technical Outlook: Can Cardano Break the $0.40 Level?
Cardano recorded a nearly 4% gain on Monday, continuing its recovery after a clear bullish divergence appeared on the RSI indicator, formed between the two lows on 12/18 and 12/25. The upward momentum of ADA is currently heading toward the resistance trendline established by connecting the peaks on 10/28 and 12/09, around the $0.40 level on the daily logarithmic chart.
In a positive scenario, if ADA convincingly breaks above $0.40, the price is likely to move toward the 50-day exponential moving average (EMA) at $0.4379, serving as the next resistance target.
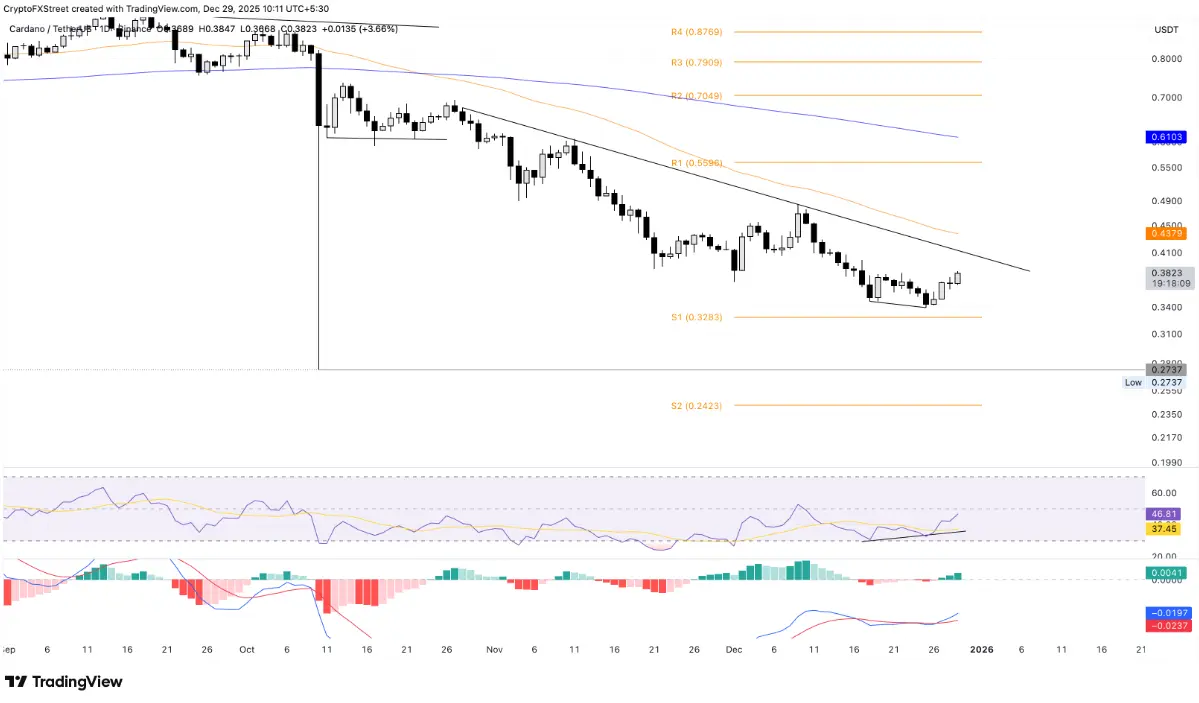 Daily ADA/USDT Chart | Source: TradingViewTechnical signals on the daily timeframe indicate that market momentum is gradually improving toward a neutral to positive outlook. The RSI indicator is currently at 46 and continues to rise toward the midline, reflecting weakening selling pressure. At the same time, MACD lines are approaching the zero line after forming a bullish cross at the end of last week, suggesting the upward trend is being reinforced.
Conversely, if ADA reverses and corrects, the S1 Pivot Point at $0.3283 could become an important support level, helping the price temporarily stabilize before facing selling pressure.
Disclaimer: The information on this page may come from third parties and does not represent the views or opinions of Gate. The content displayed on this page is for reference only and does not constitute any financial, investment, or legal advice. Gate does not guarantee the accuracy or completeness of the information and shall not be liable for any losses arising from the use of this information. Virtual asset investments carry high risks and are subject to significant price volatility. You may lose all of your invested principal. Please fully understand the relevant risks and make prudent decisions based on your own financial situation and risk tolerance. For details, please refer to
Disclaimer.
Related Articles
CryptoQuant: Bitcoin derivatives market dominated by short positions, and the positioning index falls to -3.1
In recent weeks, the Bitcoin derivatives market has been dominated by shorts. The positioning index has continued to fall, and the price has dropped from $73,925 to $66,603. Long positions are facing strong liquidation pressure; the market lacks reversal support, and there is downside risk.
GateNews2m ago
Trump’s Threats Escalate Against Iran: Bitcoin Falls Below a Key Threshold as $65,000 Becomes a Make-or-Break Line
In April 2026, Trump admitted that strikes had been launched against Iranian infrastructure, causing market sentiment to weaken and pulling the price of Bitcoin back to $66,300. Rising geopolitical risk caused financial markets to diverge; Asian stocks rebounded, while crypto assets came under pressure. If the situation deteriorates, Bitcoin’s support level at $65,000 would trigger technical selling. Market drivers shifted toward geopolitics, and in the short term Bitcoin is unlikely to shake off the impact of macro shocks.
GateNews25m ago
Behind the rebound in Asian stock markets: a surge in mining stocks, pressure on platform stocks, and an intensifying split in capital flows in the crypto market
With expectations of a easing in the Middle East situation, Asian stock markets moved higher across the board, and falling oil prices eased market tensions. Despite pressure on crypto-related stocks on trading platforms, Bitcoin mining stocks performed strongly, indicating a trend of capital being reallocated. The market remains cautious about geopolitical developments and the outlook will be shaped by multiple factors.
GateNews32m ago
Aave V4 Major Upgrade Yet Falls Below $95: Is DeFi Good News Failing or Has Market Pricing Logic Changed?
DeFi lending protocol Aave, after launching its V4 upgrade in 2026, despite significant technical optimizations, saw the token price fall to a 52-week low point, reflecting the market’s focus on macro liquidity and risk appetite. While Aave’s V4 upgrade strengthens its position as core infrastructure, it is difficult in the short term to translate into demand for the token, showing a disconnect between the price and the protocol’s evolution.
GateNews35m ago
XRP Holds Ground as Inflows Rise but Price Trails Highs
Key Insights:
XRP trades about 60% below its peak despite steady ETF inflows, reflecting a gap between improving fundamentals and current market valuation levels.
Institutional exposure through XRP ETFs reached 1.1 billion dollars, yet analysts say inflow scale remains too small to
CryptoFrontNews43m ago
