 The post Chainlink Price at a Crossroads: Why LINK Is Struggling Near $12 appeared first on Coinpedia Fintech News
The crypto markets are becoming choppy nowadays as the prices of most of the tokens are heading towards their local support range. Meanwhile, the Chainlink (LINK) price is trading near the $12 zone, extending a broader downtrend that has been in place since October. While volatility has cooled, the chart shows that LINK is not stabilising yet. Instead, price action suggests sellers remain in control, with rallies failing to reclaim key resistance levels. The market is now approaching a critical decision point that could define LINK’s next move.
Why LINK Price is Hovering Around $12.5?
On the daily chart, LINK continues to print lower highs and lower lows, a classic bearish structure. Every rebound attempt over the past two months has stalled below prior support zones, which have now turned into resistance. This behaviour signals distribution rather than accumulation.
![]() The sharp breakdown in October was followed by weak recovery attempts, showing that buyers have not stepped in aggressively. Until this structure changes, the broader trend remains tilted to the downside.
The sharp breakdown in October was followed by weak recovery attempts, showing that buyers have not stepped in aggressively. Until this structure changes, the broader trend remains tilted to the downside.
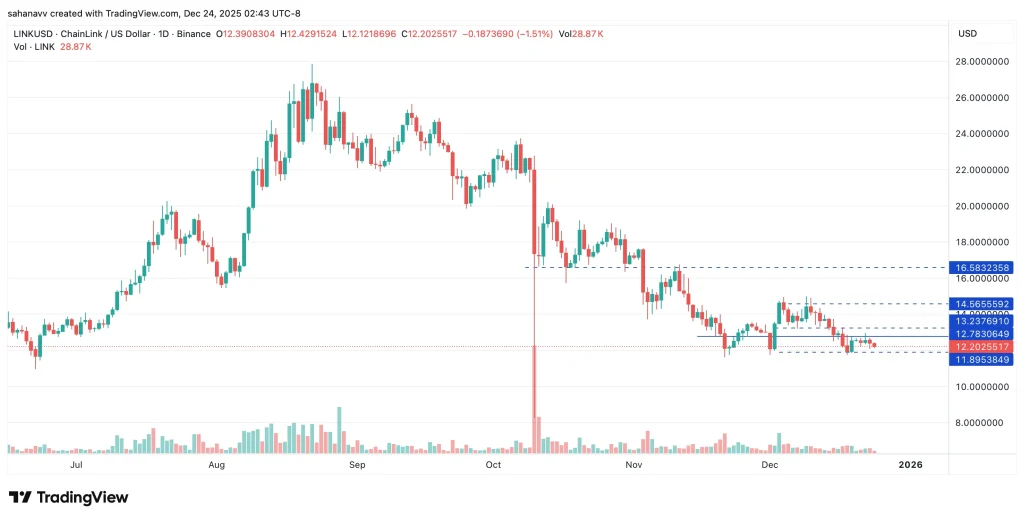 The $12–$12.20 area is the most important level on the chart right now. Volume has remained relatively low, suggesting a lack of strong demand. If buyers were in control, the chart would show stronger bounces and follow-through. Instead, price is compressing near the level, increasing the risk of a breakdown
What happens next?
A clean daily close below $12 would likely trigger another leg lower rather than a temporary dip. Below this level, the next demand zone sits near $11.90–$11.50, where buyers previously stepped in. Such a move would not indicate panic but a continuation of the existing trend. In weak market conditions, altcoins like LINK tend to follow momentum rather than reverse abruptly.
Besides, to invalidate the bearish setup, the price must reclaim $12.80–$13.30 and hold above it. This zone marks previous support that repeatedly capped recent rallies. A breakout above it, supported by rising volume, would signal that sellers are losing control.
Without this reclaim, upside moves are likely to be sold into rather than extended.
Why Is LINK Underperforming Right Now and What’s Next?
LINK’s weakness also reflects broader market conditions. With Bitcoin and Ethereum consolidating and liquidity thinning, capital is rotating away from higher-beta altcoins. In such phases, tokens with weaker structure tend to underperform until market confidence returns. This makes patience critical for traders, as early dip-buying often leads to poor risk-reward setups.
Collectively, Chainlink is not collapsing, but it is clearly failing to reclaim structure. The $12 level is acting as a pressure point, and the lack of strong buying interest keeps downside risks elevated. Until the LINK price reclaims key resistance at $15 with volume growth, the trend may remain sideways to lower.
Disclaimer: The information on this page may come from third parties and does not represent the views or opinions of Gate. The content displayed on this page is for reference only and does not constitute any financial, investment, or legal advice. Gate does not guarantee the accuracy or completeness of the information and shall not be liable for any losses arising from the use of this information. Virtual asset investments carry high risks and are subject to significant price volatility. You may lose all of your invested principal. Please fully understand the relevant risks and make prudent decisions based on your own financial situation and risk tolerance. For details, please refer to
Disclaimer.
Related Articles
A certain whale deposited 1,102 BTC into a certain CEX, with an unrealized loss of approximately 55.6 million dollars.
Gate News message. On March 30, an on-chain analytics platform monitored and showed that a whale address deposited 1,102 BTC into a certain CEX, worth approximately $74.21 million. This address bought this batch of BTC 8 months ago at an average price of $117,770. Based on the current price, this transfer is in an unrealized loss of about $55.6 million, a drawdown of 43%.
GateNews6m ago
Bitcoin Volatility Spikes as Trump Brags for Hitting Big Targets in Iran
After an unexpectedly calm weekend in which its price stood between $66,000 and $67,000, bitcoin went on a micro wild ride in the early hours on Monday, dipping to a new monthly low before it jumped toward $68,000.
This volatility ensued after Trump’s latest comments on the US/Israel vs Iran war, w
CryptoPotato14m ago
Bitcoin Traders Split Strategy: Short Rallies, Buy the Dip
_Trader holds BTC shorts from $120K and $72.8K while adding to spot positions during the decline._
_Bitcoin has dropped about 51% from highs, with an estimated 10–15% downside remaining._
_Strategy combines shorting at range highs and spot buying, with a projected 4–6 month bottom
LiveBTCNews18m ago
$12 billion short vs $3 billion long: Bitcoin may face an epic short squeeze.
The Bitcoin futures market currently has short positions of about $12 billion, while long positions are only $3 billion. Market sentiment is cautious, and risk is significant. High leverage and a heavy short-selling strategy could lead to sharp market volatility, and there is also a risk of a short squeeze. Key support and resistance levels will determine the next direction of price action, and the market is currently in a sensitive window.
GateNews18m ago
Bitcoin enters "Facebook explosion period"? Analysts: Users may welcome a threefold growth window
Bitcoin is undergoing a crucial phase of adoption, gradually shifting from a "niche asset" to a mainstream financial asset. Analysts point out that the "detagging" process of Bitcoin has attracted more institutional investors, and the market structure is undergoing deep changes. The number of global Bitcoin holders has reached 106 million, and spot ETFs are driving capital inflows, indicating that its growth potential remains enormous.
GateNews22m ago
Last week, Bitcoin spot ETFs saw a net outflow of $296 million, with BlackRock's IBIT experiencing a net outflow of $158 million.
Last week, Bitcoin spot ETFs saw a net outflow of $296 million, with BlackRock's IBIT experiencing a net outflow of $158 million. The largest net inflow was from Fidelity's FBTC, totaling $46.825 million. As of the time of writing, the total net asset value of the ETFs is $84.77 billion.
GateNews23m ago
