Date: Sun, Dec 21 2025 | 08:56 AM GMT
The broader cryptocurrency market has remained under pressure over the past several weeks, following the sharp sell-off that began on October 10. That corrective phase dragged Ethereum (ETH) down by nearly 23% over the last 60 days and weighed heavily on overall market sentiment. While many altcoins have struggled to stabilize, Quant (QNT) has shown relative resilience, posting only a modest decline and holding above a historically important support zone.
From a technical perspective, the daily chart suggests that QNT may be approaching a critical decision point, with price action forming a recognizable structure that could influence its next directional move.
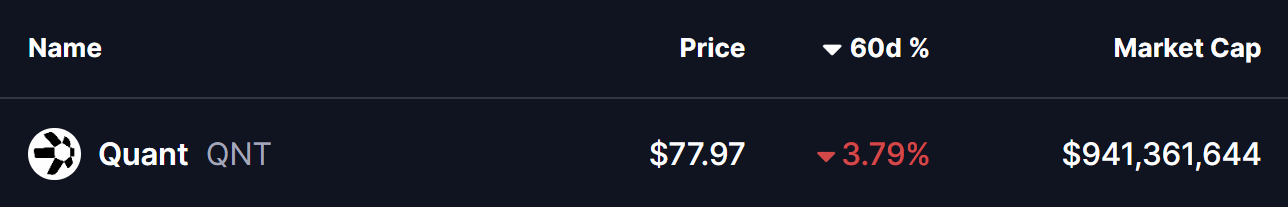
Source: Coinmarketcap
Head and Shoulders Pattern Takes Shape
On the daily timeframe, QNT appears to be carving out a head and shoulders formation, a well-known pattern that often signals a potential trend shift once the neckline is tested. Earlier in the structure, QNT formed the left shoulder before rallying sharply to its head near the $100 region. From there, price reversed lower and slid back toward the neckline, located around the $70 support zone.
This $70 area has proven to be a strong demand zone in the past, repeatedly attracting buyers and preventing deeper declines. The recent move into this region was met with a noticeable reaction, as reflected by the long lower wick on the chart. That rejection from support pushed price back toward the $78 level, suggesting that buyers are actively defending the neckline and potentially forming the right shoulder of the pattern.
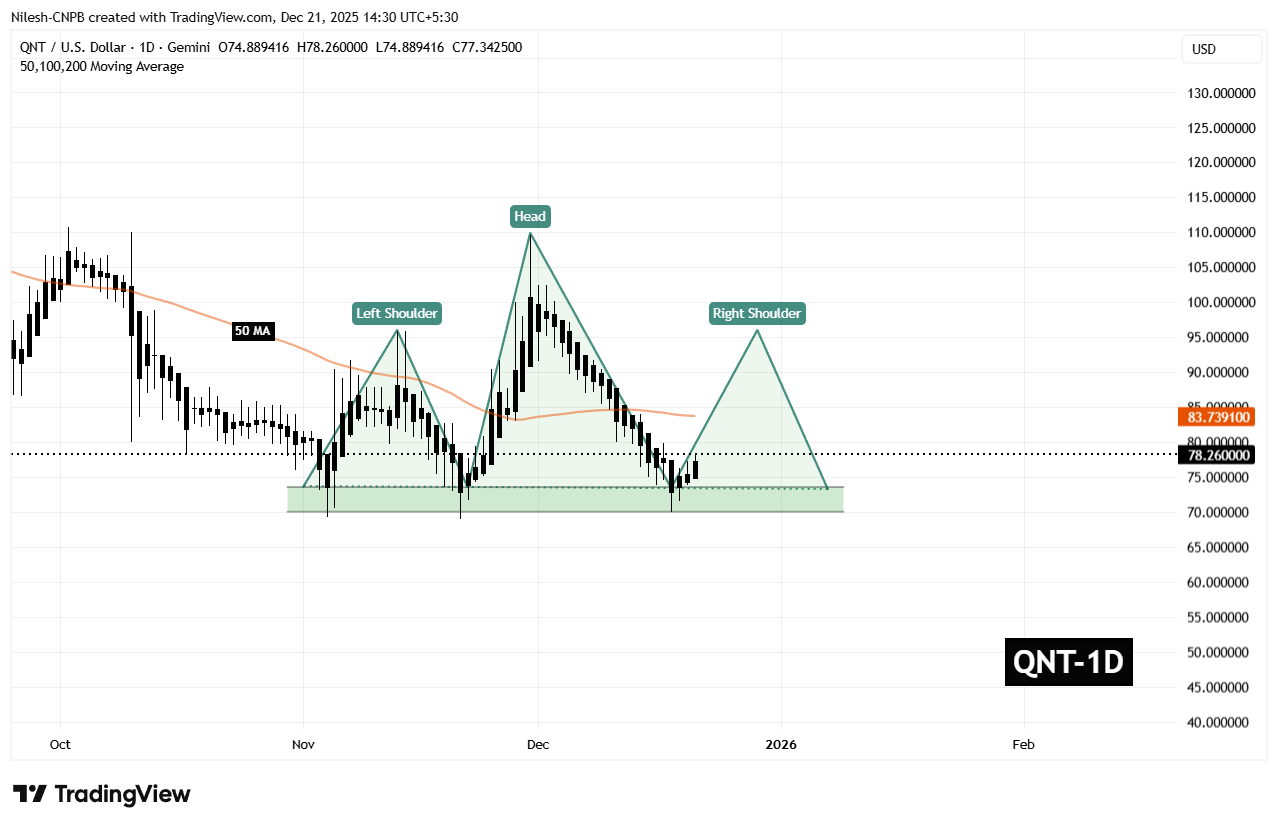
Quant (QNT) Daily Chart/Coinsprobe (Source: Tradingview)
The behavior around this zone is critical. A successful defense of the neckline often opens the door for a relief rally, especially if broader market conditions stabilize.
What’s Next for QNT?
For bullish momentum to build, QNT needs to reclaim the 50-day moving average, currently sitting near $83.73. This level now acts as a key short-term resistance, and a daily close above it would signal a shift in momentum back in favor of buyers.
If that recovery unfolds, the chart points toward a potential move into the $95.90 region. Such a move would represent a rebound of roughly 22% from current levels and align with the typical reaction seen during the right-shoulder phase of this pattern. A rally of this nature would not only ease recent selling pressure but also place QNT back into a more neutral technical posture.
That said, the setup remains delicate. If the $70 neckline support fails to hold on a sustained basis, the head and shoulders structure would remain bearish, opening the door to further downside and extending the corrective phase. For now, all eyes remain on how price behaves around this key support and whether buyers can regain control above the moving average.
Disclaimer: The views and analysis presented in this article are for informational purposes only and reflect the author’s perspective, not financial advice. Technical patterns and indicators discussed are subject to market volatility and may or may not yield the anticipated results. Investors are advised to exercise caution, conduct independent research, and make decisions aligned with their individual risk tolerance.
Disclaimer: The information on this page may come from third parties and does not represent the views or opinions of Gate. The content displayed on this page is for reference only and does not constitute any financial, investment, or legal advice. Gate does not guarantee the accuracy or completeness of the information and shall not be liable for any losses arising from the use of this information. Virtual asset investments carry high risks and are subject to significant price volatility. You may lose all of your invested principal. Please fully understand the relevant risks and make prudent decisions based on your own financial situation and risk tolerance. For details, please refer to
Disclaimer.
Related Articles
Today the Fear and Greed Index rose to 28, with the market turning into a "panic state"
Gate News, March 17th, according to Alternative.me data, today's Cryptocurrency Fear and Greed Index rose to 28 (23 yesterday), with the market shifting from "extreme fear" to "fear" status.
GateNews9m ago
Bitcoin challenges 75K, Nvidia GTC drives AI token rally
Amid oil price declines, stock markets rebounded, and cryptocurrency market sentiment recovered to neutral levels. Bitcoin touched $74,899, challenging the 75K level. Nvidia's GTC conference drove significant gains in AI-related tokens, with the overall market showing positive momentum.
ChainNewsAbmedia57m ago
ETH Short-term Decline of 0.72%: Sell-side Dominance and Fund Outflow Intensify Risk-off Sentiment
2026-03-16 22:15至22:30(UTC),ETH价格在2355.0至2377.16 USDT区间快速下行,15分钟内收益率为-0.72%,振幅达0.93%。这一波动引发市场关注,交易量与链上活跃度均显著提升,短线波动加剧,情绪趋于谨慎。
本次异动的主要驱动力是急速上涨的卖出交易量与资金流出。ETH主网交易量较此前一小时均值大幅提升18.4%,买卖订单结构发生转变,卖出订单占比跃升至
GateNews2h ago
Michael Saylor Warns Quantum Threat Would Break the Internet - U.Today
Michael Saylor argues that quantum computing poses a universal risk beyond Bitcoin, threatening critical global infrastructure. In response to Chamath Palihapitiya's views on AI and market disruptions, Saylor insists that a transition to Post-Quantum Cryptography will protect Bitcoin and other systems together, emphasizing its resilience as "Digital Capital."
UToday2h ago
Analyst Says Bitcoin Indicators Show Early Signs of Market Recovery
Stablecoin liquidity rose by ~$8B since February, signaling potential improved market trading conditions.
Inter-exchange Flow Pulse turned positive, indicating more Bitcoin moving to derivatives platforms.
Long-term holders retain ~79% of supply, showing gradual supply transfers
CryptoFrontNews4h ago
Bitcoin Surges Above $74K After Rally From $60K Support Level
Bitcoin surged from $60K to nearly $74K, gaining 23% as buyers maintained momentum, indicated by a positive RSI and MACD. Key resistance lies at $74K, with support levels at $72.8K, $71.5K, and $70K. Traders anticipate potential further gains.
CryptoFrontNews4h ago
