
The Kaspa (KAS) price has been stuck for weeks, frustrating traders looking for a clear direction. After a long decline from earlier highs, KAS is no longer accelerating lower, but it is also not breaking out.
Instead, price is hovering around the same levels, printing repeated tests of support with muted reactions.
According to analyst EliZ, this type of behavior is not random. He describes the current phase as “construction,” a period where selling pressure is absorbed rather than expanded.
- What the KAS Chart Is Showing
- Why the “Green Box” Matters For KAS Price
- KAS Price Key Levels to Watch
What the KAS Chart Is Showing
On the higher timeframes, the KAS price has been trending lower for months, but the recent structure looks different from earlier sell-offs. Price continues to dip below prior lows, yet each move is quickly bought back. There is no follow-through, no sharp continuation, and no panic expansion to the downside.
This repeated behavior suggests absorption. Sellers are still present, but they are being met by steady demand in the same area.
The Kaspa chart shows price compressing below a descending trendline, with multiple failed attempts to push lower. That compression is happening inside a clearly defined support zone, marked by the green box on the 2D chart. So far, that zone has held.

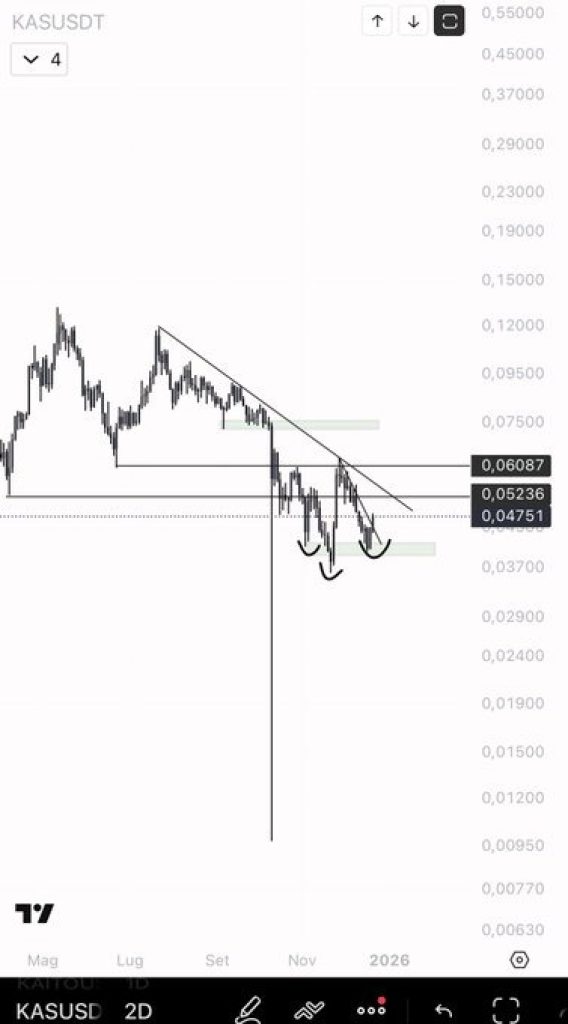
Source: X/Eliz
Why the “Green Box” Matters For KAS Price
EliZ points out that as long as the green box holds on the 2-day timeframe, the current price action remains constructive. The market is not breaking out, but it is also not collapsing. This is often how accumulation phases look before expansion begins.
In past cycles, similar Kaspa structures showed slow grinding action, small breakdowns that failed to accelerate, and long periods of boredom. When selling finally stopped, price expanded quickly and without much warning.
That does not guarantee the same outcome here, but the similarity in structure is what makes this zone important.
_Read Also: _****Here’s Why Audiera (BEAT) Price Is Pumping Today
KAS Price Key Levels to Watch
The green box acts as the main line in the sand. As long as price holds above it, the current range can be viewed as absorption rather than distribution. A sustained hold keeps the broader setup intact, even if short-term volatility continues below resistance.
If the Kaspa price loses that support decisively, the construction thesis breaks down. A clean move below the green box would invalidate the setup and likely open the door to another leg lower.
On the upside, KAS still needs to reclaim the descending trendline and previous range highs before any bullish continuation can be confirmed.
Right now, the Kaspa price is not offering clear trend signals. Instead, it is offering information. The lack of downside follow-through, combined with repeated absorption at the same levels, suggests the market is building something rather than breaking apart.
As EliZ notes, this phase does not force a move higher, but it also does not point to collapse. Until price either escapes the range or loses the green box, patience matters more than prediction. For now, KAS remains in construction mode.
Disclaimer: The information on this page may come from third parties and does not represent the views or opinions of Gate. The content displayed on this page is for reference only and does not constitute any financial, investment, or legal advice. Gate does not guarantee the accuracy or completeness of the information and shall not be liable for any losses arising from the use of this information. Virtual asset investments carry high risks and are subject to significant price volatility. You may lose all of your invested principal. Please fully understand the relevant risks and make prudent decisions based on your own financial situation and risk tolerance. For details, please refer to
Disclaimer.
Related Articles
Pendle Price Challenges Inverted Flag Pattern Bottom Trendline, Technical Analysis Shows Downside Risk
Gate News reports that on March 20, Pendle token price is challenging the bottom trendline of an inverted flag pattern. Technical analysis shows that if this support level breaks, the price could fall back to the $1 level.
GateNews26m ago
Bitcoin Holds Strong at $70,000! On-Chain Data Reveals "Collective Selling Wave," Retail Investors Emerge as Biggest Selling Pressure
Against the backdrop of Middle East geopolitical tensions, Bitcoin has faced a comprehensive sell-off with nearly all coin holders turning to net selling, most notably among retail investors. According to Glassnode data, the cumulative trend score has dropped to 0.04, indicating heavy selling pressure in the market. Small-cap holders and mid-sized investors are showing significant selling intensity, while whales, though reducing their holdings, are doing so at a lower rate. Despite the dismal data, Bitcoin continues to demonstrate resilience against declines.
区块客39m ago
Bitcoin Price Trend Mirrors Late 2024 Decline Pattern, Traders Focus on Key Technical Levels
Bitcoin's current price movement is similar to the downtrend seen at the end of 2024, showing an upward tilt within narrow range fluctuations since February. Technical analysis indicates that a break below the lower band of 65,800 USD would form a key signal, while a breakthrough above could show different performance. Traders are closely monitoring this critical level.
GateNews40m ago
Bitcoin Rebounds Above $70,000, Asian Tech Stocks Decline and Gold Strength Put Pressure
Bitcoin rebounded above $70,000 on March 20, with a market cap of approximately $1.41 trillion, but gains were limited by declines in tech stocks and rising demand for safe-haven assets. Institutional capital outflows indicate slowing Bitcoin demand, and investors need to monitor market dynamics to assess potential risks.
GateNews1h ago
Bitcoin price reproduces the earlier crash pattern, with $65,800 as a key support level
Bitcoin price trend is similar to last year, currently around 70,335 USD, showing potential market pressure. If it breaks below 65,800 USD, a new round of decline may follow; breaking through the upper band could lead to a rebound. Market sentiment is cautious, investors need to pay attention to key support and resistance levels, while being vigilant about downside risks and preparing for an upside rebound.
GateNews1h ago
Hyperliquid Price Jumps 22% as Commodity Trading Hits Record
Key Insights:
Hyperliquid surged over 20% weekly, driven by record commodity futures trading volumes, especially oil and silver contracts, gaining strong traction among traders.
Whale activity surpassed $3.6 billion in leveraged positions, boosting liquidity and reinforcing upward momentum a
CryptoFrontNews1h ago
