Date: Fri, Dec 19 2025 | 12:45 PM GMT
The broader cryptocurrency market is showing relative strength despite concerns around the Japan rate hike. Cooling U.S. inflation has helped both Bitcoin (BTC) and Ethereum (ETH) hold in the green, and this stability is beginning to spill over into select altcoins, including Stellar (XLM).
XLM has posted modest gains today, but beyond the short-term price move, the daily chart is starting to reveal an emerging technical structure that could set the stage for a more meaningful recovery if key levels continue to hold.
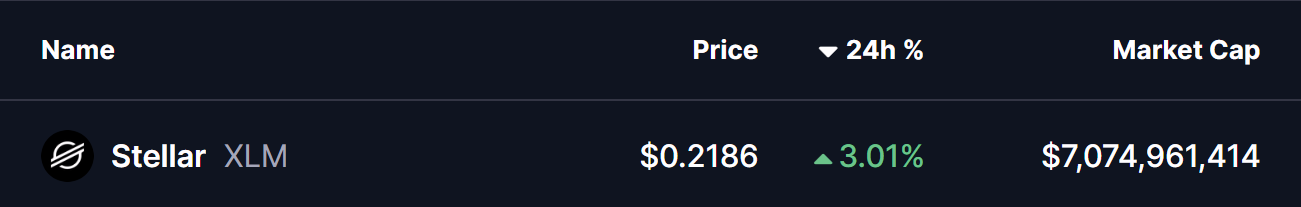
Source: Coinmarketcap
Harmonic Pattern Signals Potential Upside
On the daily timeframe, XLM appears to be forming a Bearish Cypher harmonic pattern — a setup that often generates upside momentum during its final CD leg before price reaches the Potential Reversal Zone (PRZ).
The pattern began at point X near the $0.3113 region, where XLM topped out before entering a sharp corrective phase. Price then declined into point A, followed by a rebound toward point B. From there, XLM rolled over again and extended lower into point C around the $0.2029 area, completing the core structure of the pattern.
Since tagging this low, XLM has started to stabilize and grind higher, currently trading near the $0.2188 level. This slow but steady recovery suggests that selling pressure may be fading, with buyers beginning to defend the recent lows more aggressively.
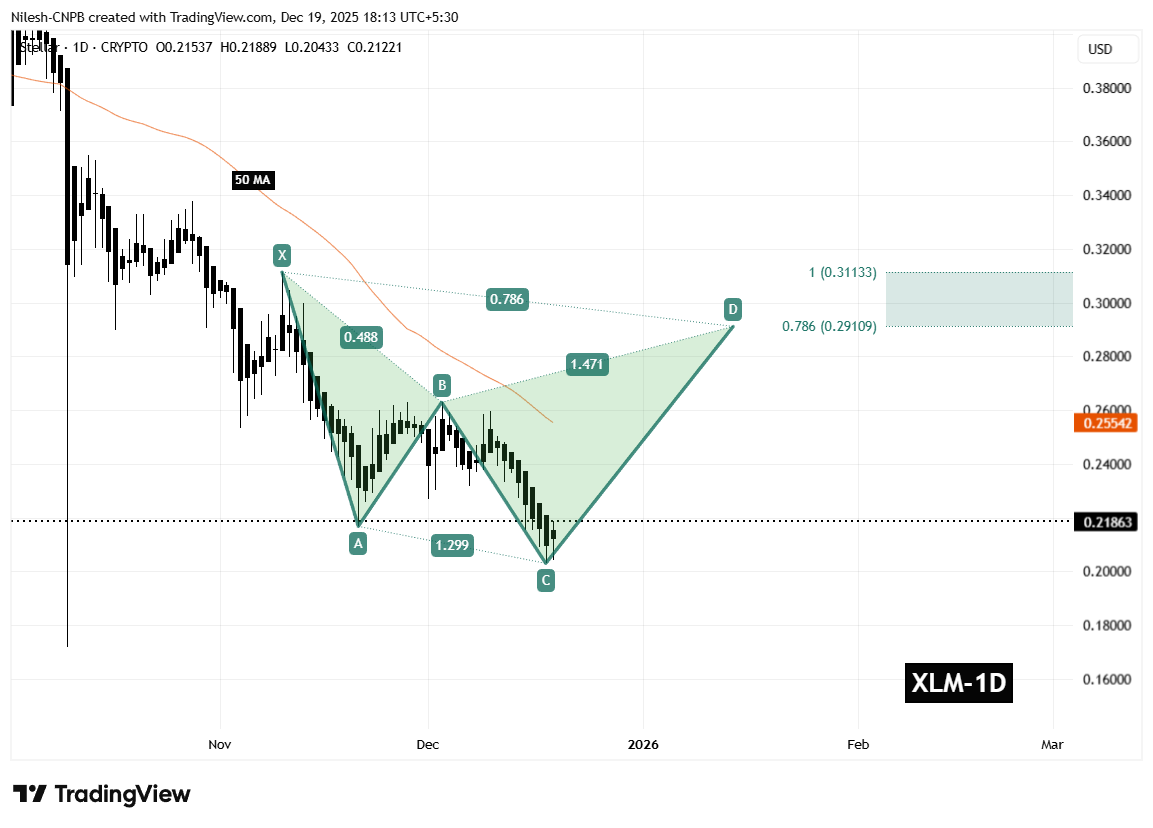
Stellar (XLM) Daily Chart /Coinsprobe (Source: Tradingview)
A key technical factor aligning with this structure is the 50-day moving average, currently positioned near $0.2554. This moving average has consistently acted as dynamic resistance throughout the downtrend and represents an important hurdle for bulls to overcome in the near term.
What’s Next for XLM?
In the short term, the most critical level to monitor is the C-leg support around $0.2029. As long as XLM holds above this zone, the harmonic pattern remains valid and the bullish CD-leg scenario stays intact.
If price continues to build strength from this base, the next major test will be a reclaim of the 50-day moving average near $0.2554. A decisive break and close above this level would signal improving momentum and could accelerate upside continuation.
Based on the harmonic structure, the projected upside targets sit within the Potential Reversal Zone, defined between the 0.786 Fibonacci extension near $0.2910 and the 1.0 extension around $0.3113. Reaching this zone would represent a potential upside of roughly 40–45% from current price levels, making it a key area where profit-taking or stronger resistance could emerge.
On the downside, failure to hold above the $0.2029 support would significantly weaken the bullish setup. A breakdown below this level could invalidate the harmonic structure and expose XLM to deeper downside pressure before any sustainable recovery attempt develops.
For now, the chart suggests Stellar is sitting at an important technical crossroads. While confirmation is still needed, the presence of a well-defined harmonic pattern indicates that a short- to medium-term bounce remains a realistic possibility if buyers continue to defend current levels and reclaim key resistance zones.
Disclaimer: The views and analysis presented in this article are for informational purposes only and reflect the author’s perspective, not financial advice. Technical patterns and indicators discussed are subject to market volatility and may or may not yield the anticipated results. Investors are advised to exercise caution, conduct independent research, and make decisions aligned with their individual risk tolerance.
Disclaimer: The information on this page may come from third parties and does not represent the views or opinions of Gate. The content displayed on this page is for reference only and does not constitute any financial, investment, or legal advice. Gate does not guarantee the accuracy or completeness of the information and shall not be liable for any losses arising from the use of this information. Virtual asset investments carry high risks and are subject to significant price volatility. You may lose all of your invested principal. Please fully understand the relevant risks and make prudent decisions based on your own financial situation and risk tolerance. For details, please refer to
Disclaimer.
Related Articles
Bitcoin Has Stabilized, But Investors Are Paying Up for Downside Protection: VanEck
Bitcoin's volatility has decreased to around $70,000, but traders are still heavily investing in downside protection. Although premiums for puts have dropped, they remain high historically, suggesting caution among investors. This defensiveness may signal an impending price bottom, as similar market conditions in the past have led to recoveries.
Decrypt44m ago
Cardano Flashes Weekly Buy Signal As ADA Holds Key $0.23 Support
Cardano is trying to shake off a bruising stretch of price weakness, and a fresh technical signal is giving traders a reason to pay attention again. Crypto analyst Ali Martinez said ADA has printed a TD Sequential buy signal on the weekly chart, showing a “black 9” that often appears when a
BlockChainReporter2h ago
Ethereum Approaches Cycle Low as Bitmain Indicates Violent Belief
The article explores Ethereum's potential market bottom, highlighting its correlation with past S&P 500 trends and significant institutional investment by Bitmain. Despite mixed market sentiment, historical patterns suggest possible recovery.
CryptoBreaking3h ago
Analyst: If Bitcoin falls below the $66,000 support level, it may trigger a 10%-20% correction
Gate News reported that on March 20, Chartered Market Technician (CMT) Aksel Kibar stated on March 21 that the lower support boundary of Bitcoin's potential rising wedge formation is located at 66,000, and a breakdown below this level could trigger a bearish reversal. Aksel Kibar pointed out that rising wedges, as a classic technical pattern, typically appear at the end of uptrends, signaling price momentum exhaustion. Historical data shows that after similar downside breakdowns are confirmed, the average pullback ranges from 10%-20%.
GateNews5h ago
Bitcoin Slips Below $70,000 as Fed Rate Pause and Oil Surge Pressure Markets
Bitcoin declined to $70,000 due to steady interest rates from the Federal Reserve and rising energy prices, leading to $600 million in liquidations and increased market volatility, particularly affecting altcoins.
CryptoBreaking6h ago
