The recovery of Pi Coin is surprising many investors. Over the past week, the price has increased by 17.3%, thereby reducing the monthly loss to just 5.4%. In fact, in the last 24 hours, Pi Coin has continued to record a slight increase of about 0.6%.
The current market context indicates that the prospects for this recovery trend may continue to expand. Let's analyze the technical factors to understand the growth potential of Pi Coin in the near future.
The driving force of the price increase is clearly reflected on the daily and 4-hour charts.
The first sign of strength comes from the daily chart. From October 30 to November 1, the price of Pi Coin established higher lows, while the Relative Strength Index (RSI) — a tool for measuring buying and selling pressure on a scale of 0-100 — created lower lows. This divergence, known as “hidden bullish divergence”, often indicates that selling pressure is weakening and the short-term uptrend is likely to continue.
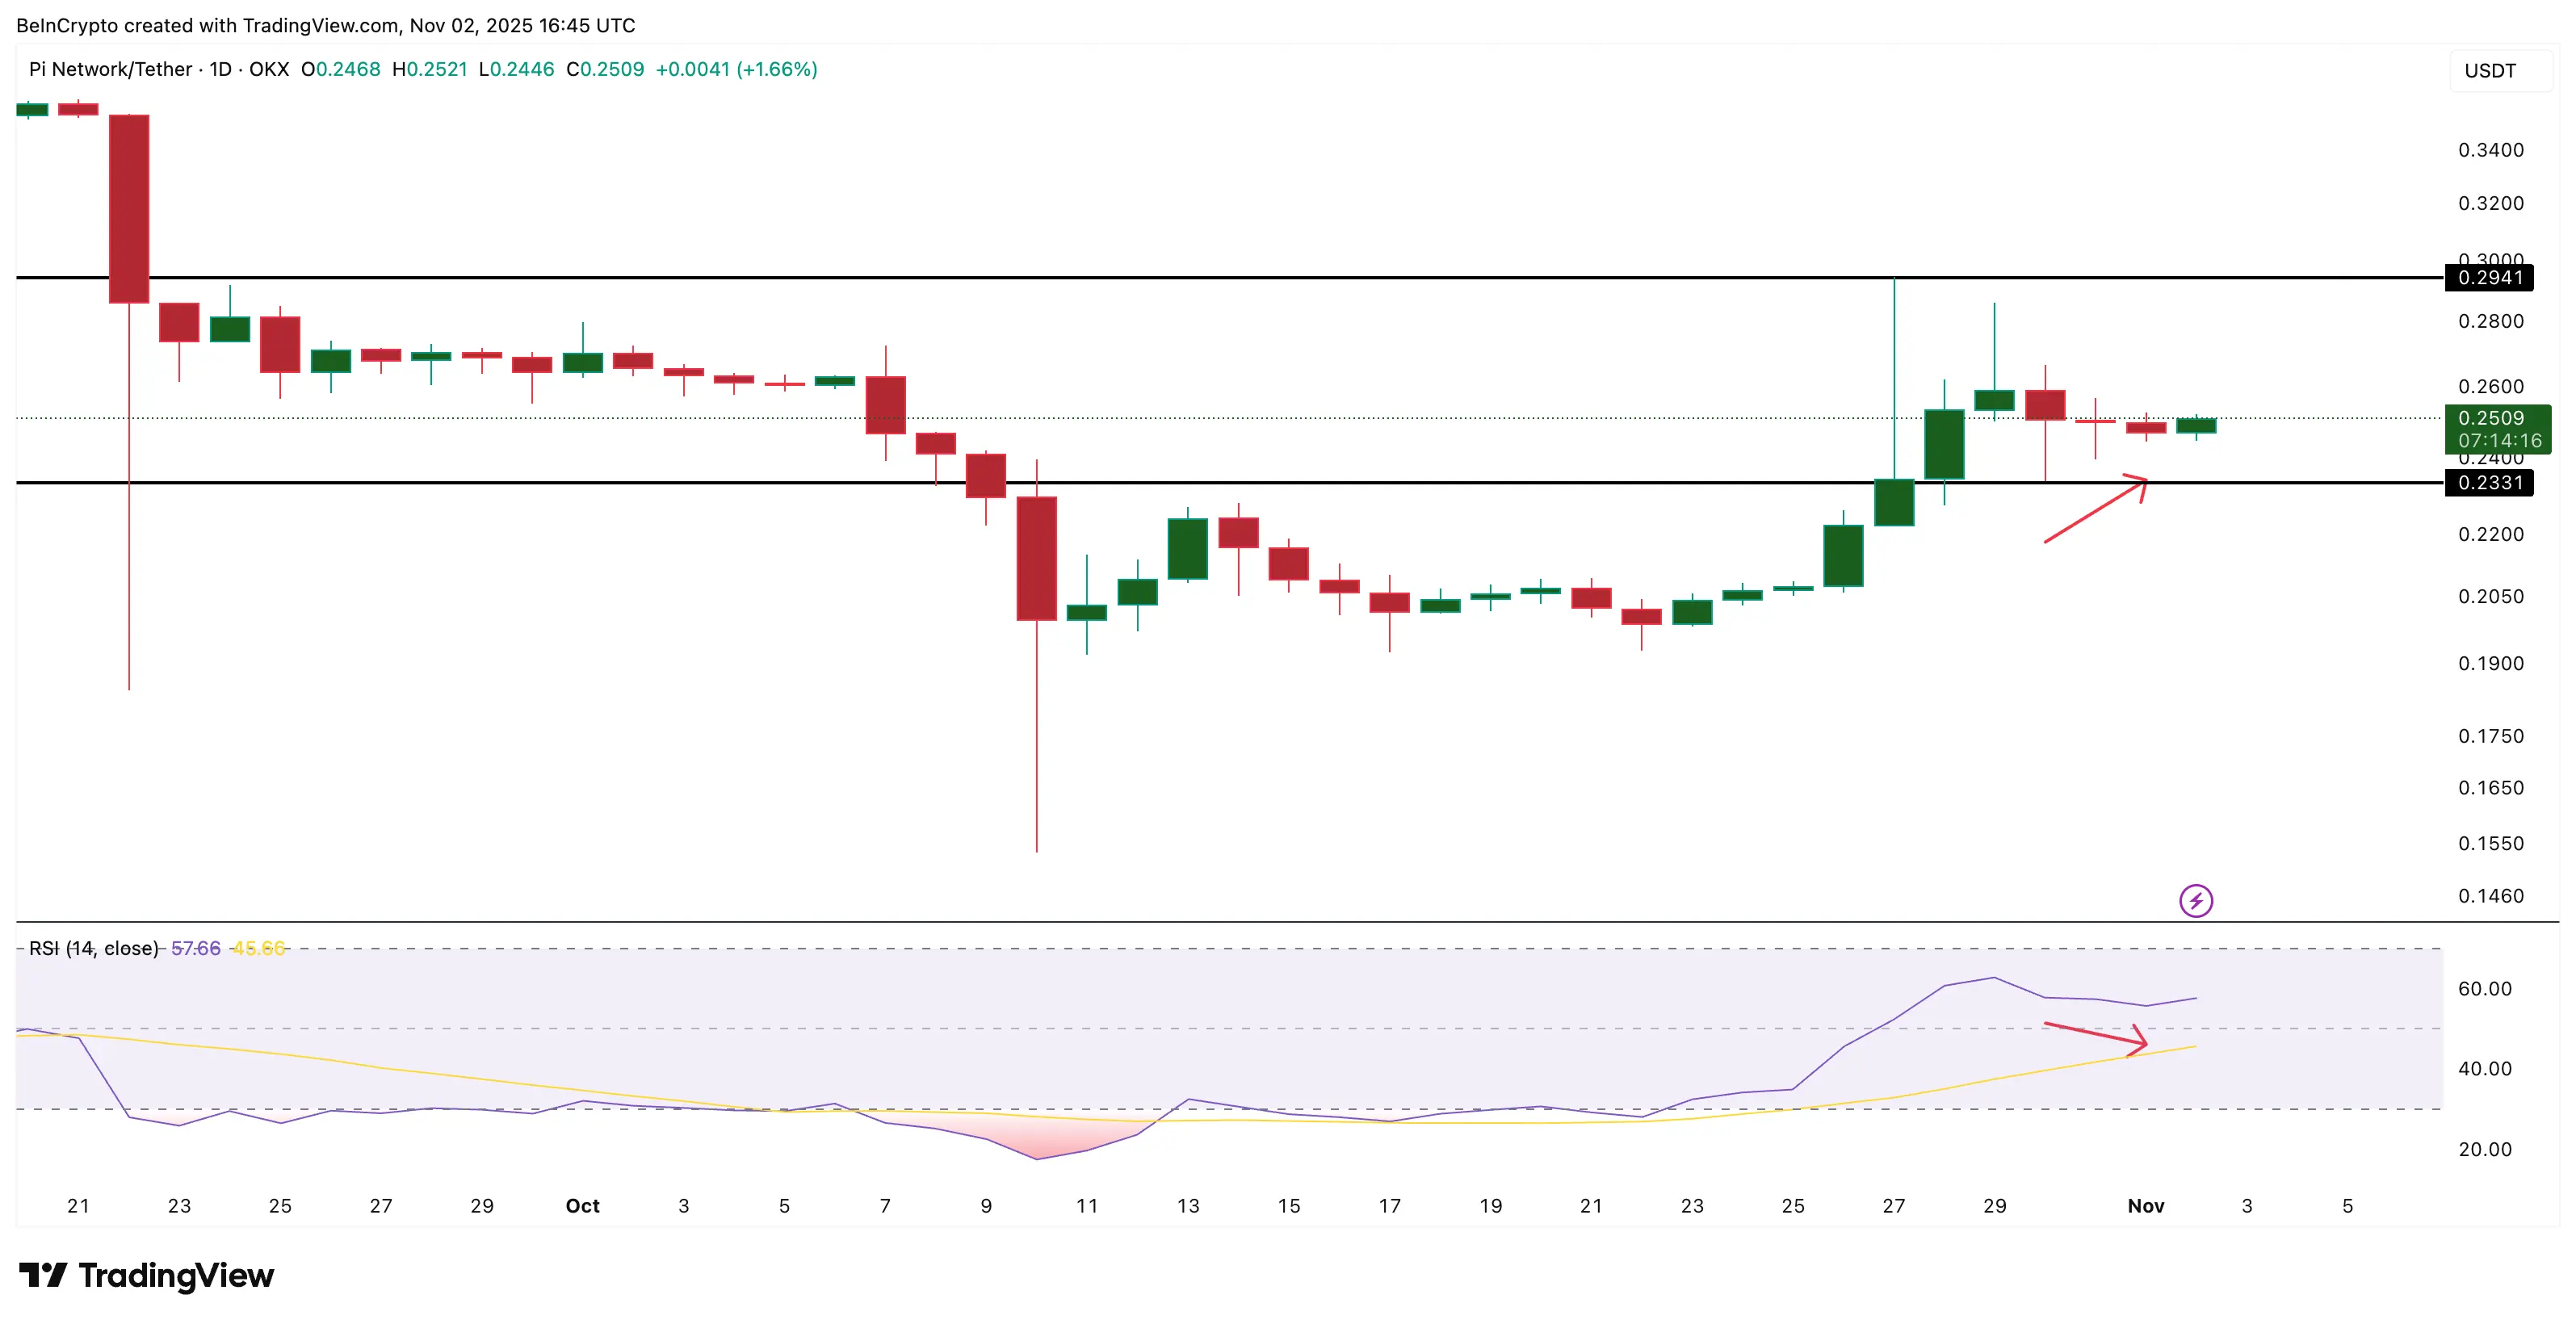 Pi Coin shows an upward price trend (daily time frame) | Source: TradingViewThe RSI model on the daily chart is also similar to the movement on the 4-hour chart. The 50-period Exponential Moving Average (EMA) is approaching a crossover above the 200-period EMA.
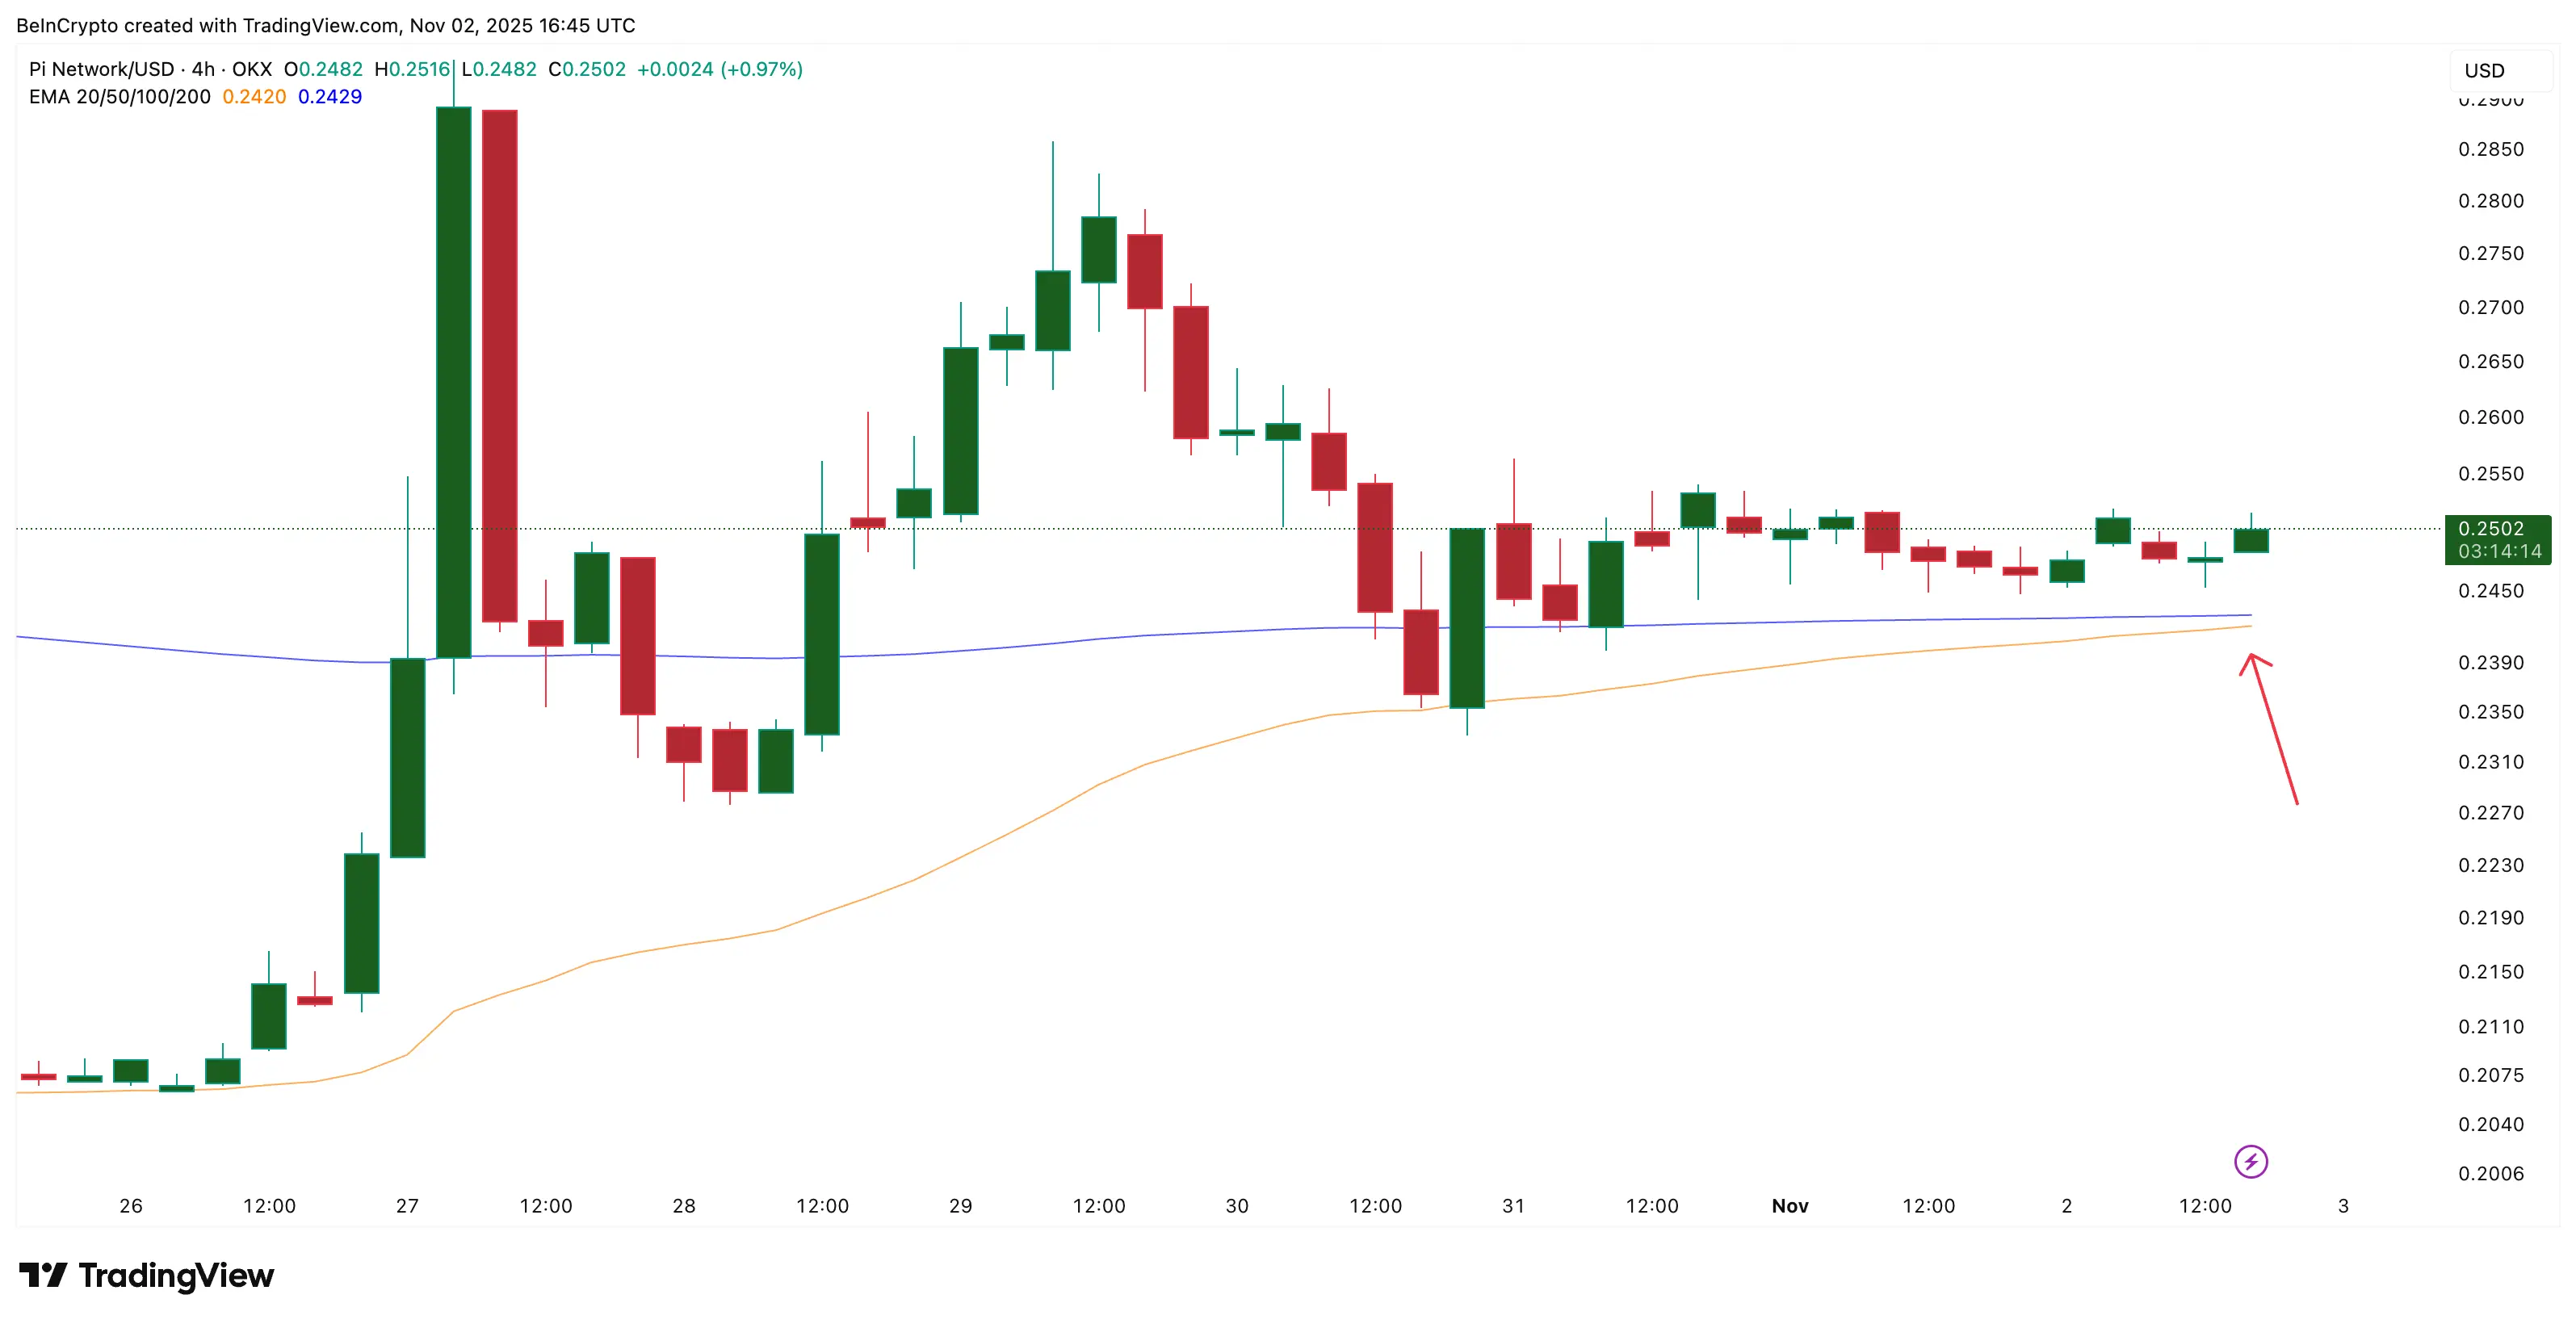 4-The chart shows a bullish crossover | Source: TradingViewThis is the “golden crossover” signal that traders often see as a sign of increasing growth momentum. If this crossover materializes, confidence in the short-term recovery potential of Pi Coin will be further reinforced.
Retail capital flow maintains its vibrancy
An important factor helping the price of Pi Coin maintain its upward momentum is the active participation of retail investors. The Money Flow Index (MFI) — which combines price and trading volume to measure buying and selling pressure — has consistently established higher peaks since October 24.
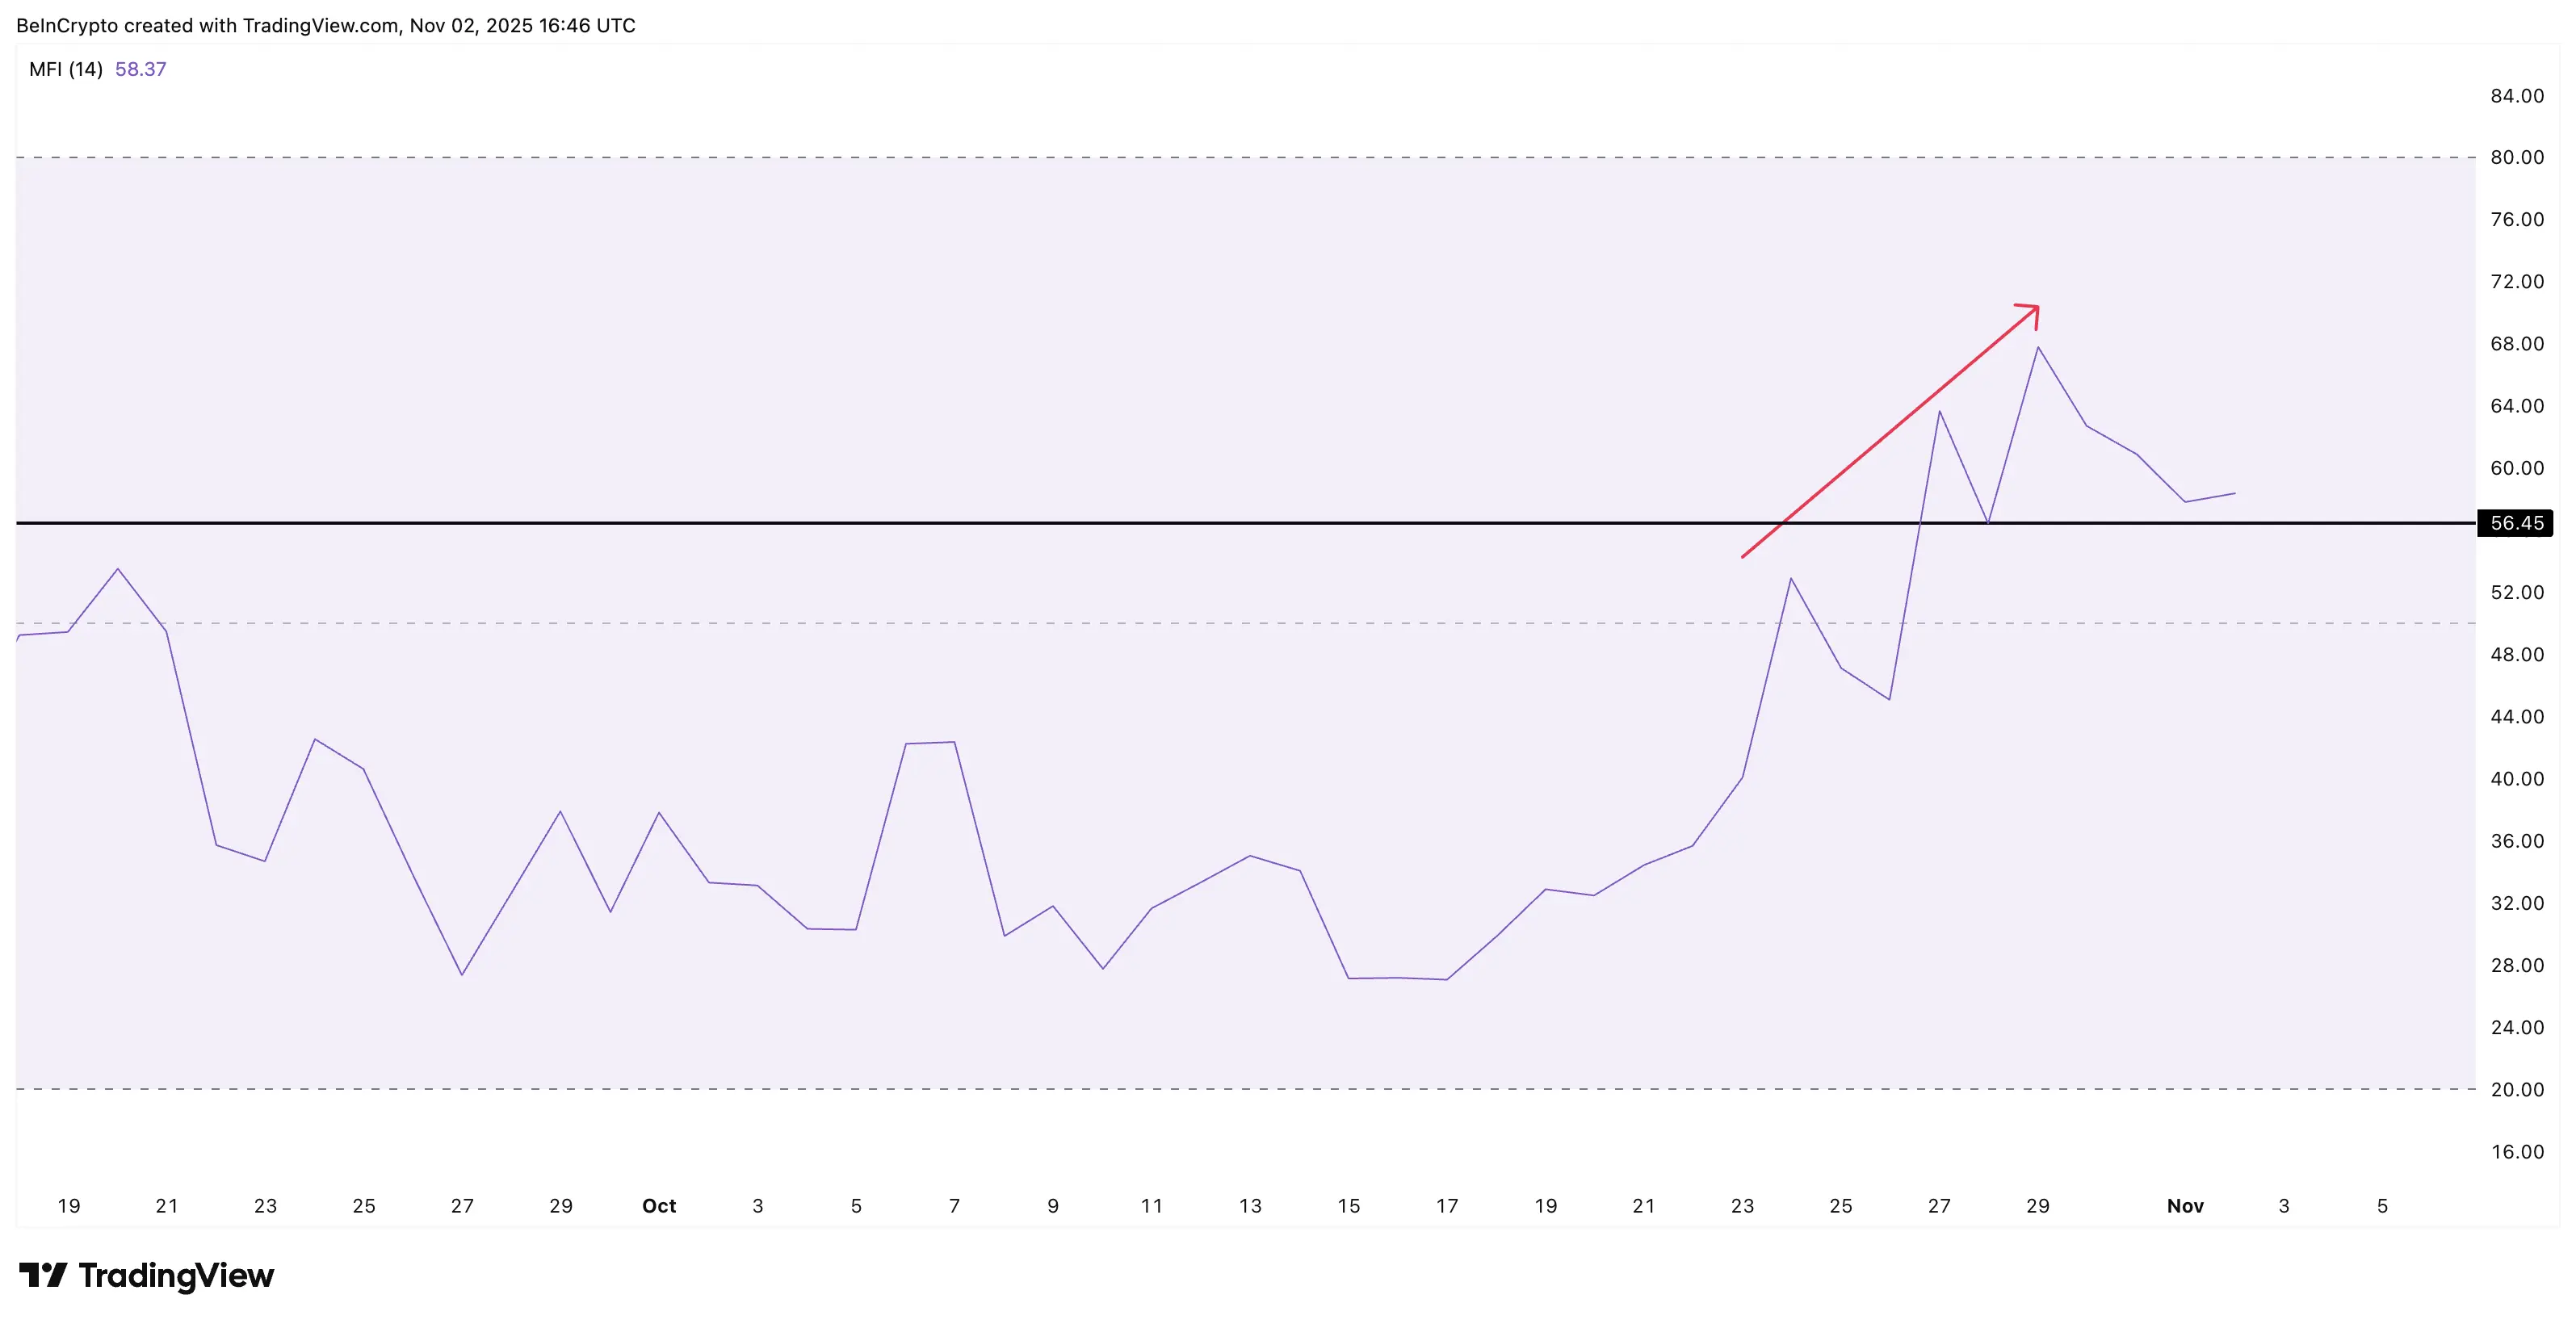 Retail investors are still actively participating | Source: TradingViewAfter a slight decline on October 29, the MFI has recovered, reflecting new capital continuing to flow into the market. Currently, this index is at around 58, surpassing the neutral mark of 50. As long as the MFI remains above 56.45 and does not create a lower low, this indicates that investors are still actively buying during price corrections, contributing to the continued recovery momentum of Pi Coin.
Important price milestones to note
On the Pi Network price chart, the first important resistance area is at $0.255. If the price closes above this level, Pi Coin could advance to the $0.270 area, which represents an increase of 8.4% from the current price. If this level is surpassed, the next targets will be $0.293, $0.340, and $0.376 for further expansion growth phases.
On the contrary, the level of $0.21 is the first important support area. If the price falls below this threshold, $0.194 will be the final “stronghold”. However, if $0.194 is breached, the current upward trend will be broken, and Pi Coin may face a deep correction towards the area of $0.153.
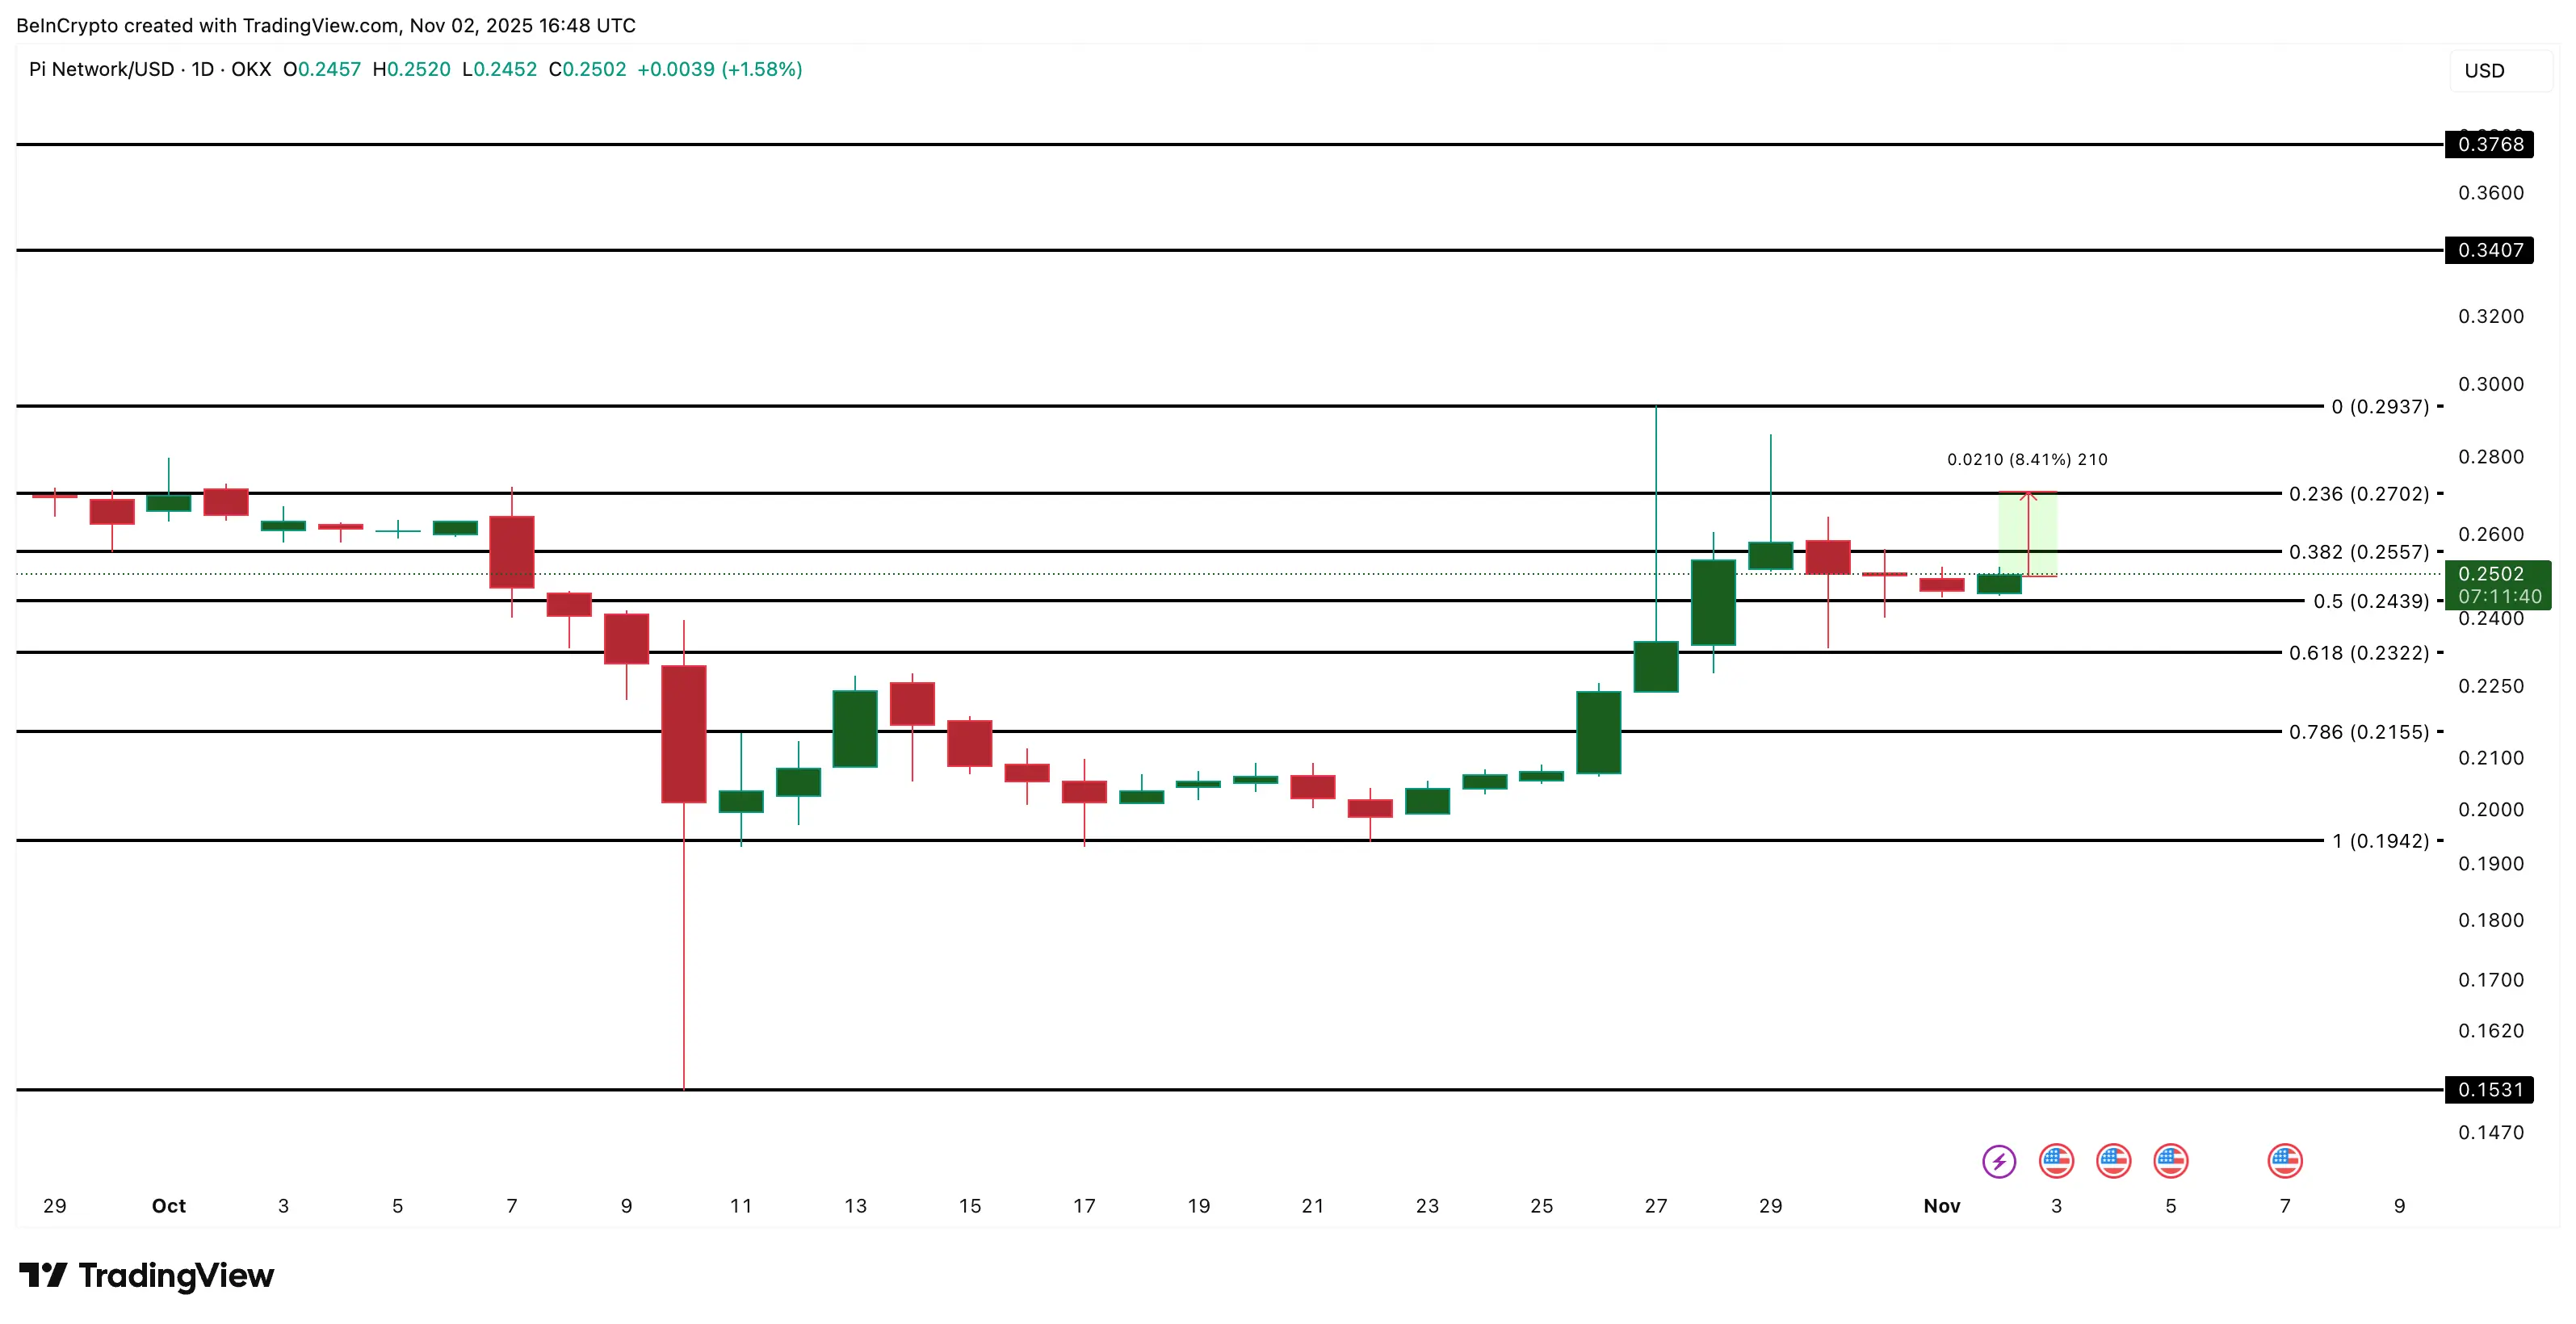 Pi Coin price analysis | Source: TradingViewCurrently, momentum indicators and cash flow from retail investors are still supporting the recovery of Pi Coin. However, to maintain this trend, the price needs to stay above $0.243 and soon break through the resistance level of $0.255 in the coming days.
Mr. Giáo
Disclaimer: The information on this page may come from third parties and does not represent the views or opinions of Gate. The content displayed on this page is for reference only and does not constitute any financial, investment, or legal advice. Gate does not guarantee the accuracy or completeness of the information and shall not be liable for any losses arising from the use of this information. Virtual asset investments carry high risks and are subject to significant price volatility. You may lose all of your invested principal. Please fully understand the relevant risks and make prudent decisions based on your own financial situation and risk tolerance. For details, please refer to
Disclaimer.
Related Articles
Pi DEX integrates DeFi, establishing a dual-track asset trading mechanism for Pi coins.
Pi Network expands token trading channels through Pi DEX (decentralized exchange), strengthening the liquidity and market demand for Pi coins. Pi DEX pairs Pi coins with all other tokens, offering users a dual-track asset acquisition mechanism, including participation in practical applications and market trading. The platform's launch marks Pi Network's transition toward a mature blockchain network, but market evaluations remain cautious. In the future, Pi Network plans to further expand support for financial applications.
MarketWhisper36m ago
Pi Network Announces v23 Upgrade Roadmap: Smart Contracts and Node Ecosystem as the Core
Pi Network announced a phased plan to upgrade nodes to v23. Version 21.2 will be deployed in April 2026, with future versions supporting smart contracts and enhancing node tools and autonomy. Market feedback is cautiously optimistic, but past delays have kept users on hold. The next few months will be a critical window.
GateNews18h ago
Pi Network (PI) ends 7 months of silence: volatility surges + negative correlation, Bitcoin's rise actually becomes a bearish signal?
Pi Network (PI) has experienced 7 months of low-volatility compression, leading to a clear change in market structure, with the current price around $0.1883. Recent volatility has rebounded above 100%, indicating a new phase in the market, but its rebound potential may be limited by its negative correlation with Bitcoin. Technical analysis shows a potential double-top pattern; if the price drops below $0.1894, it could fall to $0.1527. Short-term trends will be influenced by technical structures and changes in its correlation with Bitcoin.
GateNews18h ago
Pi Coin ends 7 months of "silence": Price ready for major fluctuations
Pi Network (PI) is currently trading around $0.1883, maintaining an accumulation near the 23.6% Fibonacci retracement level after failing to sustain an upward momentum above $0.29.
Two technical signals converging indicate that the “quiet” phase has ended — but in a bearish direction for the bulls.
TapChiBitcoin19h ago
Pi coin's 7-month low-volatility period has ended; an 108% rebound in volatility signals a major market move.
Pi Network (PI) is currently trading at approximately $0.1883, facing increased volatility and a decreasing correlation with Bitcoin. Recently, volatility has risen from 52% to 108%, indicating the end of the past seven months of compression and the potential for a significant move. However, the correlation coefficient between PI and Bitcoin has dropped to -0.30, suggesting that PI has not benefited from Bitcoin's upward trend. Technical analysis shows that if the price falls below $0.1894, it could drop to $0.1300, while holding above $0.2103 may lead to a rebound toward $0.2442.
MarketWhisper21h ago
Pi Network Price Drop Alert: Token Unlock and Profit-Taking Trigger Selling Concerns
Pi Network's price fell approximately 37% this week, failing to break through the key resistance level of $0.20. Supply-side pressure has increased, including large-scale token unlocks and rising exchange reserves, while weak demand is reflected in declining trading volume. In the short term, technical indicators lean bearish, with $0.17 as the key support level for bulls; a break below could lead to further downside toward $0.15. Overall market sentiment is influenced by geopolitical factors, and any rebound will require volume support.
MarketWhisper23h ago
