
There are various ways to make a lot of money from cryptos. Everything comes down to getting into the right opportunity at the right time. A top analyst recently shared a detailed breakdown of Arbitrum and why ARB price could create millionaires for those who understand the structure and act with patience.
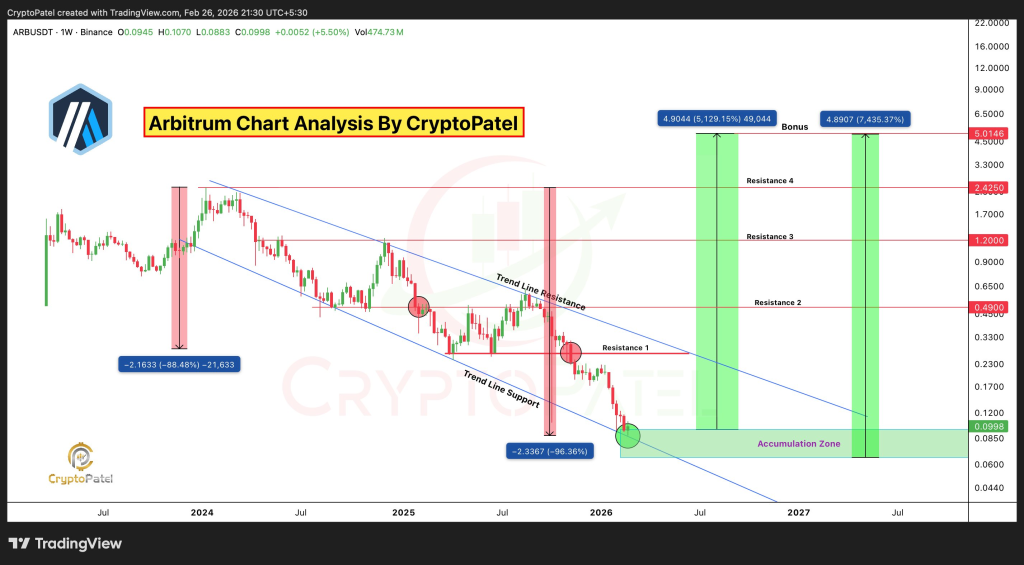
Crypto Patel laid out his case clearly. He pointed to the brutal reality first. ARB has dropped about 96% from its 2024 all time high of $2.42. That type of drawdown often discourages most market participants. Crypto Patel believes this is exactly where rare opportunities are found.
The chart shows ARB price moving inside a long descending channel that has been intact for almost 2 years. Each rally has been capped by a falling trendline. Each breakdown pushed price closer to the lower boundary of the channel.
Right now, ARB price is sitting at the bottom of that structure around the $0.09 to $0.06 zone. Crypto Patel describes this region as a high time frame demand block. Historical wick support appears in this area. The chart highlights heavy drawdowns of more than 88% and 96% during the decline.
That compression near the base of the channel matters. Volume absorption appears to be taking place. The candles show sideways action after the steep impulse drop. Crypto Patel frames this as a Wyckoff Phase C or early Phase D candidate. Seller exhaustion and demand absorption are key ideas in that model.
@CryptoPatel / X
Key Levels That Could Confirm A Bullish Arbitrum Trend Reversal
Crypto Patel does not claim the trend has flipped yet. He outlines clear confirmation levels. The first structural level sits at $0.23. A sustained move above that zone would mark a break of structure on the lower time frames.
The next major pivot stands at $0.49. That level aligns with the descending trendline resistance and the second resistance zone on the chart. A clean reclaim of $0.49 would signal a broader regime change.
Beyond that, upside targets expand toward $1.20, $2.42, and eventually $5 if the full structure flips bullish. The chart even maps a possible cycle expansion between 5,129% and 7,435% from the current base. Those projections depend entirely on structure holding above $0.06. A breakdown below $0.06 would invalidate the accumulation thesis.
Silver Price Manipulation? $1.6B Jane Street Position Raises Red Flags_**
Crypto Patel describes ARB as a high beta Layer 2 leader trading at a maximum confluence demand zone. Channel support, high time frame demand, Wyckoff accumulation, and seller exhaustion align in the same region. That cluster of signals forms the core of his thesis.
He emphasizes that this is a patience zone. Momentum traders often prefer chasing strength near resistance. Crypto Patel argues that asymmetric risk reward tends to appear when charts look the worst.
Disclaimer: The information on this page may come from third parties and does not represent the views or opinions of Gate. The content displayed on this page is for reference only and does not constitute any financial, investment, or legal advice. Gate does not guarantee the accuracy or completeness of the information and shall not be liable for any losses arising from the use of this information. Virtual asset investments carry high risks and are subject to significant price volatility. You may lose all of your invested principal. Please fully understand the relevant risks and make prudent decisions based on your own financial situation and risk tolerance. For details, please refer to
Disclaimer.
Related Articles
XRP Price Consolidates Under $1.5 — What Could Drive the Next Move to $2? - BTC Hunts
XRP is struggling to maintain its price above $1.40 amidst selling pressure and a bearish market. Key resistance at $1.48 and support at $1.33 will determine its next movement, with potential for upswing to $1.60 or a drop towards $1.20.
BTCHUNTS10m ago
Stock and bond sell-off, BTC holds the 70,000 level, Bitcoin outperformed gold this week
The ongoing military actions by the US and Israel against Iran continue to impact the market. Oil prices surged, causing US stocks and Bitcoin to decline, but Bitcoin's decline was smaller, and it outperformed gold this week. Disrupted energy supplies have sparked inflation concerns, leading to simultaneous declines in stocks and bonds. Investors remain optimistic about cryptocurrencies, with significant capital inflows.
ChainNewsAbmedia33m ago
Did Kaspa (KAS) Price Just Hit Its Cycle Low? Analyst Breaks Down What Could Happen Next
Kaspa (KAS) may be nearing a price bottom as it approaches key technical indicators like Fibonacci levels and a long-term trendline. Analysts suggest the cryptocurrency could stabilize around $0.24, potentially paving the way for a future upward move towards $1, contingent on market conditions.
CaptainAltcoin3h ago
Polkadot to Reset Tokenomics on March 12 With Major DOT Supply and Staking Changes
Polkadot will introduce a new monetary framework on March 12 that sets DOT’s supply cap at 2.1 billion and lowers emissions by 53.6%.
The overhaul will also create a Dynamic Allocation Pool and shorten the DOT unbonding period from 28 days to 24–48 hours.
On March 12, Polkadot will reset
CryptoNewsFlash4h ago
Solana Eyes $90.6 Trigger Point as $83 Support Holds and Liquidation Pressure Builds
A large cluster of short positions faces liquidation if SOL reaches $90.6, potentially increasing volatility.
SOL trades between $83.00 support and $89.58 resistance, keeping price action compressed in the short term.
SOL posts a 0.8% daily gain and rises 0.7% against BTC, holding
CryptoNewsLand4h ago
Will XRP Hold $1.33 or Extend Toward $1.30 Before Rebound?
XRP is currently trading at $1.35, experiencing a 1.3% decline. Key support is at $1.34, while resistance is at $1.40. The price is testing around the Fibonacci levels of $1.33 and $1.30, crucial for potential upward movement or deeper decline.
CryptoNewsLand4h ago

