Huge Move Incoming for BTC? Price Squeezing Around $31K (Bitcoin Price Analysis)
CryptoPotato
Bitcoin has been consolidating for a prolonged period after encountering significant resistance around the $30K mark. The forthcoming price movement remains uncertain, as it depends on whether the price manages to breach this crucial level or faces rejection.
Technical Analysis
By Shayan
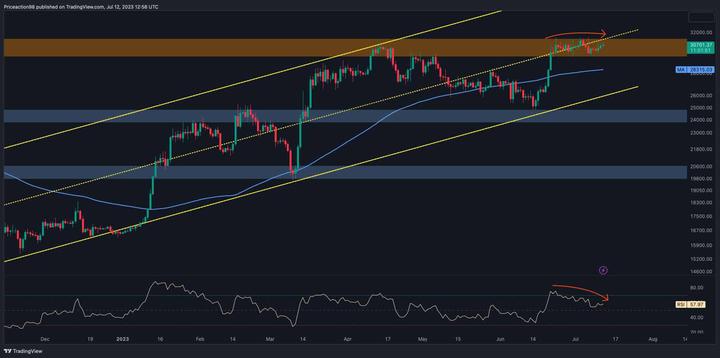
The Daily Chart
The presence of a healthy bullish trend can be identified by observing the price’s formation of higher highs and higher lows. A detailed analysis of Bitcoin’s daily chart reveals a consistent pattern of higher highs and lows since early 2023. However, this upward trend was halted when the price encountered strong psychological resistance around the $30K mark, leading to an extended period of consolidation.
On the other hand, a noticeable divergence between the price and the RSI indicator indicates a shift in the market condition from a trending state to a more steady-ranging state. Should the selling pressure prevail, Bitcoin’s next target would be the 100-day MA positioned around the $28K level.
Nevertheless, a break above the $30K resistance zone could trigger a rapid surge in price toward higher resistance levels. This is due to the presence of a substantial number of buy-stop orders above this crucial price area, potentially causing a short-squeeze event.
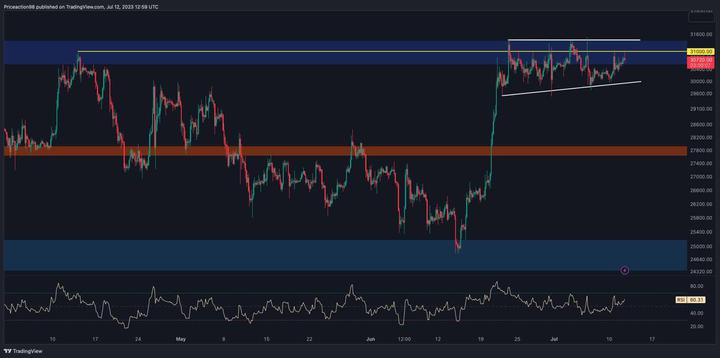
The 4-hour chart demonstrates that Bitcoin’s price is experiencing a strong upward movement from the significant support level at $25K, reaching $30K, as well as the previous major swing high.
Subsequently, the price entered a corrective phase characterized by sideways price action. In the meantime, the price has formed an ascending wedge pattern, generally indicating a possible reversal. A drop below the lower boundary of the wedge suggests a potential reversal for the mid-term outlook.
It is important to mention that the $30K resistance level also possesses significant psychological resistance, heightening the likelihood of a mid-term rejection from this critical price level. However, if rejection does occur, Bitcoin’s next target would be the static support region at $27.5K.
By Shayan
Valuing companies in traditional stock markets has long relied on the price-earnings ratio (PE Ratio), which simply compares a company’s share price to its earnings per share. A high PE Ratio suggests either overvaluation or a company experiencing rapid growth.
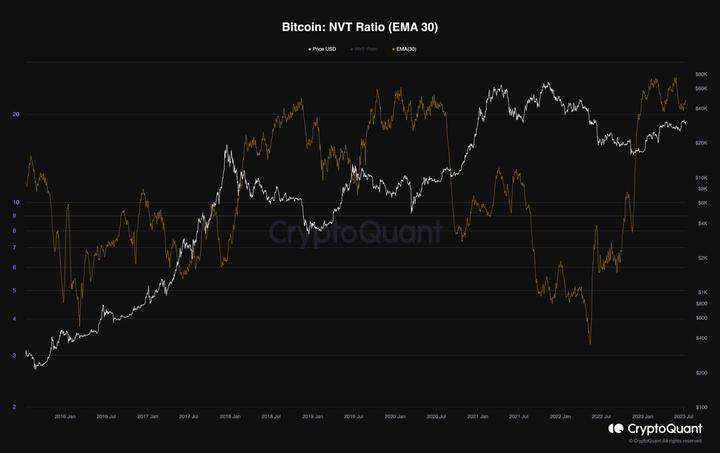
However, the question arises: what is the equivalent measure in the realm of Bitcoin? The NVT Ratio, also known as the Network Value to Transactions Ratio, bears a resemblance to the PE Ratio employed within stock markets.
It is derived by dividing the Network Value (market cap) by the daily USD volume transmitted through the blockchain. A high NVT Ratio for Bitcoin indicates that its network valuation is surpassing the value transacted on its payment network. This situation typically occurs during periods of rapid growth, where investors perceive Bitcoin as a high-yield investment, or during unsustainable price bubbles.
The graph below illustrates a remarkable surge in the NVT metric, reaching a multi-year high. This development signifies an overall bullish market sentiment, which could lead to long-term price appreciation.
免責事項:このページの情報は第三者から提供される場合があり、Gateの見解または意見を代表するものではありません。このページに表示される内容は参考情報のみであり、いかなる金融、投資、または法律上の助言を構成するものではありません。Gateは情報の正確性または完全性を保証せず、当該情報の利用に起因するいかなる損失についても責任を負いません。仮想資産への投資は高いリスクを伴い、大きな価格変動の影響を受けます。投資元本の全額を失う可能性があります。関連するリスクを十分に理解したうえで、ご自身の財務状況およびリスク許容度に基づき慎重に判断してください。詳細は免責事項をご参照ください。
コメント
0/400
コメントなし