Ripple Surprises with Massive Move: Here_s the Most Important Target (XRP Price Analysis)
Ripple’s price soared by almost 10% today before retracing to where it’s currently trading at. Now, let’s have a look at what this implies and where it might be headed next.
Technical Analysis
By Edris
Ripple’s price has recently risen, leaving investors wondering if a new bullish trend is on the horizon. However, there is still an important resistance level to overcome.
The USDT Paired Chart
On the USDT paired chart, the price is breaking above both the 50-day and 200-day moving averages, converging around the $0.52 mark.
If the market holds above this area, the key resistance level of $0.55 would be the next target. Breaking out from this level would initiate a new rally in XRP’s price, with the market likely to move towards the $0.9 level in the coming months.
 Source: TradingView### The BTC Paired Chart
Looking at the BTC paired chart, the situation appears similar. The price has been supported by the 200-day moving average and is climbing above the 50-day moving average around the 2000 SAT mark.
A successful bullish breakout would pave the way for the price to surge towards the 2200 SAT zone in the short term. The RSI indicator has also broken above the 50% threshold, indicating that momentum is in favor of the buyers.
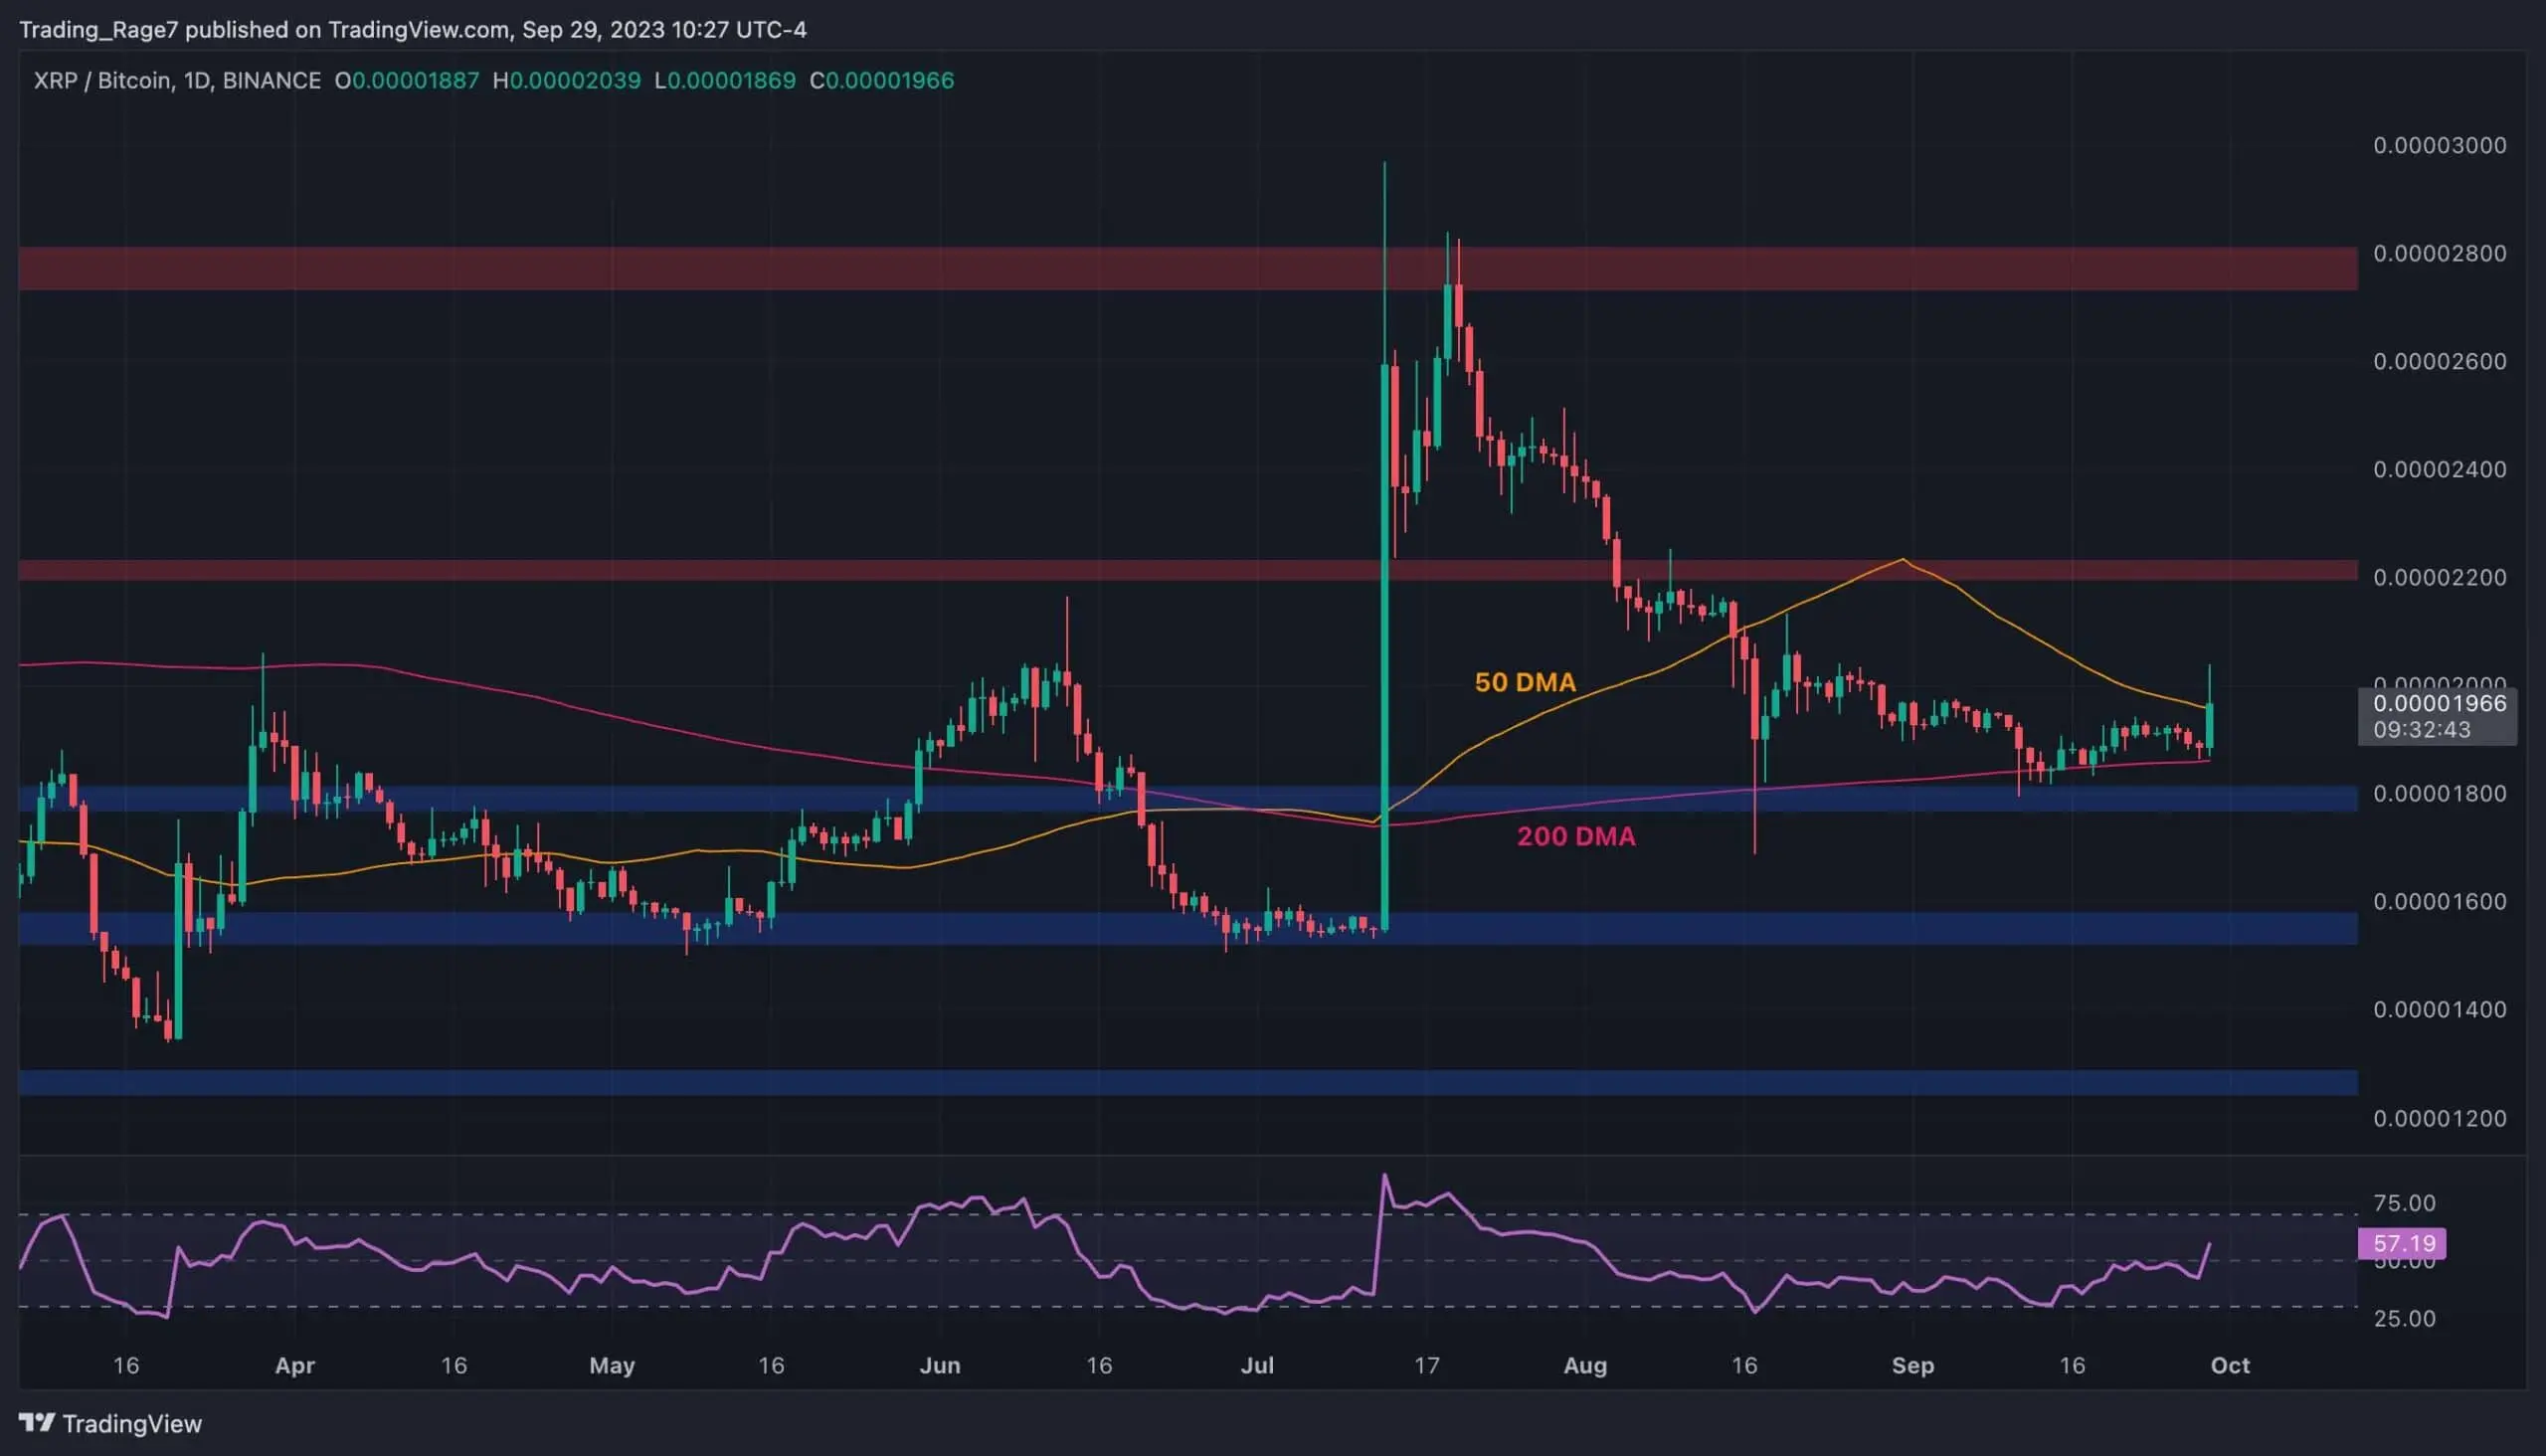 Source: TradingView