These 2 Critical Levels Will Determine XRP_s Short-Term Direction (Ripple Price Analysis)
Ripple’s future prospects appear optimistic as the price has broken above a triangle pattern that spanned multiple months and surpassed the 200-day moving average.
After forming a valid pullback, the cryptocurrency is now trending upwards. However, to generate sufficient demand in the market, the price still needs to overcome the resistance region around $0.56.
Technical Analysis
By Shayan
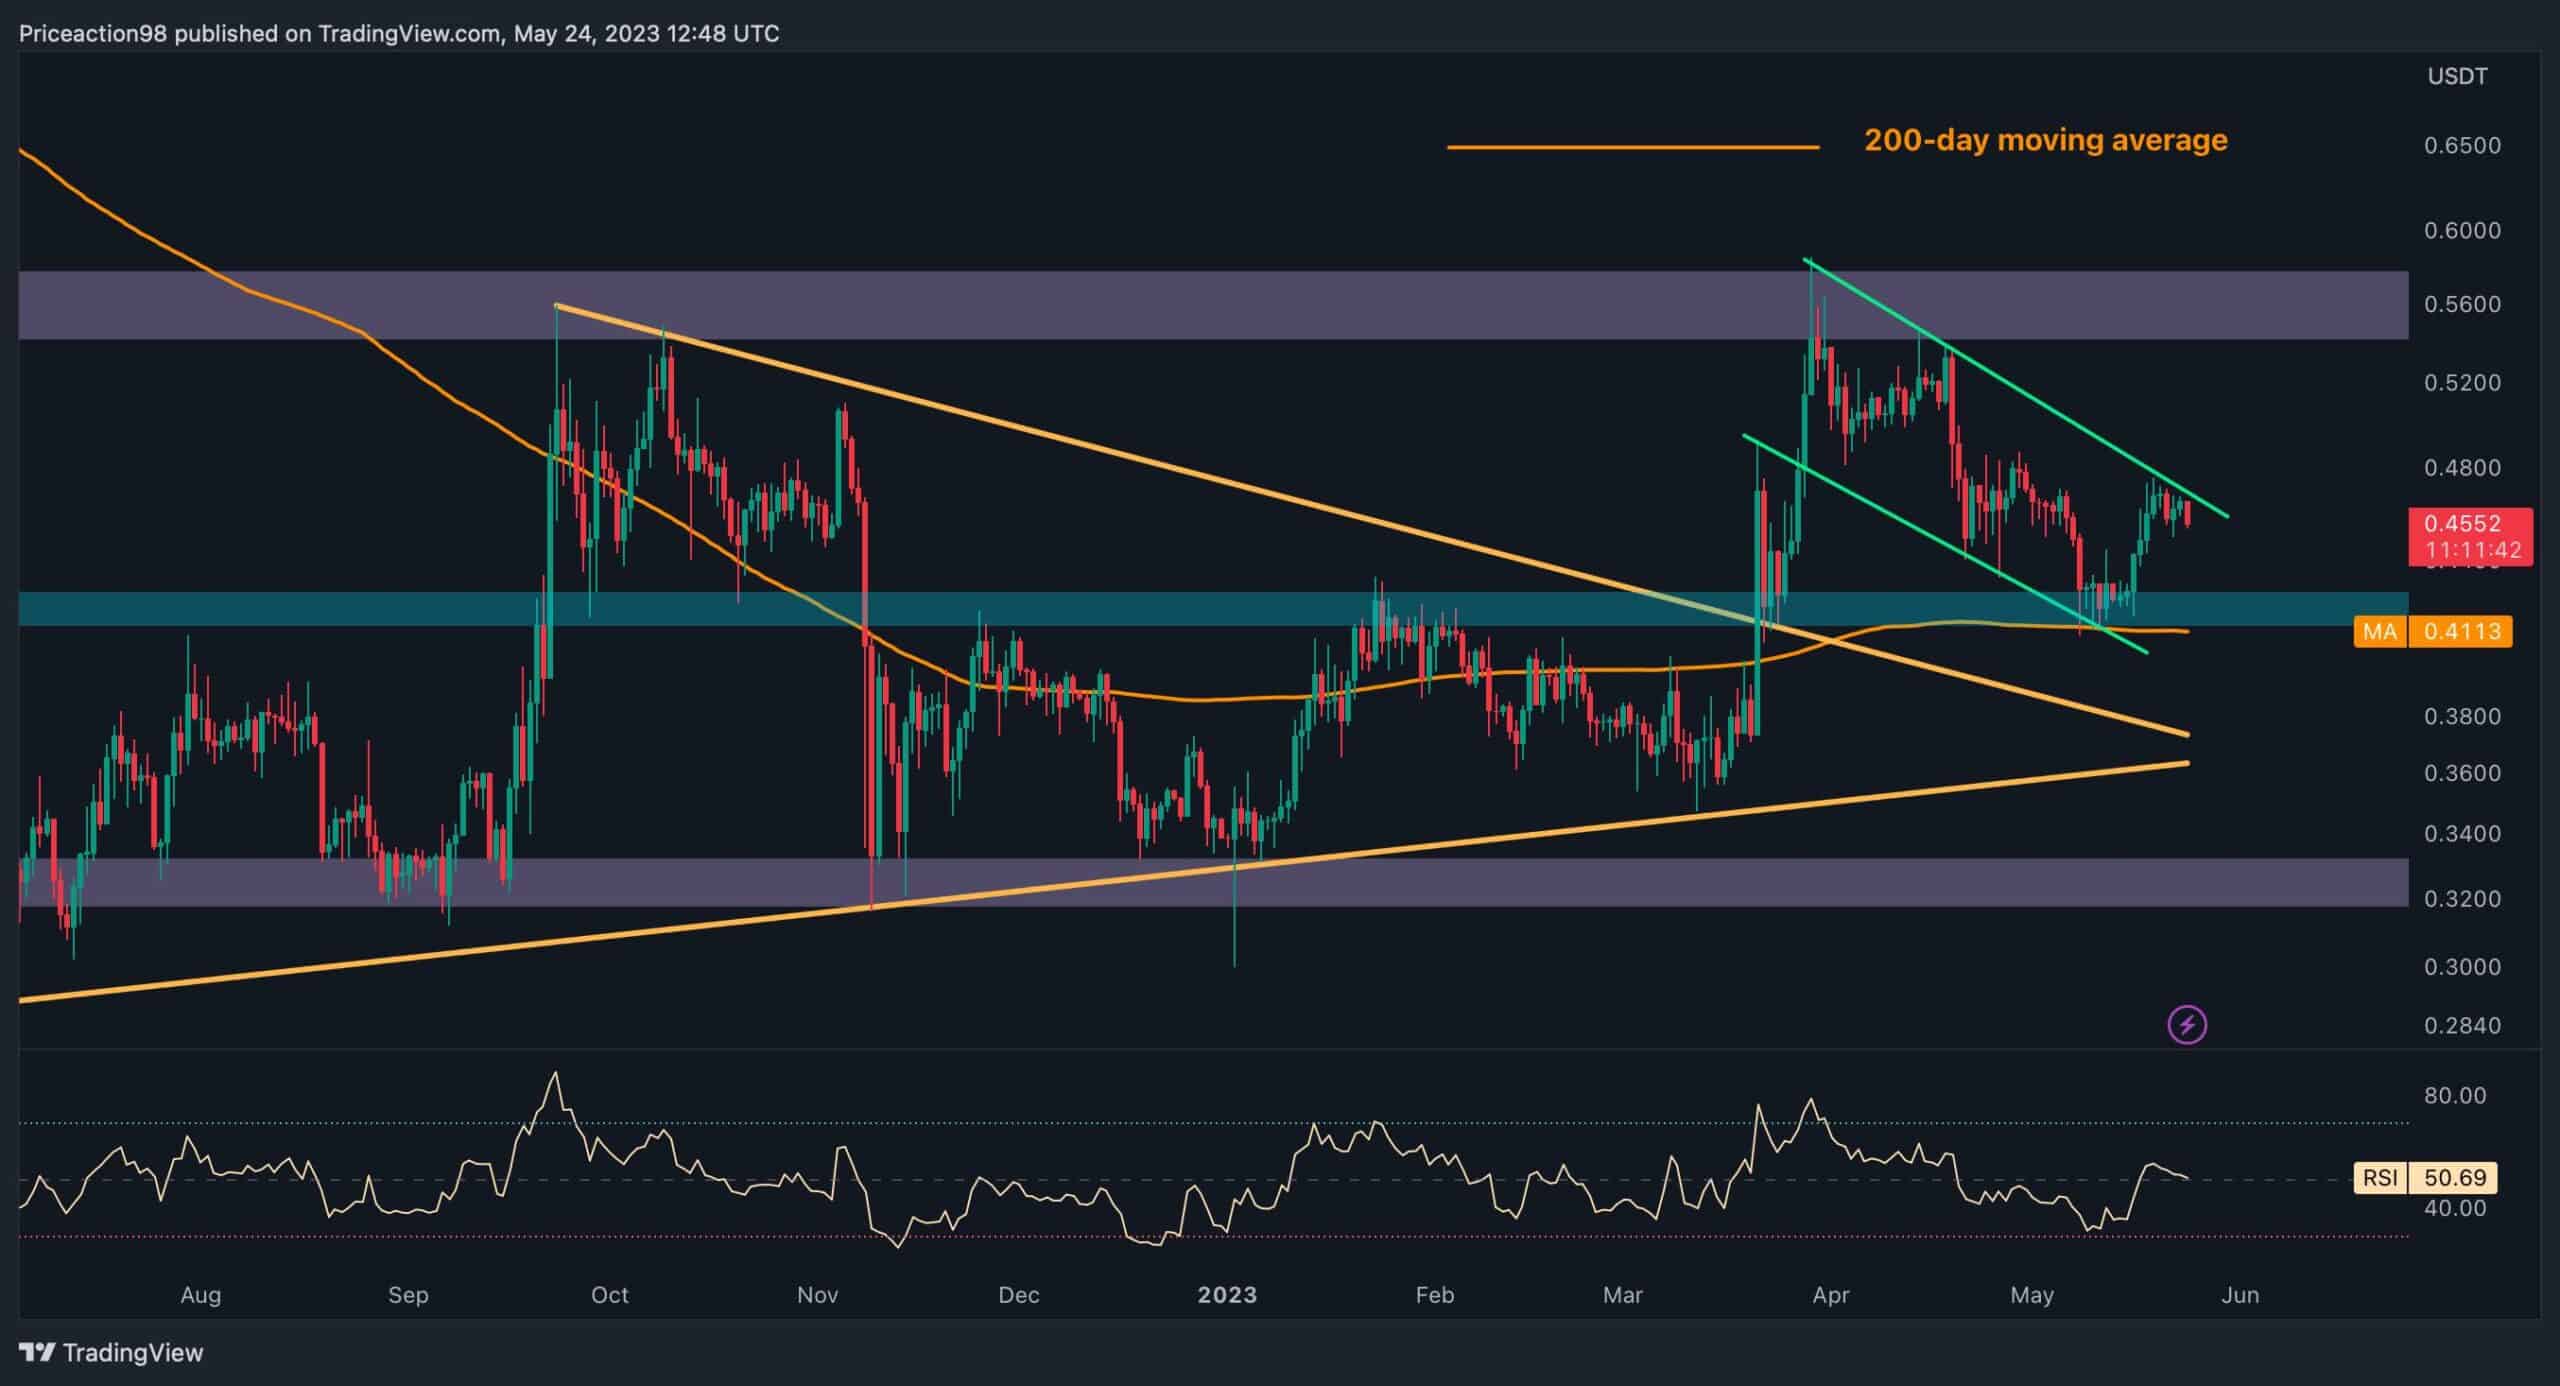
The Daily Chart
XRP retraced to the $0.41 level and the 200-day moving average before resuming its upward rally. Interestingly, during the pullback phase, Ripple formed a descending flag pattern, which is a well-known continuation correction pattern. The price is now on the verge of breaking above the upper trendline of this flag pattern.
The recent movements indicate that buyers are striving to breach the critical zone of $0.56. If successful, XRP would be more likely to embark on a long-term bullish rally accompanied by short-term correction phases.
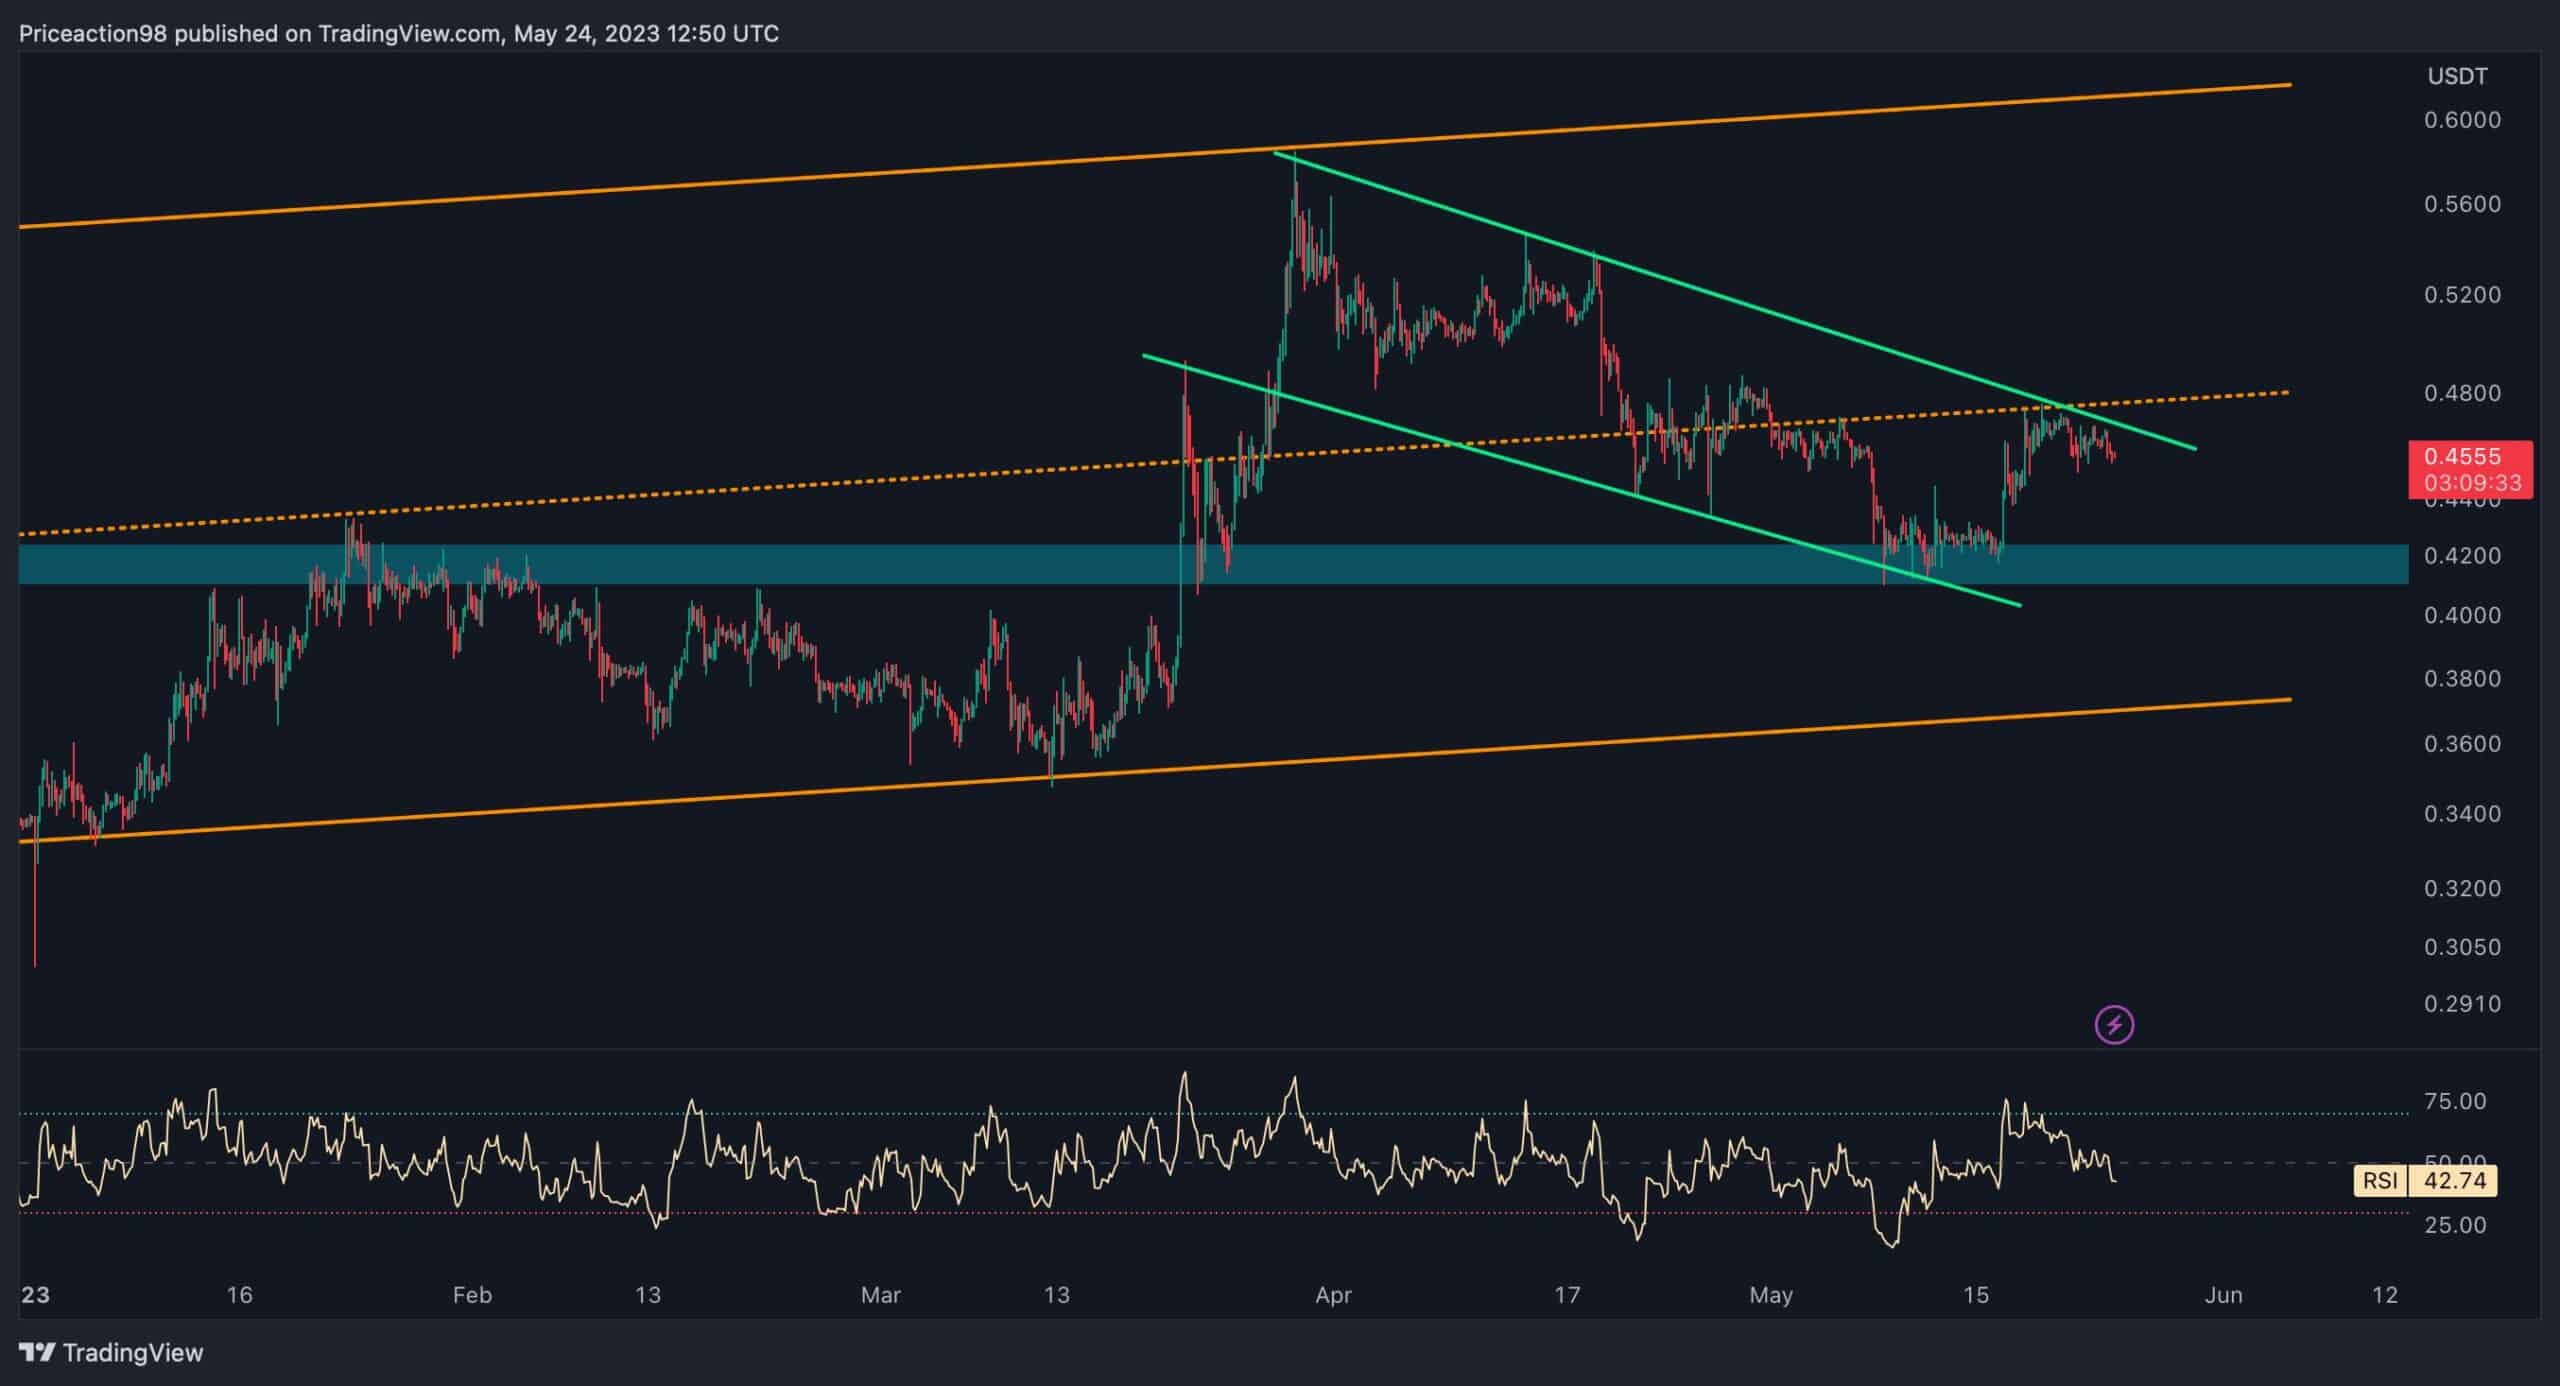
Shifting the focus to the 4-hour chart, Ripple underwent a consolidation correction phase, finding support at the significant $0.42 region. Subsequently, the price initiated a rally toward the mid-trendline of the ascending channel.
A significant resistance area is situated at $0.48, encompassing the mid boundary of the ascending channel, aligning with the upper trendline of the descending flag pattern. This serves as the primary barrier at the moment.
If the price manages to overcome this resistance, it will likely aim for the channel’s upper boundary at approximately $0.6.