
Kaspa (KAS) is moving through a rough market phase, but development on the network continues in the background.
A major hardfork is scheduled for May, introducing smart contracts and native assets through a covenant-focused upgrade. The goal is to bring programmability directly to Layer 1.
Kaspa has now processed over 600 million transactions, showing that people are still using the network and that its BlockDAG system is handling activity well.
Even with that progress, the broader market drop in late February, driven by geopolitical tension, pulled most crypto prices down, including KAS. The KAS price was not spared and is now trading around $0.02985 after testing support.
- What the Kaspa Chart Is Showing
- What the Indicators Are Saying
- Kaspa Price Targets to Watch This Week
What the Kaspa Chart Is Showing
On the 4H chart, KAS remains in a broader downtrend. Price has been forming lower highs for weeks, and each bounce has struggled to gain momentum.
The recent correction took the Kaspa price down to the range of $0.024 to $0.025, but the token has since traded sideways in the range of $0.028 to $0.031. That range now defines the short-term battle zone.
Right now, KAS is trading just under $0.03. The market is no longer falling aggressively, but it also hasn’t broken structure. It looks more like stabilization after a drop rather than a confirmed reversal.
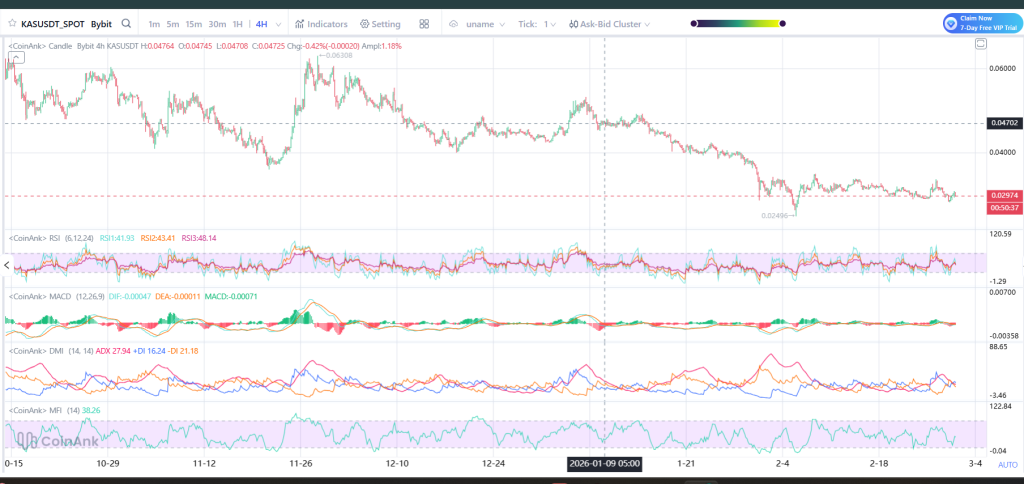
Source: Coinank
What the Indicators Are Saying
RSI is around the low 40s. That means the KAS price isn’t deeply oversold, but it’s not strong either. Buyers are not clearly in control.
MACD is flat with small bars, so there is no clear trend right now and no strong bullish signal.
DMI shows sellers slightly ahead, but not by much. The gap is small. MFI is also in the middle, which means money is flowing in and out evenly.
All of this points to one thing: the market is moving sideways, not making a big move yet.
_****Sei (SEI) Price at Historic Support as Experts Call It the “Final Gift”**
Kaspa Price Targets to Watch This Week
If KAS holds above $0.028, the next price to look at is $0.032. If it gets above $0.032, it can move toward $0.036–$0.038. After that, $0.047 is the next big level.
If the Kaspa price falls below $0.028, then $0.025 comes into view. If it drops under $0.025, the next area is around $0.022.
For now, KAS is trying to calm down after weeks of falling. The network news is positive, but the chart needs a move above $0.032 to look stronger. This week should show whether price starts climbing or tests lower levels again.
Disclaimer: The information on this page may come from third parties and does not represent the views or opinions of Gate. The content displayed on this page is for reference only and does not constitute any financial, investment, or legal advice. Gate does not guarantee the accuracy or completeness of the information and shall not be liable for any losses arising from the use of this information. Virtual asset investments carry high risks and are subject to significant price volatility. You may lose all of your invested principal. Please fully understand the relevant risks and make prudent decisions based on your own financial situation and risk tolerance. For details, please refer to
Disclaimer.
Related Articles
Bitmine advances to the NYSE main board! Tom Lee: The US stock market may have bottomed out, and selling pressure on Ether could ease
Bitmine has officially moved from the NYSE American board to the main board in the United States, marking a major milestone for the company. Despite a sharp drop in its stock price, it has still increased its share buyback plan by raising the authorization to $4 billion. The company holds a large amount of Ethereum, and predicts that a rebound in the crypto market will help improve its assets and stock performance.
CryptoCity8m ago
Solana Foundation Partners Triton One to Redesign Onchain Data Layer as SOL Gains 3%
The Solana Foundation is collaborating with Triton One to enhance its on-chain data access layer, improving scalability and data retrieval. The redesign features two core modules: Accounts for adaptive indexing and Ledger for efficient historical data management. SOL is currently trading around $84.
GateNews1h ago
Bitmine promoted to the NYSE Main Board! Tom Lee: U.S. stocks may be at a bottom, and selling pressure on Ether could ease
Bitmine has officially moved from the NYSE American board to the main board in the U.S., marking an important milestone for the company. Despite a sharp drop in its share price, it has still increased its share repurchase program to $4 billion. The company holds a large amount of Ether (ETH), and expects that a rebound in the crypto market will help improve its assets and share price performance.
CryptoCity3h ago
Bitcoin Reclaims $76,000 as US March PPI Misses Forecasts
Bitcoin surged past $76,000 following lower-than-expected US Producer Price Index data for March 2026, which indicated a 4% year-over-year increase. The rise reflects strong market support despite declining leveraged positions.
GateNews6h ago
BTC 15-minute rise of 0.64%: a technical breakout of key resistance combined with weak liquidity amplifies volatility
2026-04-14 15:30 to 15:45 (UTC), BTC saw short-term fluctuations within the 74,795.5 to 75,319.3 USDT range, with a return of +0.64% and a range of 0.70%. During this period, market attention warmed up, volatility intensified, trading volume rose slightly compared with the previous hour, and short-term buy orders pushed the price upward quickly.
The main driver of this unusual move was BTC’s short-term technical breakout above the 74,000 USDT key resistance, which generated a long signal and triggered rapid responses from quantitative and programmatic buy orders. At the same time, because the order book depth has been rising since 2025
GateNews6h ago
ETH rose 1.06% in 15 minutes: global political stimulation and a coordinated boost to risk appetite and on-chain activity together drove the move
From 15:30 to 15:45 (UTC) on 2026-04-14, the ETH price range was 2340.75 to 2367.0 USDT. Within 15 minutes, the return rate reached +1.06%, and the amplitude was 1.12%. Market volatility intensified, and on-chain and social attention rose in tandem. Short-term trading activity increased significantly, and investor sentiment shifted to optimism.
The main driving force behind this market move is the direct impact of an international political event on risk appetite. The United States announced a blockade of the Strait of Hormuz in the Middle East region related to the White House, creating a stark contrast with peace signals reportedly coming from Iran, and it triggered uncertainty and panic sentiment in the market.
GateNews6h ago
