Ether (ETH), the native token of Ethereum, is warned it could drop by up to 40%, to the 1,200 USD zone over the next few weeks, according to an analysis of Leshka.eth’s fractal model.
Ethereum structure signals a “bull trap”
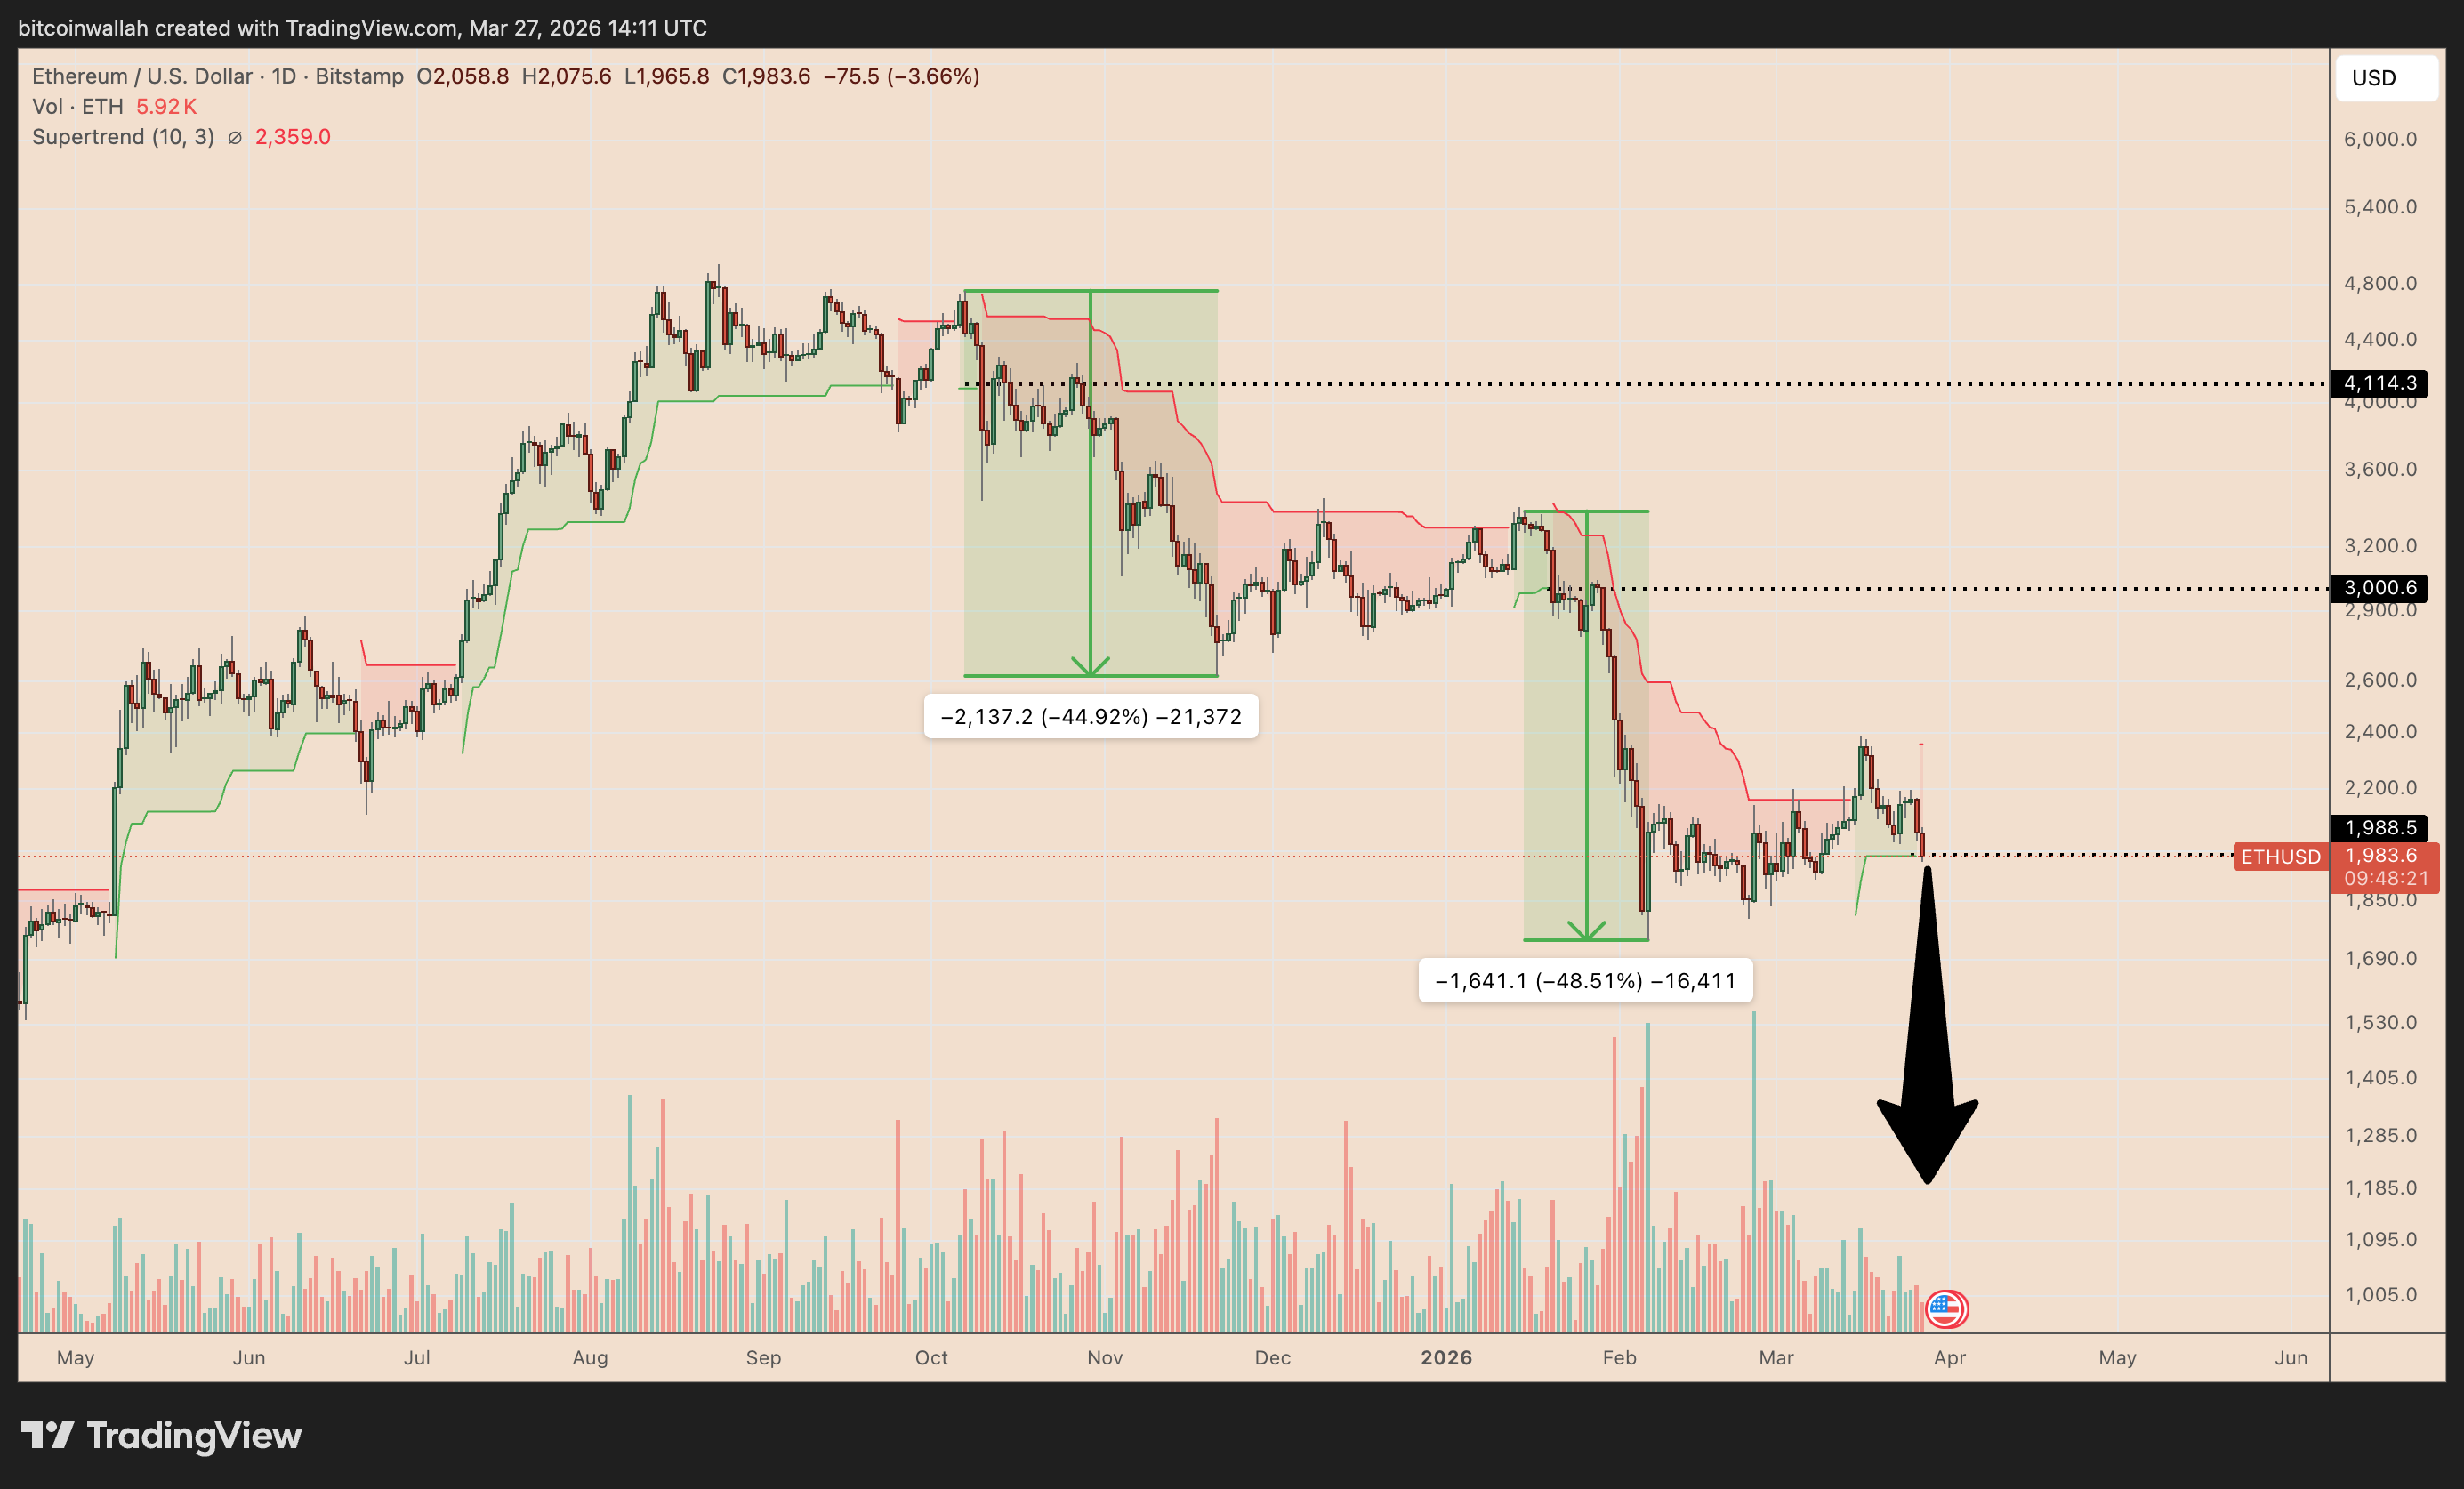
The scenario of a deep drop to 1,200 USD is built on a Supertrend signal on the daily timeframe, where two prior bullish reversals failed and were followed by strong pullback moves.
Supertrend is a trend indicator that tracks price action closely, changing colors to reflect market conditions: green indicates an uptrend and red indicates a downtrend.
Previously, ETH recorded bullish reversal signals in October 2025 and January 2026. However, neither time was able to sustain the rebound. Price moved above the upper band of the Supertrend—which acts as support—but once this level was broken, the uptrend structure quickly weakened, leading to declines of 45% and 48%, respectively.
 Daily ETH/USD price chart | Source: TradingViewRight now, a similar setup is forming around the 1,990 USD mark. According to Leshka.eth, if this price zone is breached, the next target would be the 1,200 USD area. This assessment also aligns with the downside target from a falling-flag model that is currently dominating Ethereum’s trend.
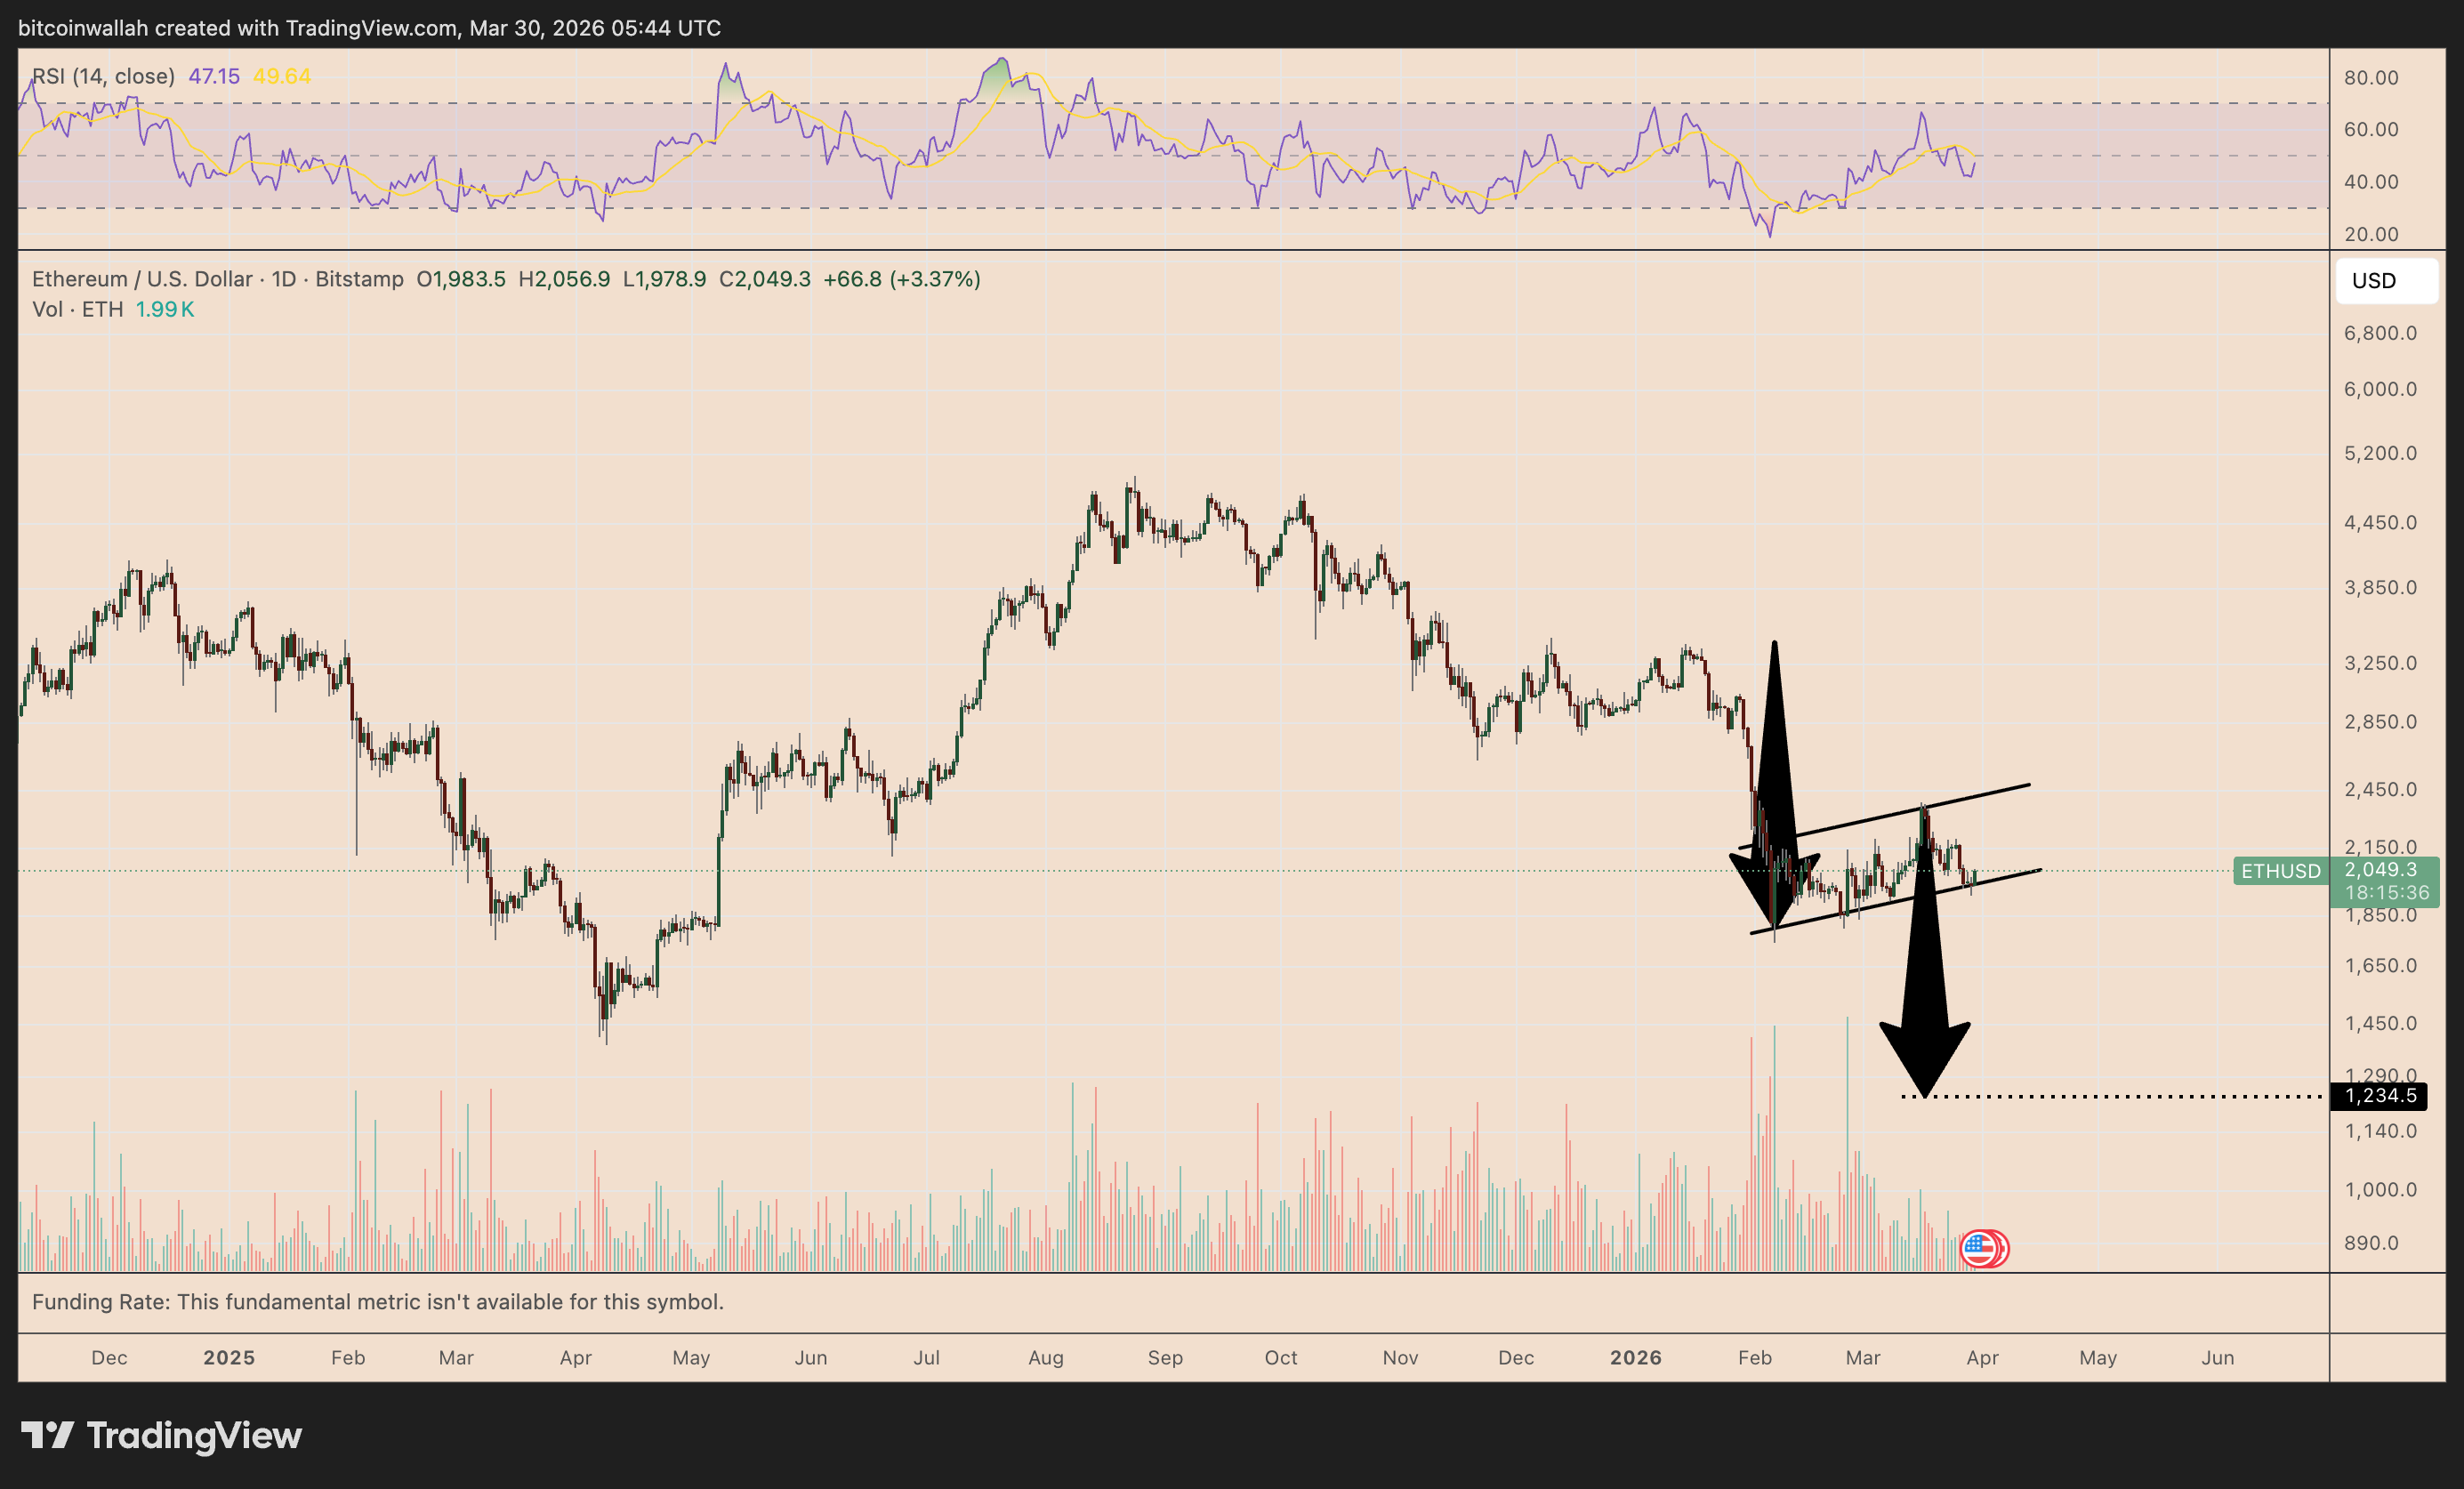 Daily ETH/USD price chart | Source: TradingViewDownward pressure is increasing as ETH gives back most of March’s gains, with the macro environment becoming less favorable. Risk appetite is weakening due to escalating geopolitical tensions between the U.S.–Israel and Iran, worries of a deeper downturn, and the bond market no longer expecting the U.S. Federal Reserve (Fed) to cut rates before December 2027.
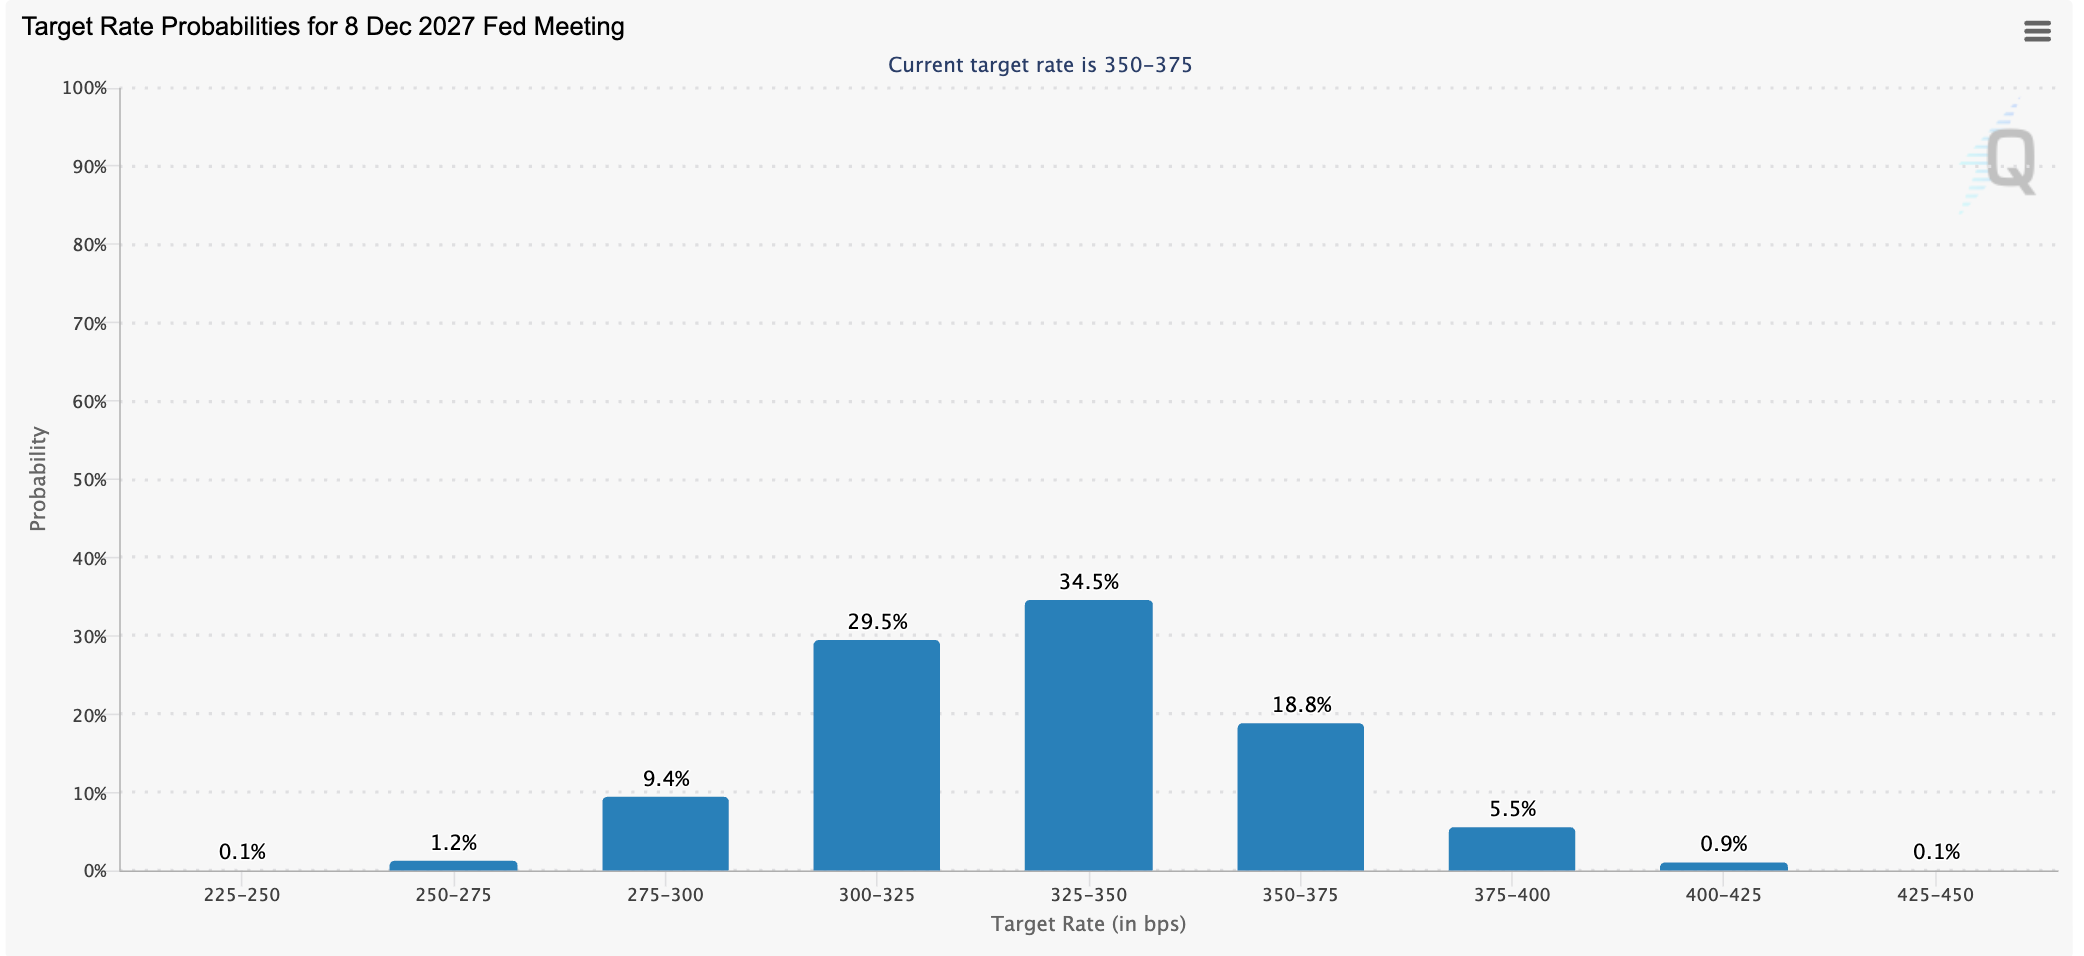 Probability of interest-rate targets for the Fed meeting in December | Source: CMEOver the past more than two weeks, ETH has fallen by over 17% from the month’s peak. Over the same period, U.S. spot Ether ETFs have seen net outflows of roughly 300 million USD, reflecting weakening demand. Notably, demand for Ethereum has fallen to the lowest level in 16 months.
Accumulation activity still lacks momentum
ETH’s most recent rebound has not been strong enough to trigger a broad-based accumulation wave, according to data from Glassnode.
The number of “whale” wallets (holding more than 10,000 ETH) has leveled off after reaching a peak at the end of 2025, while 30-day volatility has only just returned to a neutral state after a long period of decline—indicating that large holders have not returned to strong accumulation.
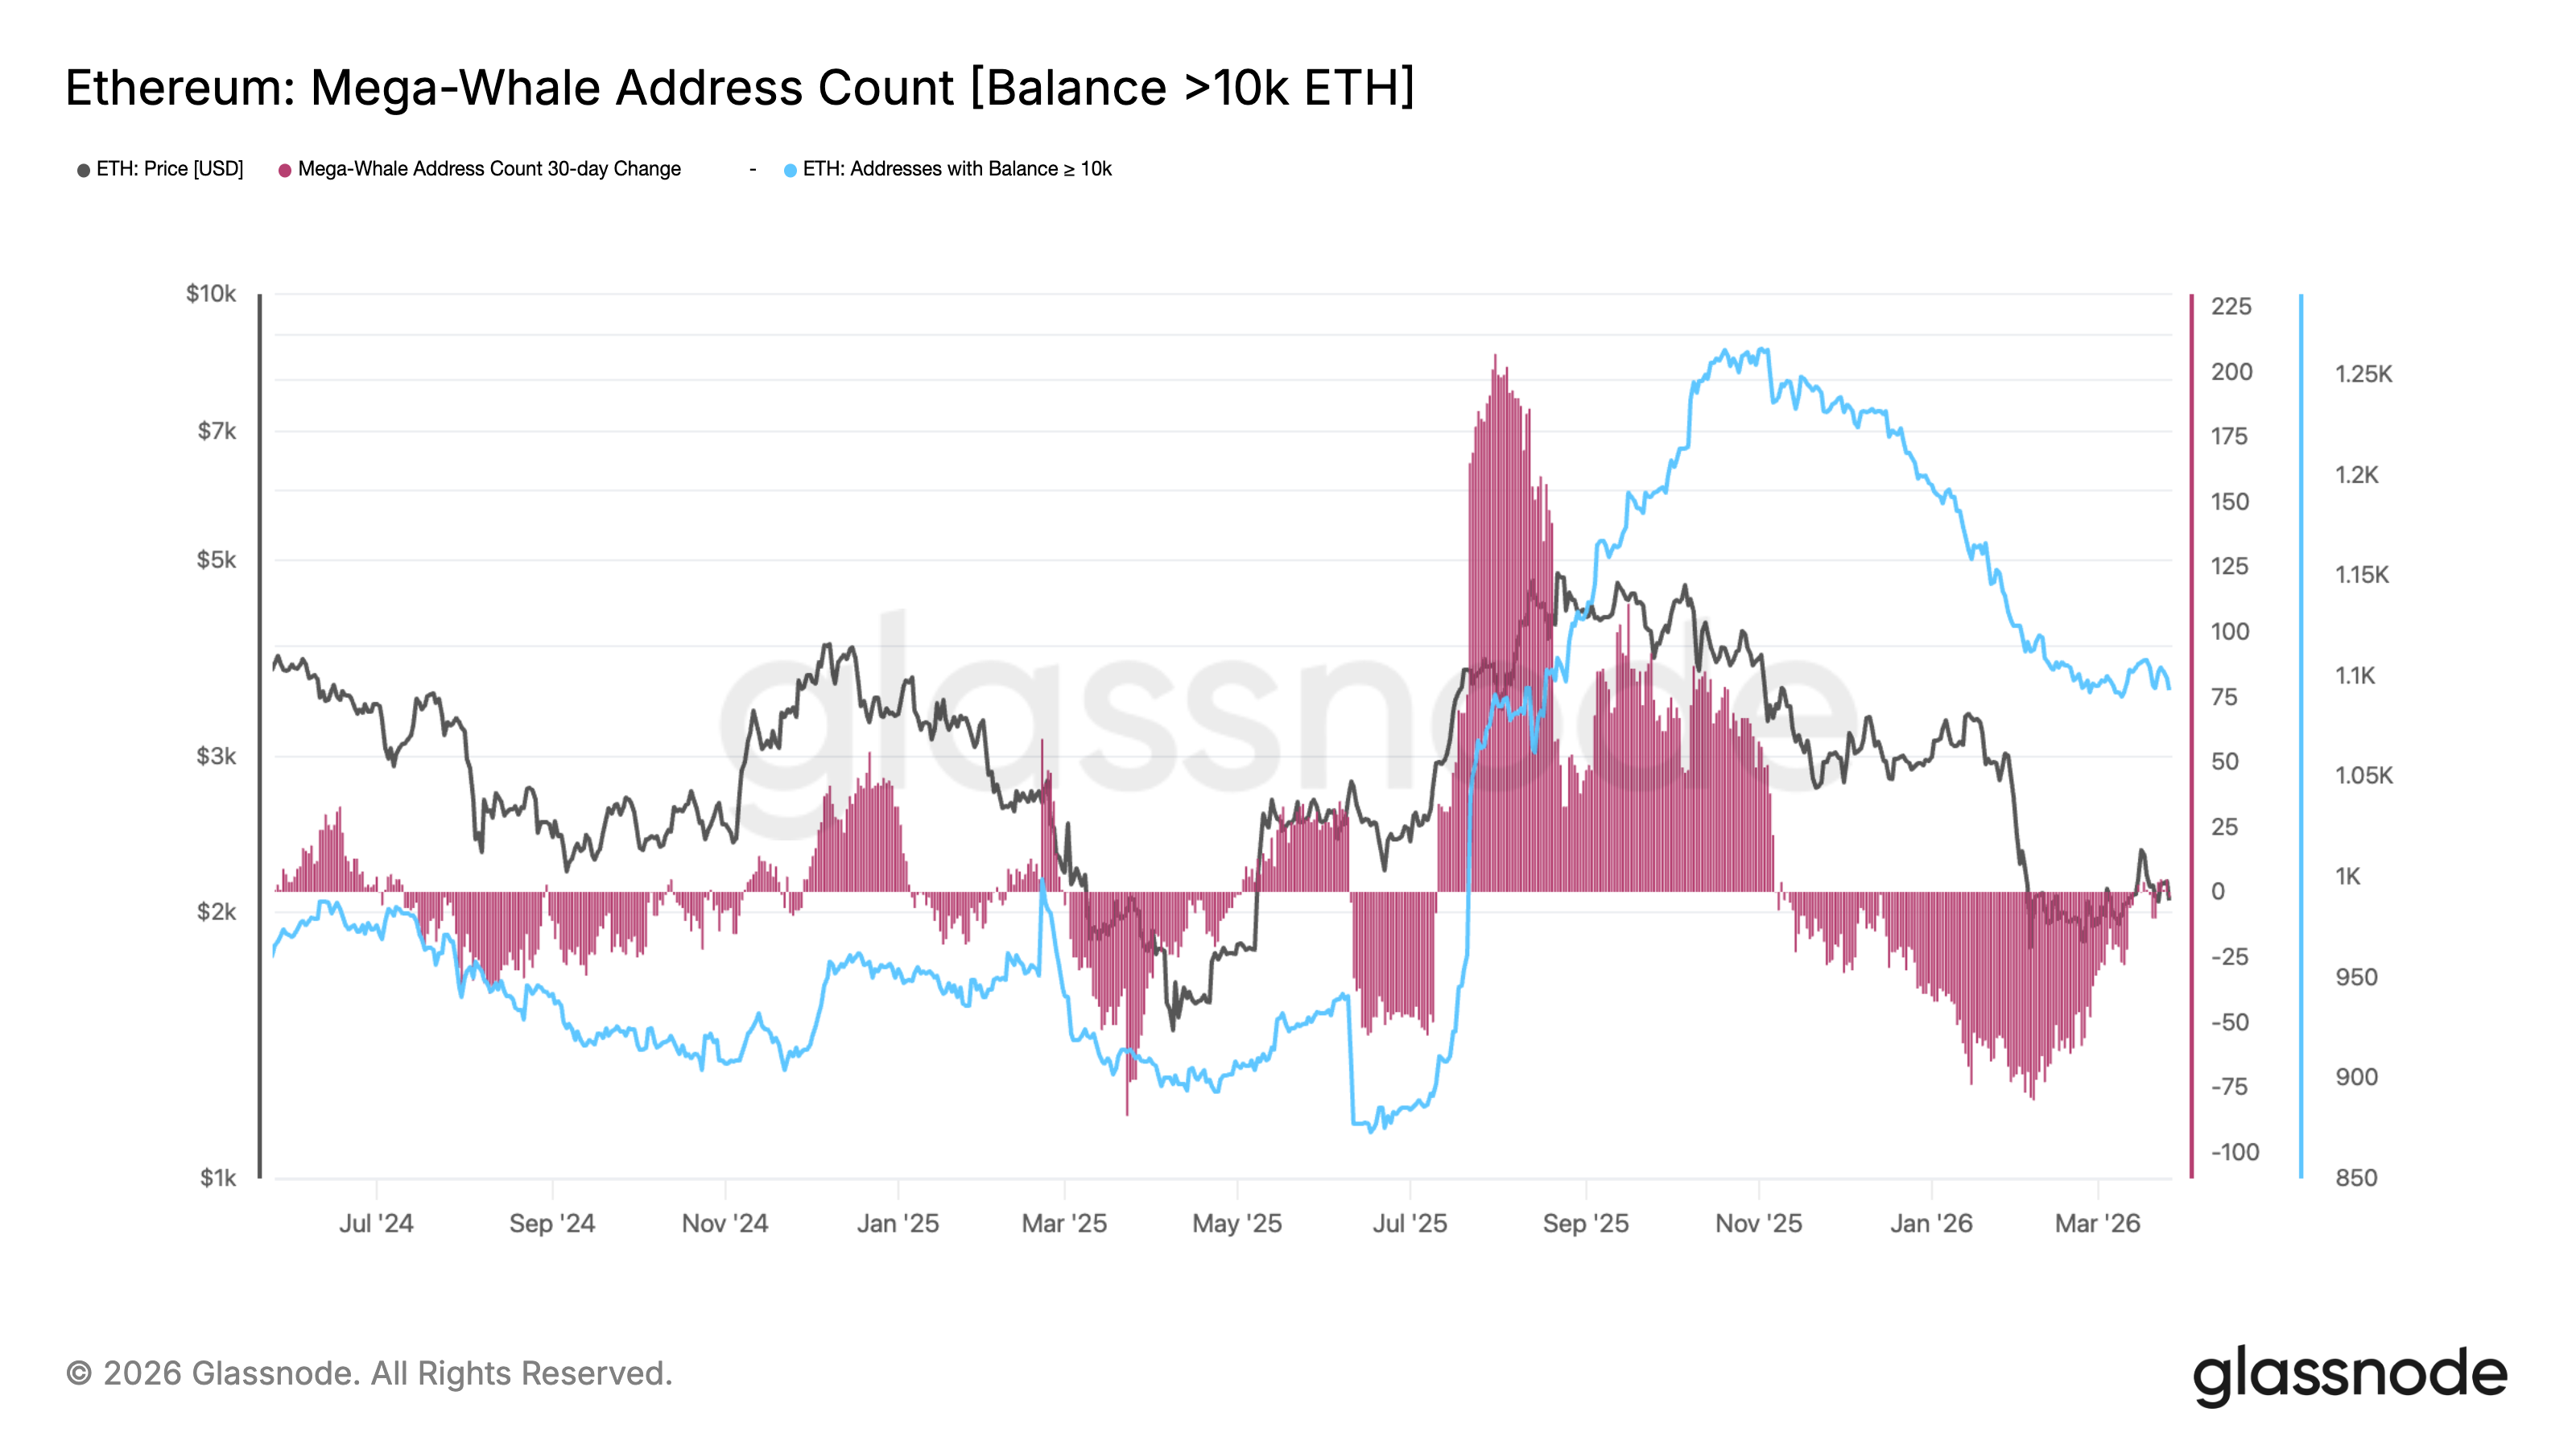 Balances of large investors (over 10,000 ETH) on Ethereum | Source: GlassnodeA similar pattern is also showing up in smaller cohorts. Whales holding from 1,000 ETH–10,000 ETH remain significantly below the prior peak, with the change momentum moving almost sideways or slightly negative. Meanwhile, the “sharks” (100 ETH–1,000 ETH) group continues to stay below last year’s peak, reflecting caution from average holders.
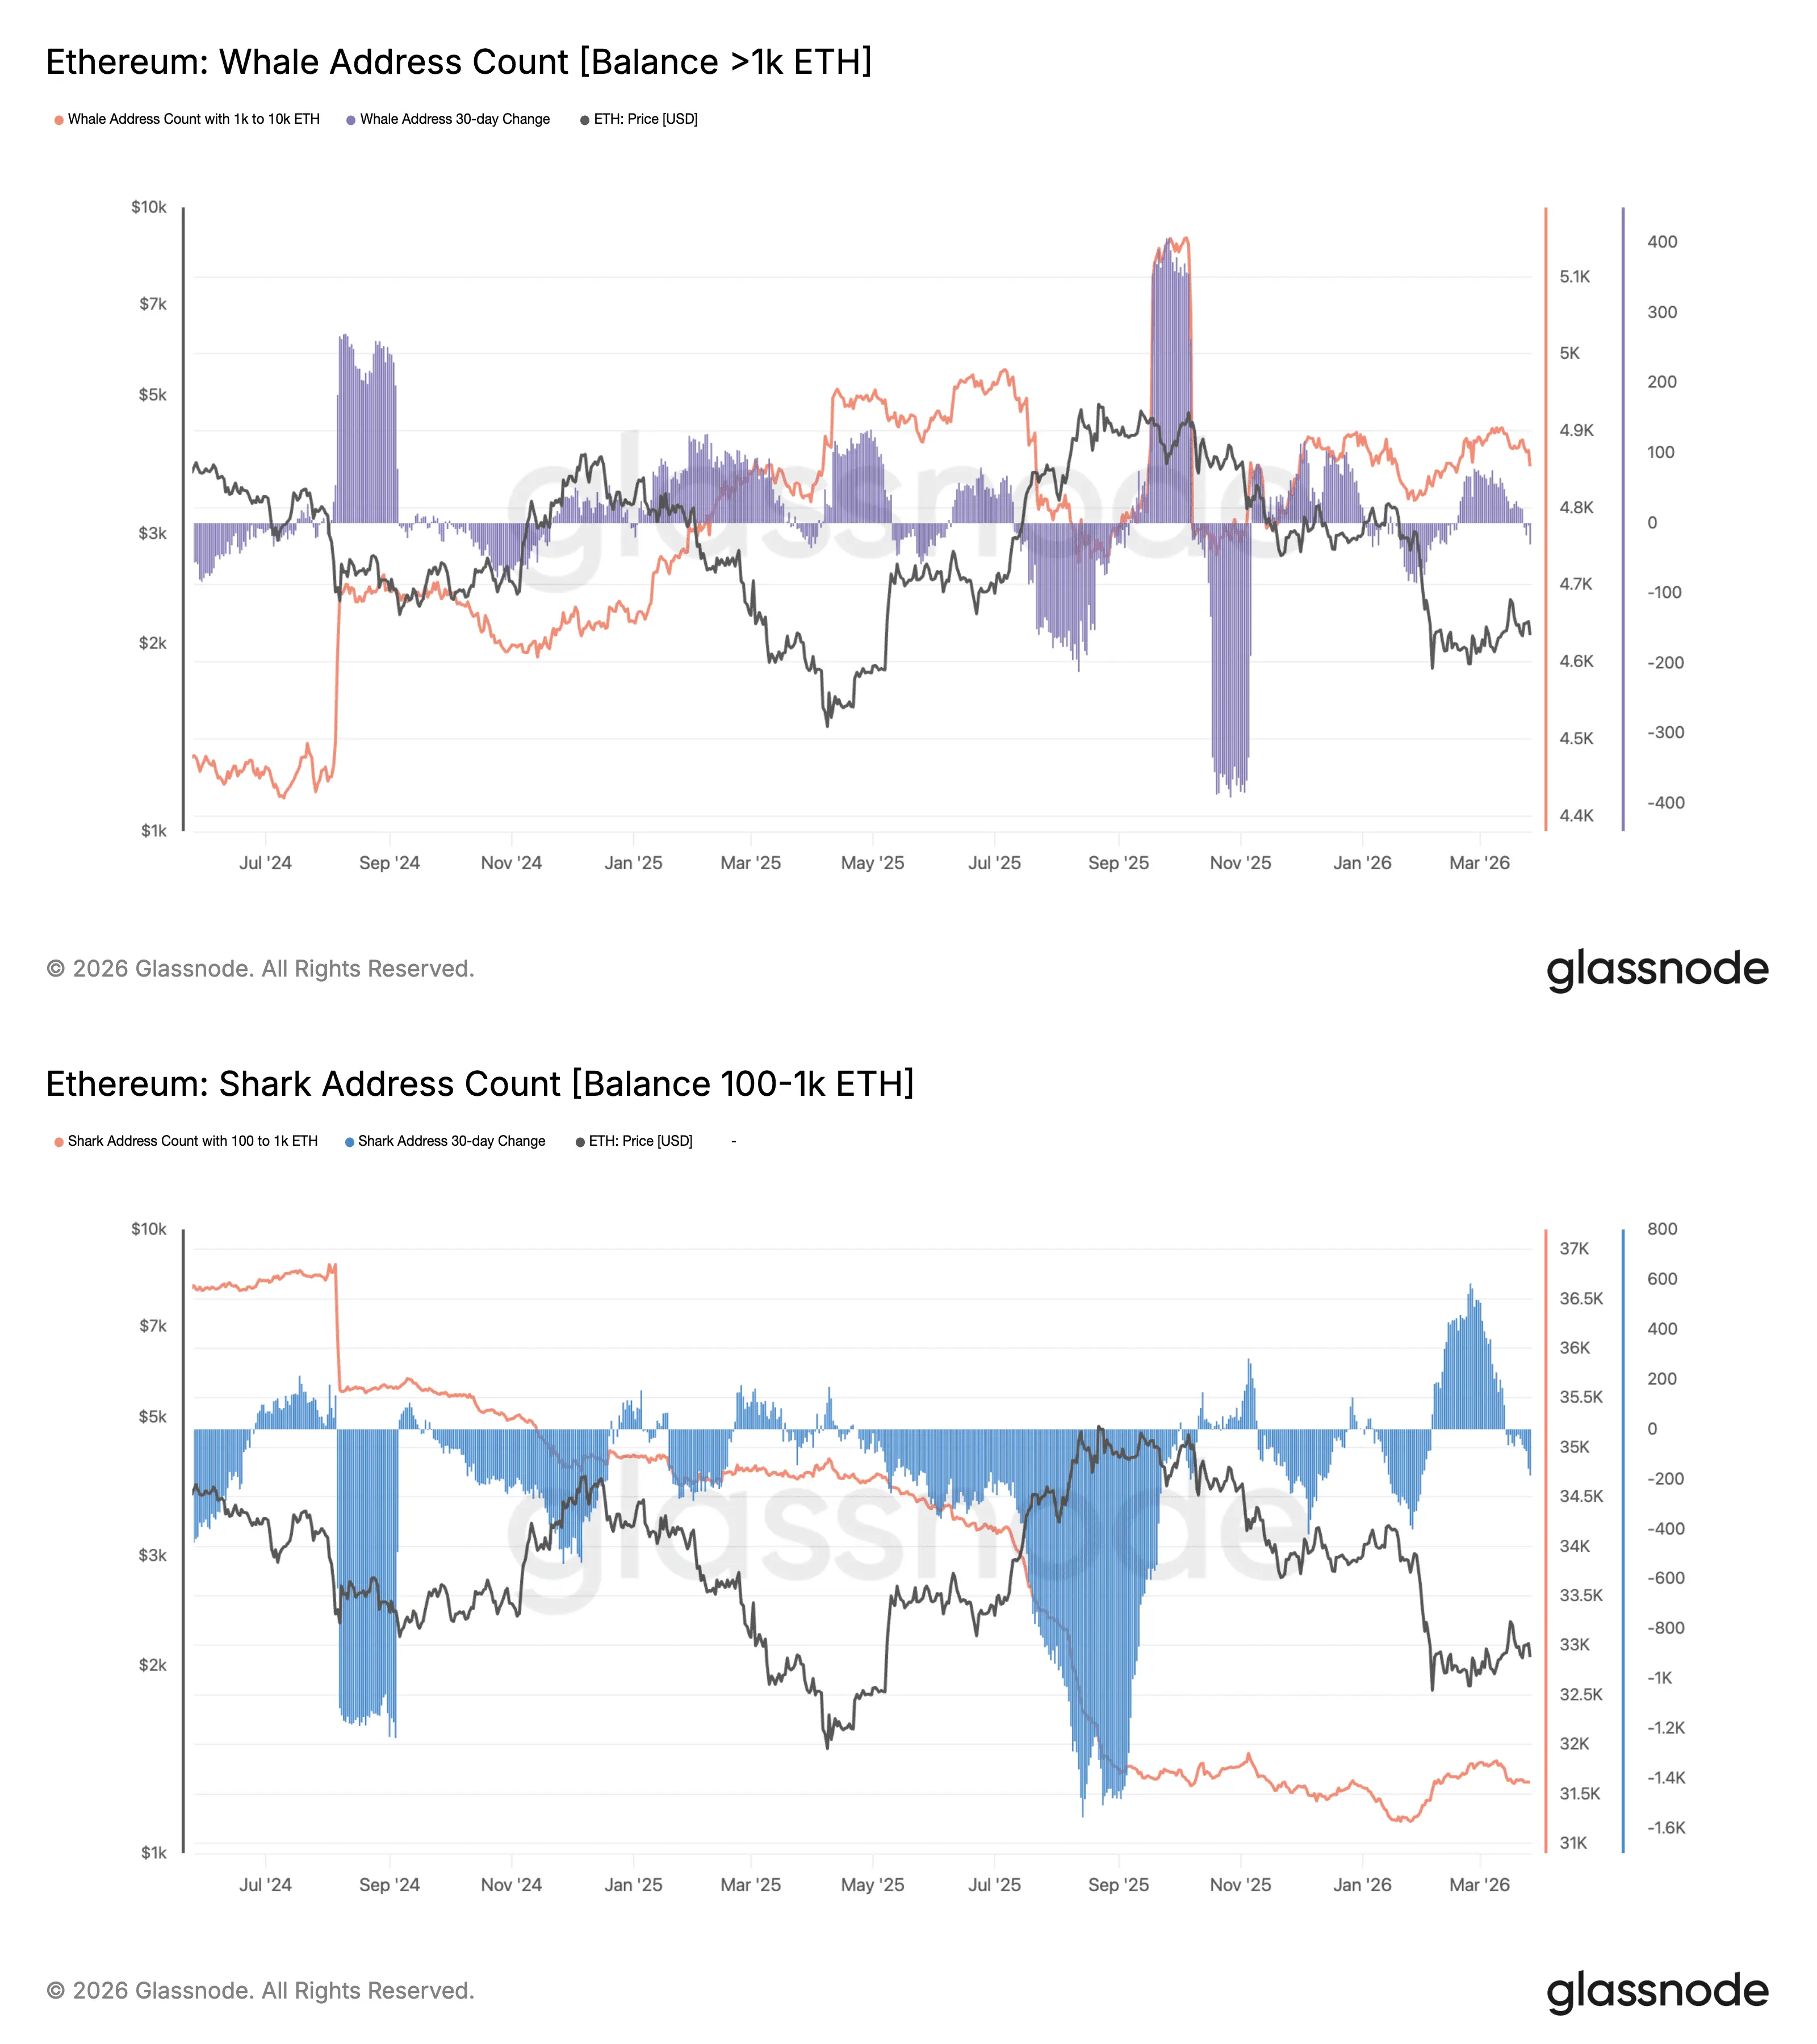 Number of addresses and balances of “whales” and “sharks” on Ethereum | Source: GlassnodeTaken together, the data shows that a distribution trend still dominates, alongside weaker market confidence among key holder groups. This reinforces the risk of an even deeper drop if the 1,990 USD support zone is broken.
According to Coinphoton, one of the few remaining positive signals is that the amount of ETH being staked continues to increase, while supply on exchanges has fallen to the lowest level in a decade.
Disclaimer: The information on this page may come from third parties and does not represent the views or opinions of Gate. The content displayed on this page is for reference only and does not constitute any financial, investment, or legal advice. Gate does not guarantee the accuracy or completeness of the information and shall not be liable for any losses arising from the use of this information. Virtual asset investments carry high risks and are subject to significant price volatility. You may lose all of your invested principal. Please fully understand the relevant risks and make prudent decisions based on your own financial situation and risk tolerance. For details, please refer to
Disclaimer.
