The CBOE Volatility Index closed at 31.05 on Friday, a 13.16% single-session gain that pushed Wall Street’s fear gauge to its highest close since late 2025. Meanwhile, gold held near $4,491 per ounce and silver recovered to $69.82, both propped up by geopolitical anxiety tied to the Middle East conflict.
VIX Jumps to Highest Close Since 2025
The VIX, derived from S&P 500 options pricing, measures expected volatility over the next 30 days. A reading above 30 signals that traders are pricing in meaningful near-term turbulence. Friday’s close of 31.05, up 3.61 points on the session, follows four consecutive weekly closes above 25, the longest such stretch since 2022.
Options markets are showing elevated open interest and skew, reflecting demand for downside hedges going into April. VIX futures remain in contango, meaning traders expect volatility to persist rather than fade. April 2026 contracts reflect that caution.
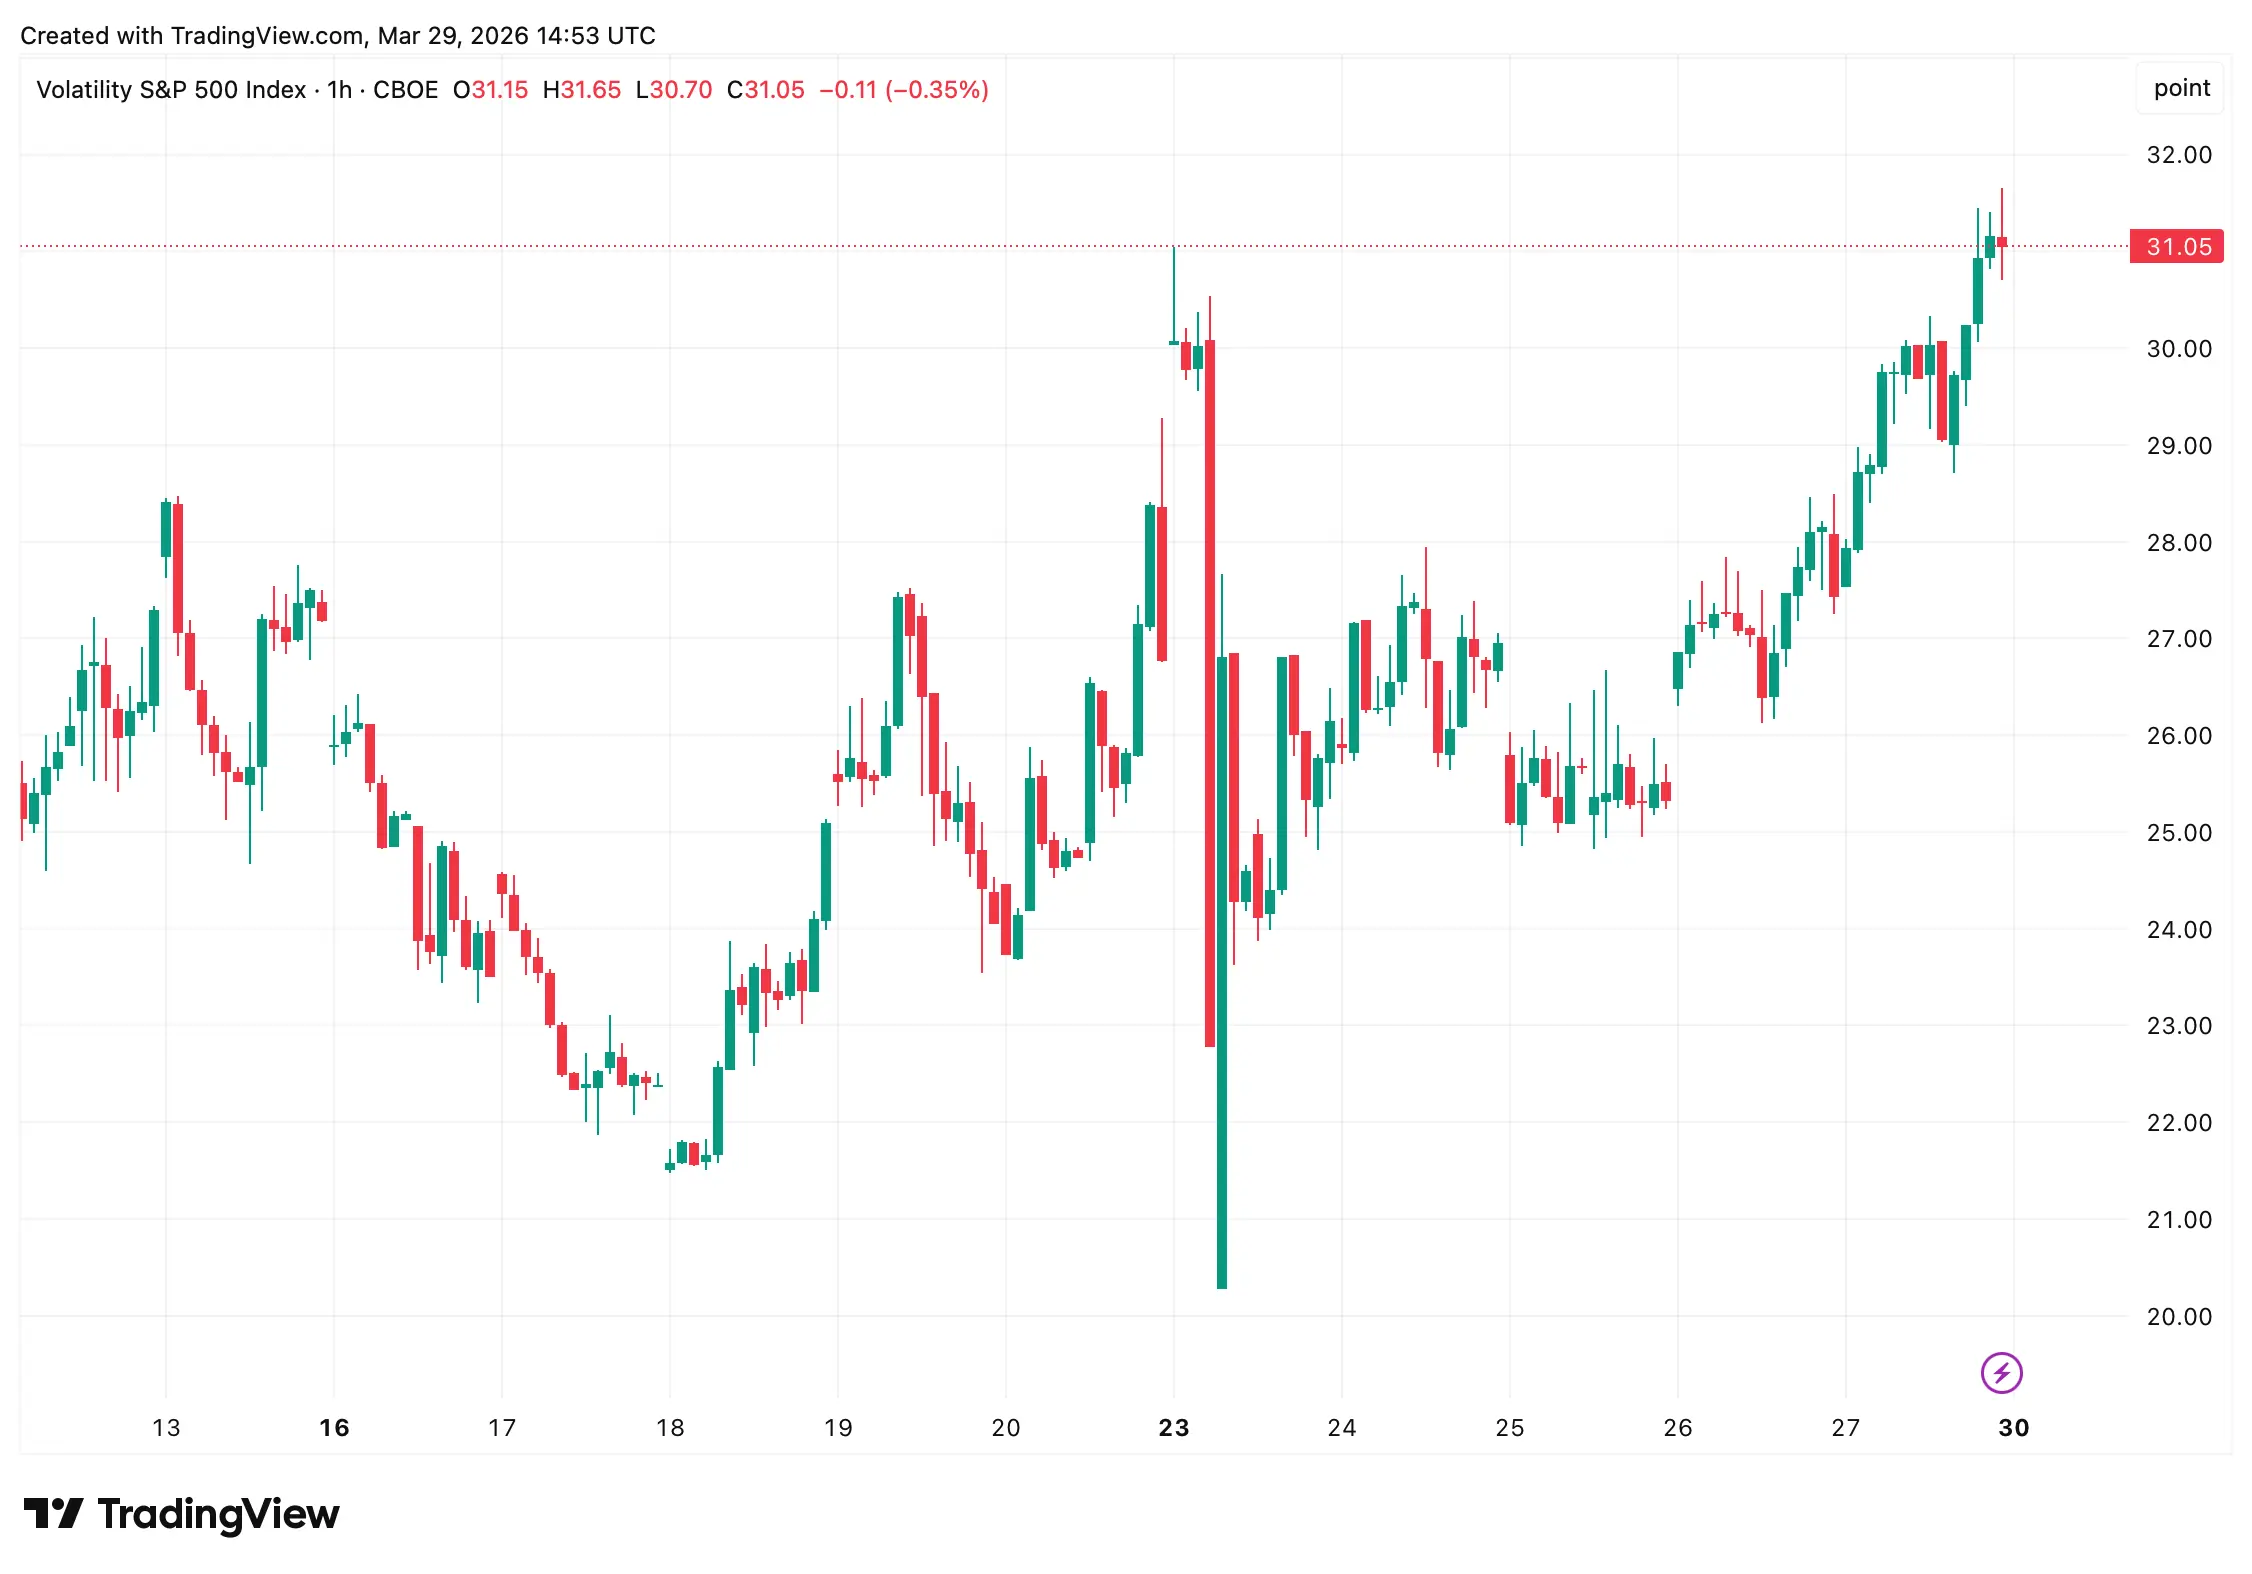 The CBOE Volatility Index via tradingview.com.
The primary driver behind the stress is the ongoing conflict in the Middle East. U.S. and Israeli military operations against Iran, which intensified in late February and early March 2026, have raised supply concerns around the Strait of Hormuz, the passage through which roughly 20% of global oil flows.
The CBOE Volatility Index via tradingview.com.
The primary driver behind the stress is the ongoing conflict in the Middle East. U.S. and Israeli military operations against Iran, which intensified in late February and early March 2026, have raised supply concerns around the Strait of Hormuz, the passage through which roughly 20% of global oil flows.
Brent crude and WTI have traded between $99 and $115 per barrel in recent sessions, down from earlier peaks above $120 but still quite elevated. Shipping patterns over the past several days reveal a marked lack of transit activity.
Higher energy costs are feeding into transportation, production, and consumer prices. U.S. inflation data has shown energy-driven upticks, complicating the Federal Reserve’s path forward. Fewer rate cuts are now priced in for 2026, and in a recent report, JPMorgan strategists maintain a base case of just one 0.25 percentage point cut before year’s end.
The Fed faces a clear problem. Oil-driven inflation may require rates to stay higher longer, which historically lifts yields and creates a mixed environment for gold; safe-haven demand pulls one way, higher opportunity costs pull the other. For now, safe-haven demand is winning.
Gold has traded between $4,400 and $4,600 in late March, holding near the $5,000 target Citigroup set in January 2026. In that forecast, Citigroup cited persistent safe-haven demand, supply constraints, and geopolitical risk as the catalysts. The gold target has not yet been hit, but the conditions supporting it remain in place.
Silver has lagged. After hitting records near $90 to $100 per ounce earlier in the year, silver has pulled back to approximately $69.82. Industrial demand sensitivity and profit-taking have weighed on prices. The Citigroup forecast of $100 silver by the end of Q1 did not materialize, though the metal has stabilized in the current risk-off environment.
JPMorgan describes its current outlook as “wait-and-see” and “higher-for-longer.” Inflation has moderated to 2.4%, above the Fed’s 2% target, while the labor market remains in a low-hire, low-fire pattern. The incoming Fed Chair, Kevin Warsh, takes over in May, and his communication style and policy signals will shape how bond markets respond to elevated oil prices.
Fixed-income investors are already adjusting. A flatter yield curve and rising breakeven inflation rates suggest the bond market is pricing a longer period of higher rates, even as the Fed tries to hold a gradual easing posture. Strategic petroleum reserve releases have offered some near-term relief on oil prices, but have not resolved the underlying supply concerns.
Equity markets have absorbed multiple rounds of selling in March 2026. The flight-to-quality pattern, money moving into Treasuries, gold, and cash equivalents, mirrors prior risk-off periods, including the tariff volatility of 2025. VIX intraday highs near 28 to 35 earlier in March preceded Friday’s close, indicating the spike built over time rather than appearing in isolation.
Historically, VIX spikes above 30 are short-lived when the triggering event resolves quickly. If U.S.-Iran diplomatic talks advance or Hormuz traffic normalizes, volatility could contract sharply. If disruption continues into Q2, growth forecasts for 2026 face downward revision, and higher-for-longer rates become the base case rather than a tail risk.
Investors are watching oil flow data, Federal Reserve communications, and any developments around Hormuz reopening timelines. Precious metals and volatility hedges remain in demand as long as those questions stay open.
FAQ 🔎
- What does a VIX reading above 30 mean? A VIX above 30 signals that options traders are pricing significant expected volatility in the S&P 500 over the next 30 days.
- Why is gold near $4,500 in March 2026? Gold is holding near $4,491 per ounce due to safe-haven demand driven by Middle East conflict, oil price stress, and inflation concerns.
- Will the Federal Reserve cut rates in 2026? JPMorgan currently projects one 0.25 percentage point rate cut before year-end, though oil-driven inflation could delay that move.
- How does the Strait of Hormuz affect U.S. inflation? Roughly 20% of global oil supply passes through the Strait of Hormuz, so disruptions there push energy prices higher and feed into U.S. consumer prices.
Disclaimer: The information on this page may come from third parties and does not represent the views or opinions of Gate. The content displayed on this page is for reference only and does not constitute any financial, investment, or legal advice. Gate does not guarantee the accuracy or completeness of the information and shall not be liable for any losses arising from the use of this information. Virtual asset investments carry high risks and are subject to significant price volatility. You may lose all of your invested principal. Please fully understand the relevant risks and make prudent decisions based on your own financial situation and risk tolerance. For details, please refer to
Disclaimer.
