- XRP trades near $1.32, holding key support between $1.20 and $1.30 as price remains below $1.50 resistance.
- RSI at 38 signals weak momentum while MACD stays negative, reflecting continued bearish pressure in the trend.
- XRP maintains lower highs after peaking near $3.50, confirming ongoing downtrend despite short-term consolidation.
XRP has entered a key decision zone. $1.80 is the level defining the next move. The asset is trading near this critical range, and market participants are watching closely.
Price action shows a tightening structure, and this often precedes a directional move. Current levels may determine whether XRP stabilizes or extends its decline.
Market Structure Near Key Support
XRP is trading near the $1.20 to $1.30 range, which has acted as support in recent sessions.
Price has tested this zone several times, and buyers have stepped in during each test. However, the strength of each rebound appears limited.
The broader trend remains downward, as the chart continues to show lower highs and lower lows. This pattern started after the peak near $3.50. Since then, price rallies have struggled to maintain momentum above resistance levels.
Short-term price action reflects consolidation within a narrow band. This behavior often appears before a larger move. Traders are watching for either a breakdown below support or a recovery toward higher levels.
Resistance Levels and Reclaim Zones
The $1.50 level is acting as immediate resistance, and it was a previous support before the decline.
Price has attempted to move above this level, but each attempt has faced selling pressure. This keeps the short-term outlook cautious.
The $1.80 level is seen as a key threshold for a structure shift. Market participants note that “a weekly close above $1.80 would signal a structure reclaim.”
This level is aligned with a key indicator line and prior price reactions.
#XRP – This Is Where It Decides ⚖️:
We’re sitting at a very sensitive level… this is where the market chooses direction.
🔼If this zone holds, we grind higher.
🔽If it breaks, we likely revisit deeper support around $1.15.
🟡Historical behavior matters:
In the previous cycle,… pic.twitter.com/6DAyXHpOnQ
— EGRAG CRYPTO (@egragcrypto) March 27, 2026
Above that, the $2.20 level is considered a confirmation zone. A sustained move above this range could support further upside movement. If price reaches this level, attention may turn toward higher resistance near $2.50.
Indicator Signals and Momentum Trends
Momentum indicators are showing weak conditions, and they reflect the current price behavior.
The Relative Strength Index is near 38, which places it below the neutral level of 50. This suggests that bearish pressure remains present.
The MACD indicator is slightly negative, and it shows limited momentum strength. The lines are close together, which indicates a lack of strong directional movement. This aligns with the current consolidation phase.
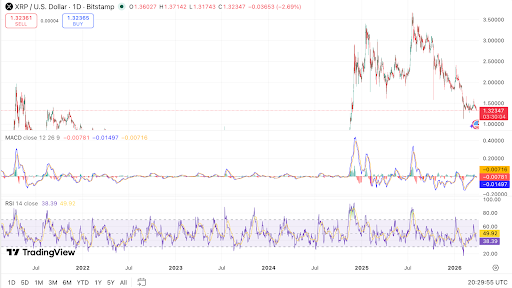
XRP tests key level as momentum weakens, source: TradingView
Historical indicator behavior is also being monitored. Traders refer to a recurring signal where “the yellow line crosses above the red line.” This signal has appeared near major turning points in past cycles.
Cycle Patterns and Market Timing
Data from previous cycles shows a pattern linked to indicator crossovers.
In 2018, the bottom formed months after the signal appeared. In 2022, the bottom formed weeks before the same type of crossover.
This variation suggests that the signal defines a broader timing zone rather than an exact point. Current conditions appear to reflect a similar setup.
XRP is trading within a range where a transition may occur.
If the price breaks below $1.20, attention may shift to the $1.00 to $1.15 range. This zone has acted as support in earlier periods. If support holds, the market may attempt a gradual move higher toward resistance.
Disclaimer: The information on this page may come from third parties and does not represent the views or opinions of Gate. The content displayed on this page is for reference only and does not constitute any financial, investment, or legal advice. Gate does not guarantee the accuracy or completeness of the information and shall not be liable for any losses arising from the use of this information. Virtual asset investments carry high risks and are subject to significant price volatility. You may lose all of your invested principal. Please fully understand the relevant risks and make prudent decisions based on your own financial situation and risk tolerance. For details, please refer to
Disclaimer.
