Hyperliquid (HYPE) is currently trading around $39, down 2.79% on the day after failing to maintain upward momentum above the $42 mark. On the 2-day timeframe, the price structure has formed a double top pattern, while the money flow data has begun to shift to negative for the first time since early March.
The $42 level is where the largest short liquidation zone in the past 30 days is concentrated, serving as a thicker layer of resistance rather than a catalyst for upward movement. This reduces the probability of a breakout above this price range.
Increasing Short Liquidation Pressure
The liquidation map shows a total short leverage of approximately $13.24 million concentrated at the $42 mark. To trigger a true short squeeze, buyers need to absorb the entire amount of short positions.
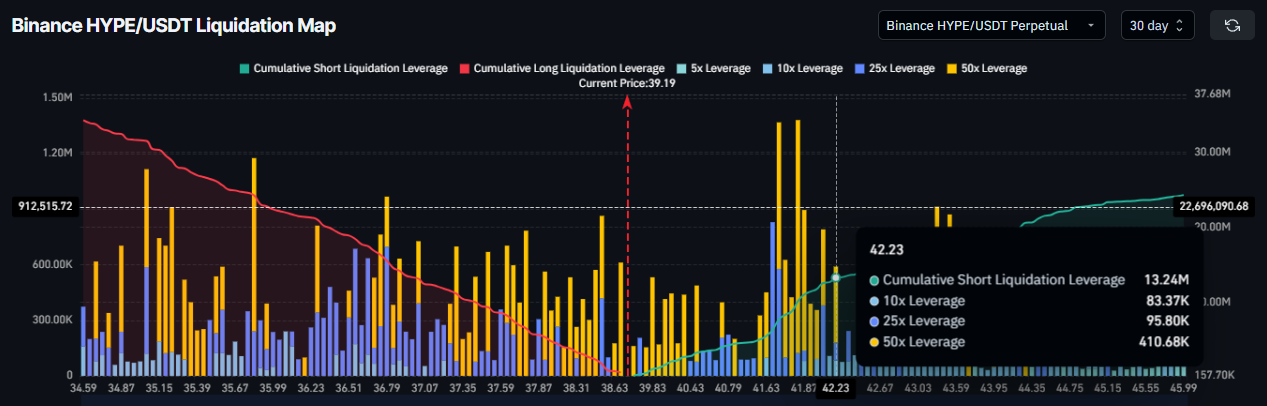 HYPE Liquidation Map | Source: Coinglass However, with the CMF indicator at 0 and continuing to weaken, current buying strength is insufficient to achieve this, turning the $42 zone into a significant “price ceiling.”
Money Flow Shifting to Negative
The CMF indicator peaked near 0.20 during the period from March 15 to March 19 when the price approached $42, but has since been on a continuous decline, reaching 0.00 on March 26. A CMF reading of 0 reflects a balance between buying and selling pressure in terms of capital value. If it continues to drop below this level, net money flow will turn negative — a sign that outflows are dominating.
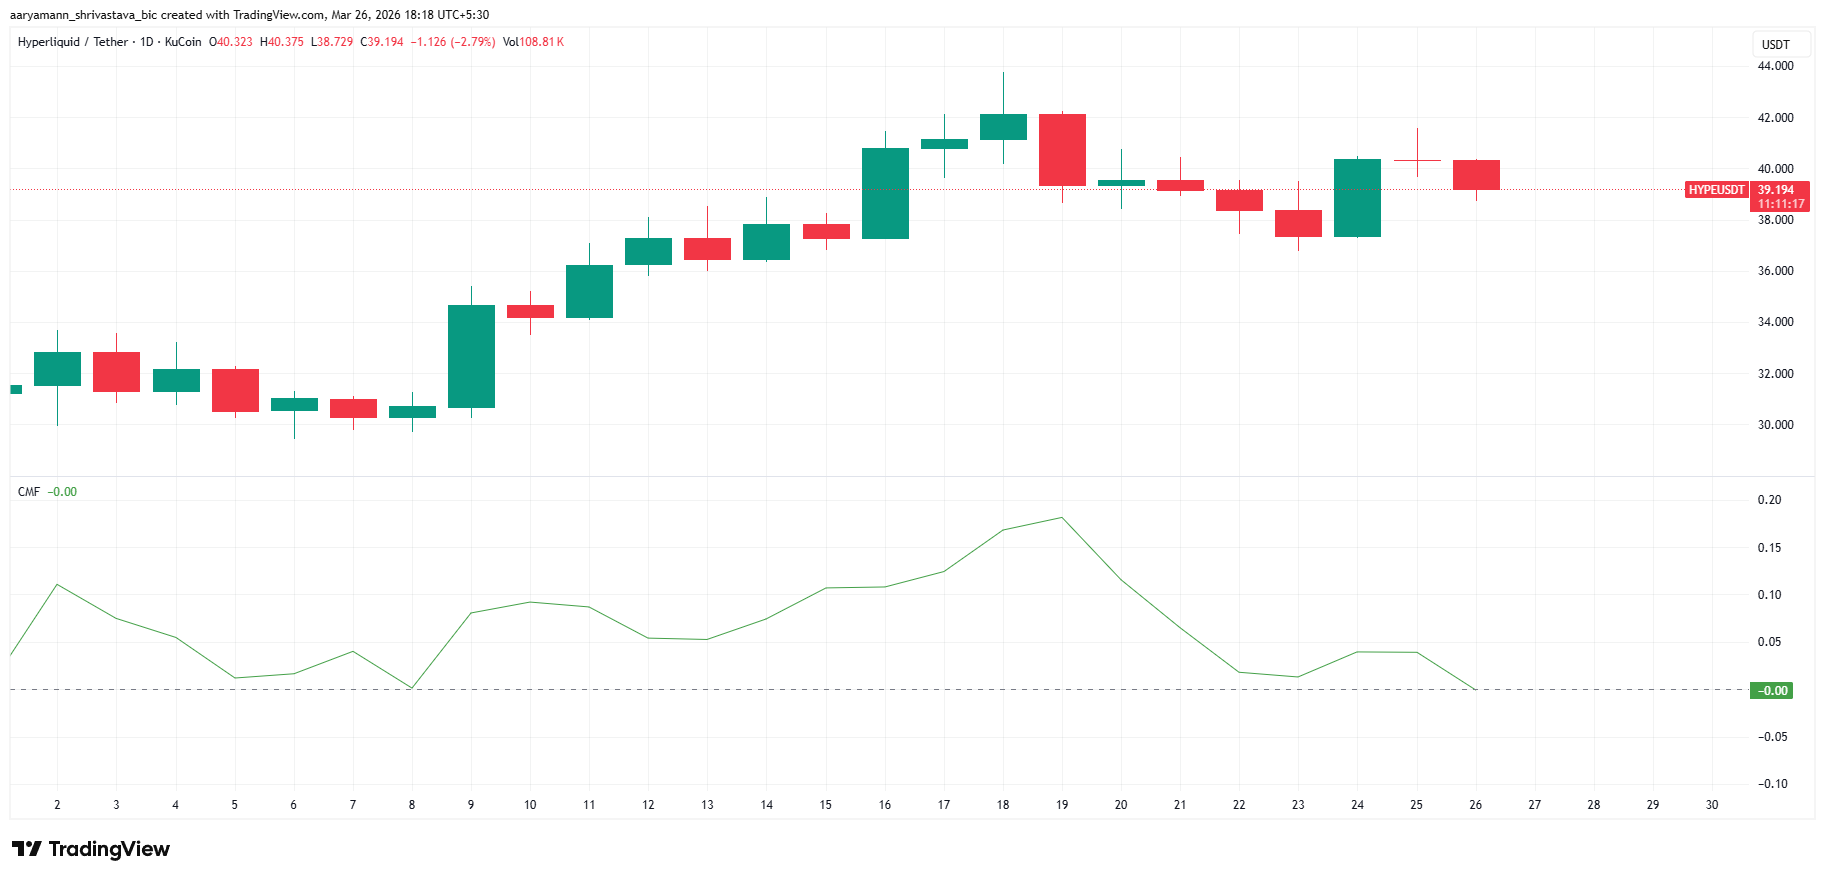 HYPE CMF Indicator | Source: TradingView Notably, the shift from positive to negative CMF is often a crucial turning point, with history showing that it tends to lead to prolonged downtrends rather than accumulation phases. The upward momentum that supported HYPE’s rise to $42 in early March has now completely weakened.
Price Forecast: Downside Risk to $21
The double top structure is becoming increasingly clear, with the first peak forming around $38 (early February) and the second peak near $43 (mid-March). According to the measured move method, the expected decline is approximately 37.49% from the current breakout level, corresponding to a price target around $21.
Currently, HYPE needs to close a 2-day candle below $35 to confirm the completion of the pattern and trigger a deeper decline scenario. Intermediate support levels are at $32, $28, $26, and $23, before heading towards the final target of $21.
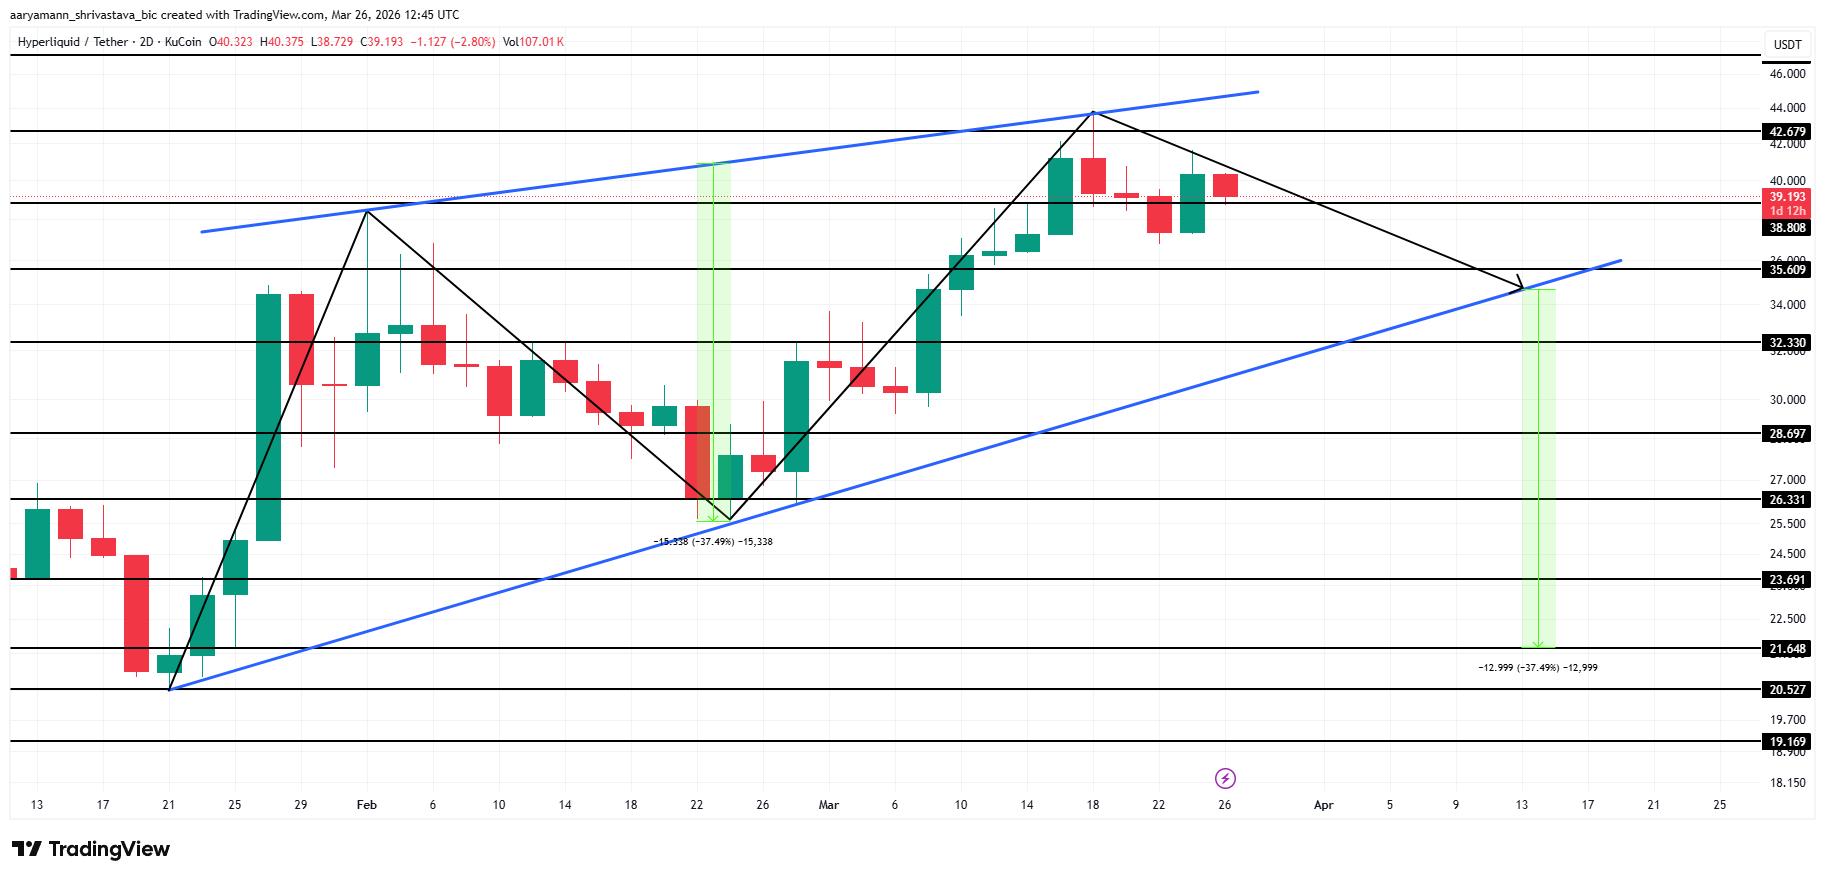 HYPE Price Analysis | Source: TradingView Conversely, the bullish scenario will only be restored if the daily closing price exceeds $42 — the key resistance zone and the peak of the short liquidation cluster. In that case, the double top pattern will be invalidated, triggering a short squeeze of $13.24 million and opening the potential for an increase to $44 or higher.
Disclaimer: The information on this page may come from third parties and does not represent the views or opinions of Gate. The content displayed on this page is for reference only and does not constitute any financial, investment, or legal advice. Gate does not guarantee the accuracy or completeness of the information and shall not be liable for any losses arising from the use of this information. Virtual asset investments carry high risks and are subject to significant price volatility. You may lose all of your invested principal. Please fully understand the relevant risks and make prudent decisions based on your own financial situation and risk tolerance. For details, please refer to
Disclaimer.
