Polkadot (DOT) prices continue to decline, falling below the $1.40 mark as of Wednesday, after a slight weakening in the previous session. This downward trend is reinforced by weakening derivative indicators and increasingly negative technical signals, indicating a rising risk of deeper short-term correction for DOT.
Weakening Derivative Indicators
Funding rate data from CoinGlass shows bearish sentiment dominating Polkadot. The rate turned negative on Saturday and continued to plunge to -0.019% on Wednesday, indicating that short sellers are willing to pay fees to maintain their positions — a sign that short-term price weakness is expected to persist.
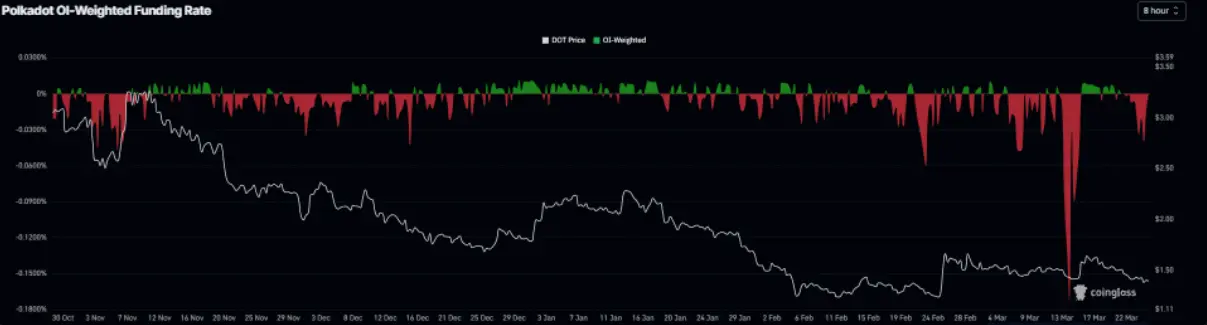 Polkadot Funding Rate Chart | Source: Coinglass
Additionally, the long/short ratio for DOT on CoinGlass is currently only 0.82, further supporting the downtrend as most traders lean toward a continued decline in price.
Polkadot Funding Rate Chart | Source: Coinglass
Additionally, the long/short ratio for DOT on CoinGlass is currently only 0.82, further supporting the downtrend as most traders lean toward a continued decline in price.
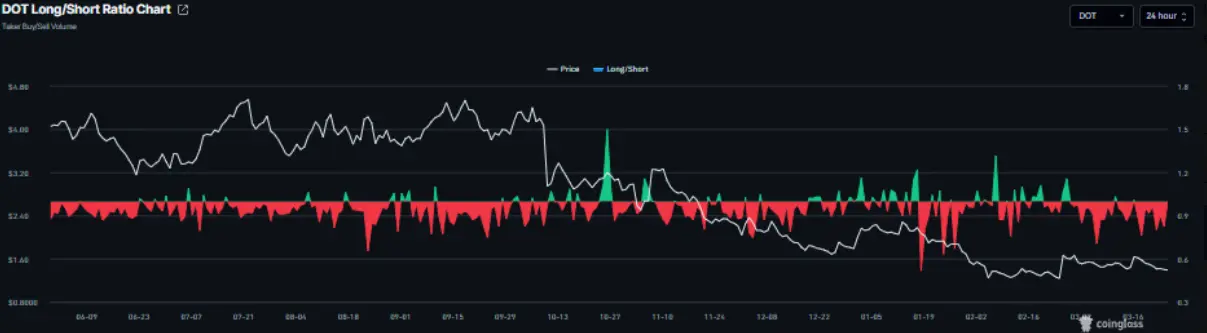 DOT Long/Short Ratio Chart | Source: Coinglass
Other Negative Signals
Santiment’s Social Dominance index continues to reinforce the negative outlook. This metric measures the proportion of discussions about DOT across crypto media channels, and since mid-March, it has been steadily declining, now at just 0.044%. This trend indicates waning investor interest and sentiment.
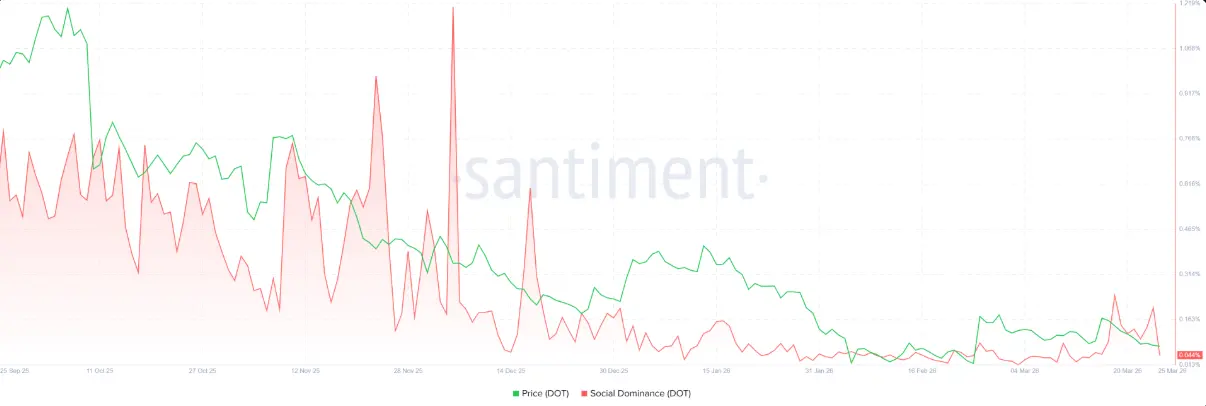 DOT Social Dominance Chart | Source: Santiment
From an institutional perspective, demand remains weak. The first spot ETF for Polkadot launched by 21Shares has not seen additional inflows after an initial investment of $544,490 on March 12, reflecting cautious and disinterested behavior from institutional investors.
DOT Social Dominance Chart | Source: Santiment
From an institutional perspective, demand remains weak. The first spot ETF for Polkadot launched by 21Shares has not seen additional inflows after an initial investment of $544,490 on March 12, reflecting cautious and disinterested behavior from institutional investors.
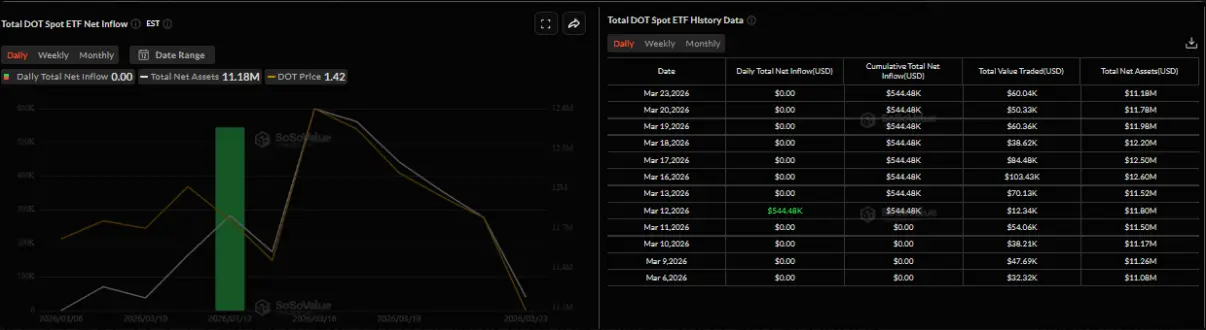 Total Net Capital Inflows into DOT Spot ETF | Source: SoSoValue
Polkadot Price Forecast: Risk of Further Deep Correction
DOT’s price continued to weaken, dropping below $1.40 on Wednesday, indicating a short-term bearish trend. Selling pressure persists as the price remains below the 50-day and 100-day EMAs (around $1.53 and $1.75 respectively), both of which are trending downward and acting as dynamic resistance zones.
Market momentum has not improved. The daily RSI stands at 42, below the neutral 50 level, reflecting dominance by sellers. Meanwhile, the MACD has turned negative, with the MACD line below the signal line and the histogram remaining in negative territory, confirming that the upward momentum has weakened after rejection near the closest resistance zone.
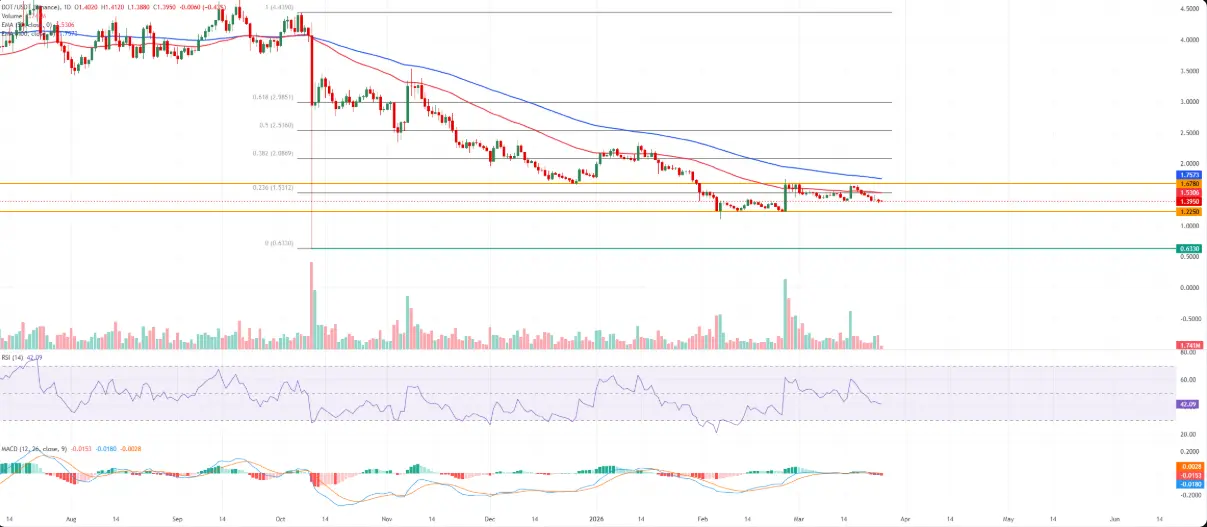 Daily DOT/USDT Chart | Source: TradingView
On technical levels, the nearest resistance is at $1.53 (50-day EMA), coinciding with the 23.6% Fibonacci retracement of the decline from $4.43 to $0.63, just below the horizontal resistance at $1.67. If the price closes above $1.53, a recovery toward $1.67 — an area with significant supply — is likely.
Conversely, the nearest support is at $1.22. Breaking this level could push the price back toward $1.00 (a key psychological level), before testing deeper support around the Fibonacci-based low of $0.63. Currently, as DOT remains below $1.53, any rebound is likely to face strong selling pressure at resistance levels.
Disclaimer: The information on this page may come from third parties and does not represent the views or opinions of Gate. The content displayed on this page is for reference only and does not constitute any financial, investment, or legal advice. Gate does not guarantee the accuracy or completeness of the information and shall not be liable for any losses arising from the use of this information. Virtual asset investments carry high risks and are subject to significant price volatility. You may lose all of your invested principal. Please fully understand the relevant risks and make prudent decisions based on your own financial situation and risk tolerance. For details, please refer to
Disclaimer.
