
The Gold (XAU) price just had one of its roughest weeks in decades, and the selloff has caught a lot of traders off guard. According to market commentary, you’d have to go all the way back to 1982 to find a worse weekly drop.
But interestingly, that same period also tells a different story. The last time the gold price saw a decline this sharp, it went on to rally nearly 50% within the following year. That’s why some traders are starting to see this drop not as the end, but as a potential setup.
- What the Gold Chart Is Showing Right Now
- Gold Price Short-Term Outlook: More Downside First?
- Why Are Some Traders Still Bullish?
- Could a 50% Rebound Actually Happen?
What the Gold Chart Is Showing Right Now
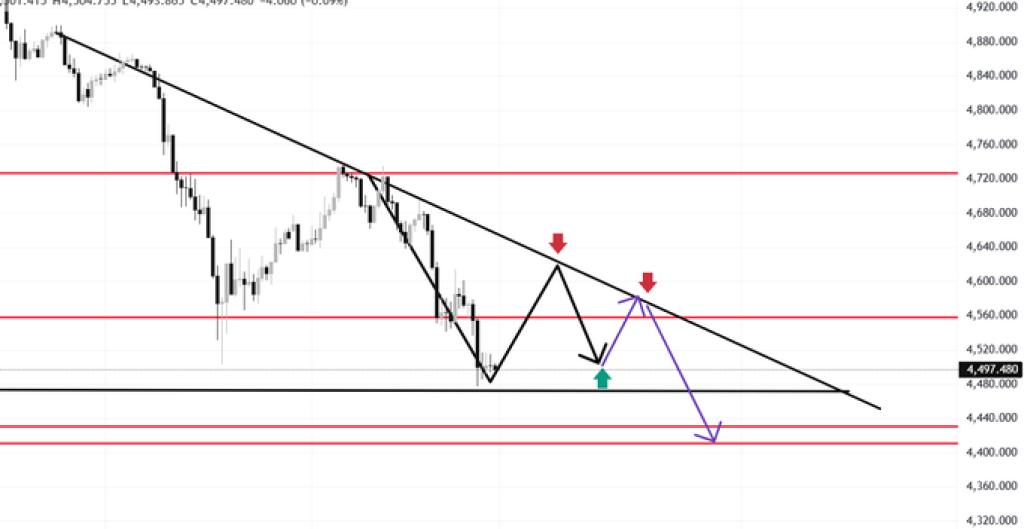
On the short-term chart, we can see that gold is in a downtrend. It is respecting the descending trendline.
The gold price is trading around the support area of 4,440 to 4,480. This is the same support area as the previous base.
We can also notice a pattern here. The price bounced from the support, went up to the resistance around the trendline, then was rejected again. That rejection suggests sellers are still in control for now.
If the gold price heads back up toward the 4,550–4,570 zone, expect some pushback. That area isn’t just a number, it’s where the trendline meets a past support that flipped to resistance. Chances are, sellers are waiting there to make their move.
Source: X/Shirley
Gold Price Short-Term Outlook: More Downside First?
As things stand, the short-term bias is still slightly bearish. However, if the Gold price is unable to hold above the 4,460-4,450 range, then the price can continue to fall towards 4,420 and potentially even revisit the 4,400 mark.
On the flip side, if the price does manage to rise towards the 4,550-4,570 range without a good breakout, then the price can simply be making a lower high, which usually leads to another fall.
In essence, the gold price appears to be having some further downside potential before it stabilizes at a certain value.
Why Are Some Traders Still Bullish?
While the short-term chart looks weak, the bigger picture tells a more balanced story.
The long-term chart shows that the gold price came off a major rally before this pullback. Even after the drop, price is still holding above key higher-timeframe support zones.
However, macro factors haven’t really changed. Rising government debt, ongoing currency devaluation concerns, and strong demand for precious metals, especially silver, are still in play.
There’s also growing talk about supply pressure in silver markets, with industrial demand outpacing supply. Historically, that kind of imbalance tends to support higher prices across the precious metals space over time.
_****Crypto Expert Gives 3 Reasons Cardano (ADA) Price Could Rally Soon**
Could a 50% Rebound Actually Happen?
Yes, it is definitely possible, but as the old saying goes, “timing is everything.”The gold price is still in a short-term downtrend, and the chart is suggesting that there is possibly further downside or consolidation to come before any big upwards move is made.
However, if history is set to repeat itself even half as well as the last few years, then this kind of sell-off may turn out to be a buying opportunity in the long term.
What to look out for is how the gold price reacts to the $4,400 mark. If the price can hold around here and create a good base, then possibly the long-awaited recovery is about to begin.
As things stand, the market is looking quite weak in the short term but still has tremendous potential in the long term.
Disclaimer: The information on this page may come from third parties and does not represent the views or opinions of Gate. The content displayed on this page is for reference only and does not constitute any financial, investment, or legal advice. Gate does not guarantee the accuracy or completeness of the information and shall not be liable for any losses arising from the use of this information. Virtual asset investments carry high risks and are subject to significant price volatility. You may lose all of your invested principal. Please fully understand the relevant risks and make prudent decisions based on your own financial situation and risk tolerance. For details, please refer to
Disclaimer.
