Author: Coingecko
Compiled by: Felix, PANews
After experiencing turbulence at the end of 2025, Bitcoin continued to fluctuate downward in early 2026. Meanwhile, geopolitical and macroeconomic events drove up the prices of gold, silver, and recently, oil. As cryptocurrencies as an asset class continue to gain mainstream acceptance, many Wall Street investors may be experiencing their first crypto bear market. Coingecko examines the performance of cryptocurrencies relative to other traditional asset classes at the start of 2026.
With the outbreak of the Iran war, oil prices in 2026 surged faster than all other asset classes.
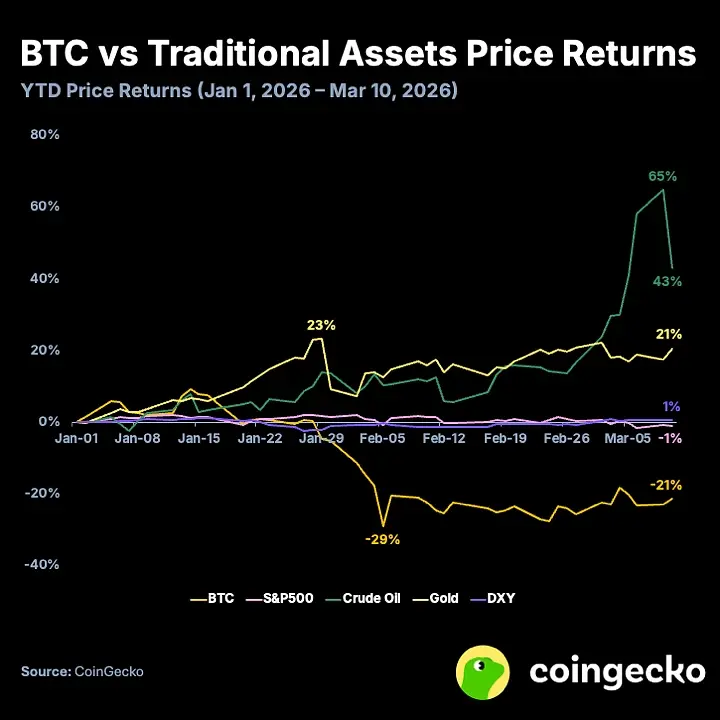
Since early 2026, oil prices have been gradually rising due to escalating tensions in the Middle East and critical market supply shortages. However, the situation peaked after the US and Israel launched their latest attack on Iran on February 28. Oil prices hit a high of $119.48 during intraday trading, up from just $57.41 at the start of the year.
Meanwhile, Bitcoin’s price continued to decline in 2026, making it the worst-performing asset so far. However, since early March, Bitcoin seems to have found support between $65,000 and $75,000, after dropping to a low of $62,800 in early February. The US spot Bitcoin ETF has seen strong capital inflows since late February (net inflow of $1.9 billion since February 20, but a net outflow of $829 million year-to-date), while Strategy continues its consistent buying pace, having invested $5.6 billion since the beginning of the year.
Since the start of 2026, cryptocurrencies have shown only moderate correlation with the S&P 500 and gold, perhaps signaling the beginning of a “decoupling” of asset classes.
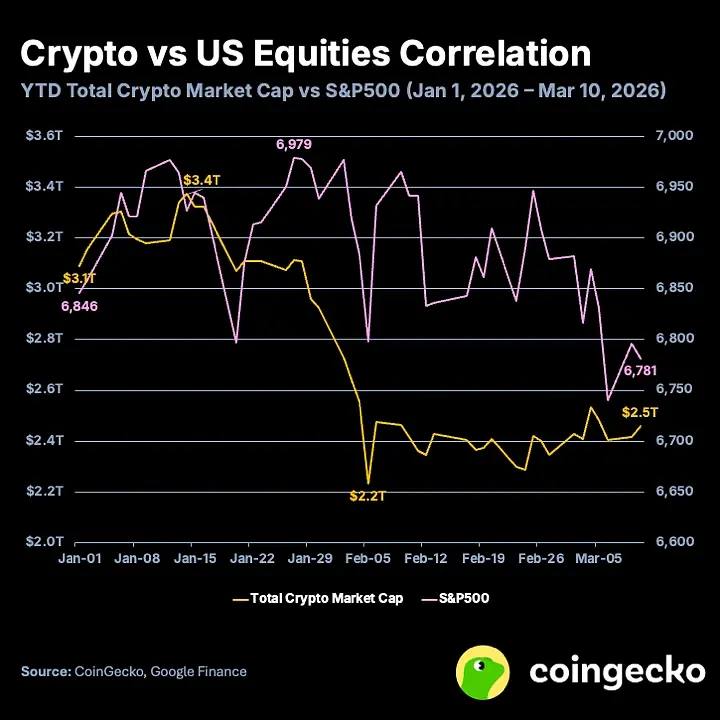
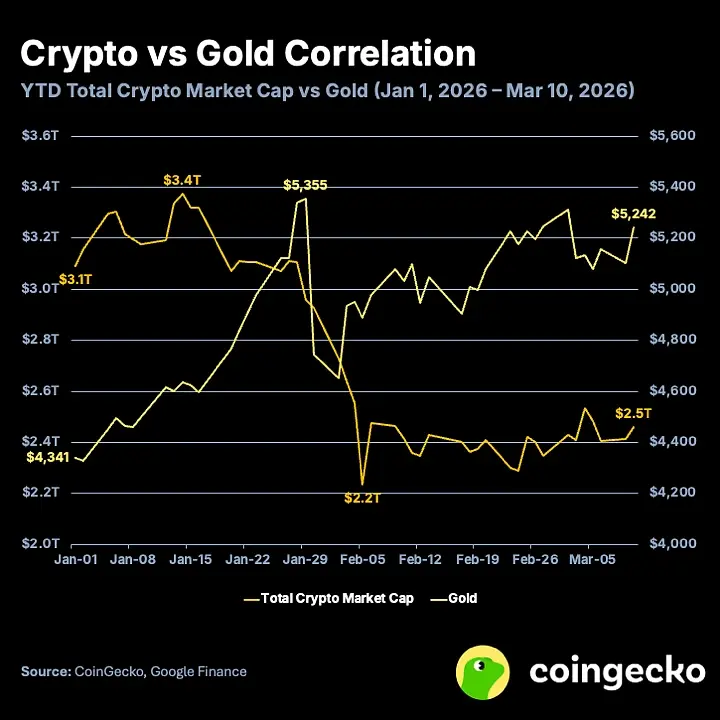
From the beginning of the year to date, the correlation between total cryptocurrency market cap and the S&P 500 is 0.49, indicating a moderate positive correlation, similar to 2025 (annual correlation of 0.46). On the other hand, the correlation between cryptocurrencies and gold has shifted to -0.69, indicating a moderate negative correlation. In 2025, the correlation between crypto and gold was only 0.19, showing weak or no correlation. Overall, cryptocurrencies as an asset class are shedding the long-held view of being purely risk assets, as they are decoupling from US stocks.
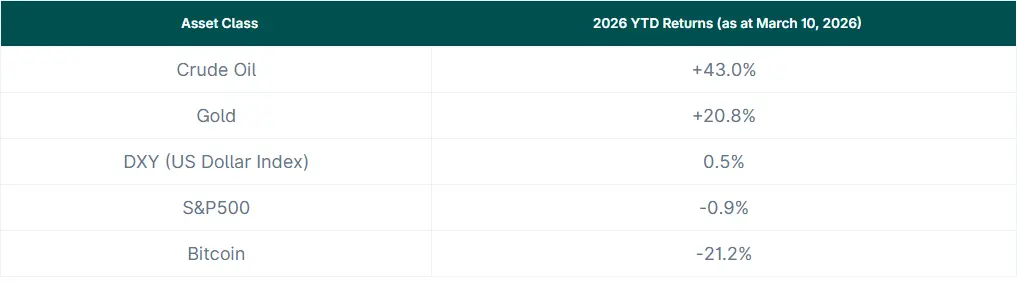
The US stock market, represented by the S&P 500, also faces significant resistance in 2026. Despite increasing investments in AI and generally strong economic and earnings data, the index has actually declined since the start of the year. Geopolitical tensions have undoubtedly played a role, but ongoing uncertainty about AI’s impact on the economy and workforce has also sparked fears of a “SaaS apocalypse.” Since the beginning of the year, the market cap of listed software and SaaS companies has evaporated between $1.3 trillion and $1.5 trillion, with forward P/E ratios and revenue multiples dropping sharply.
Additionally, gold has continued its strong momentum since 2024, with gains exceeding 20% so far this year. Gold is typically viewed as a stable store of value and safe haven, but with prices soaring, it now exhibits higher volatility. Ongoing geopolitical and macroeconomic pressures continue to drive its upward trend, with retail traders and sovereign nations alike rushing to buy.
Related: BTC Options Insights: Why March 20 Is a Key Turning Point for Volatility?
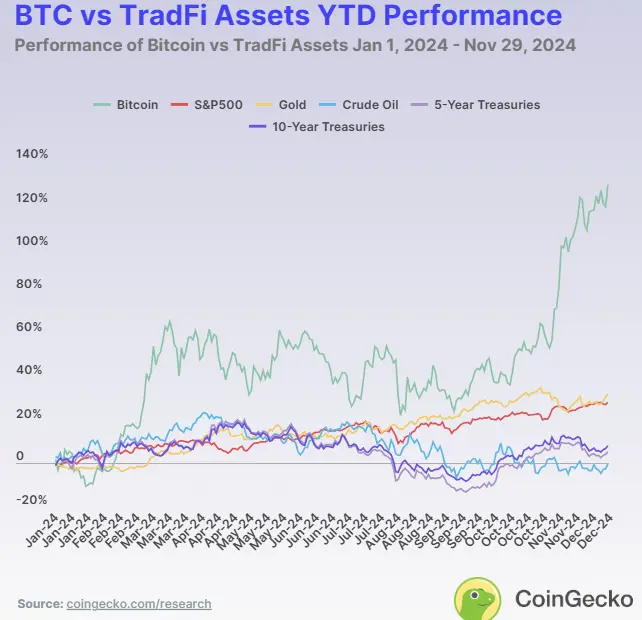
2026’s performance is starkly different from 2024. For reference, below is the performance of Bitcoin and other assets in 2024 (published December 2024).
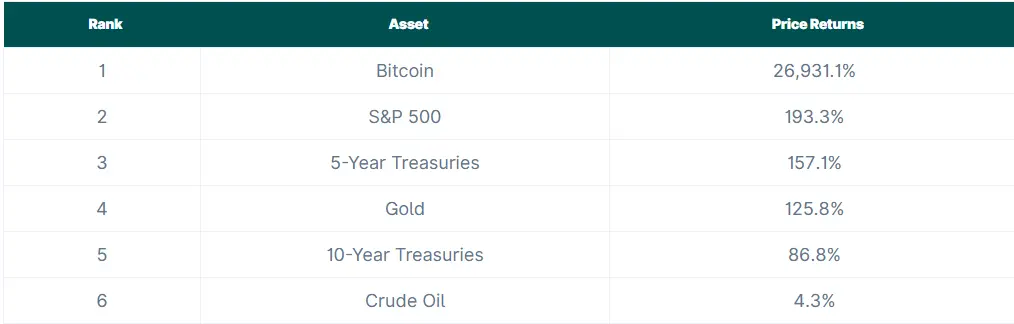
Known as “digital gold,” Bitcoin may have become a legitimate investment asset alongside stocks, commodities, and bonds. Over a 10-year horizon, Bitcoin’s return of 26,931.1% is astonishing. Imagine that an investment of $100 in 2014 would be worth $26,931.10 today. While these figures are impressive, it’s equally important to consider its short- and long-term performance relative to other assets.
Over the periods of year-to-date, 1 year, 3 years, 5 years, and 10 years, which asset has performed the best?
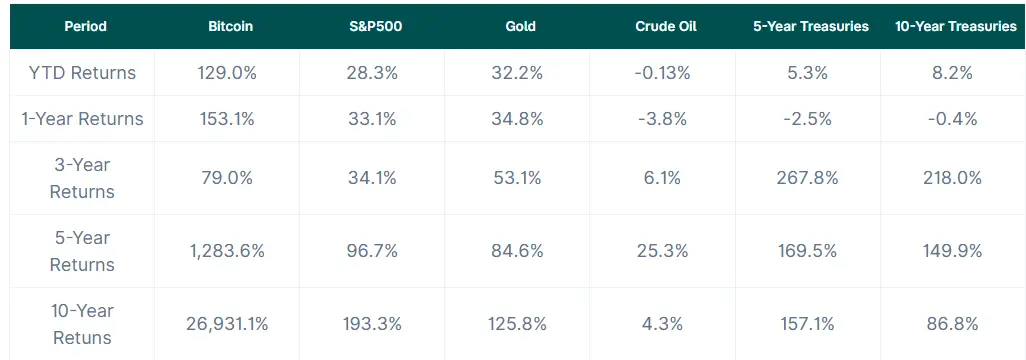
Performance over different time spans reveals each asset’s strengths and weaknesses. In 2024, Bitcoin was the top performer with a return of 129.0%. Gold followed closely with a 32.2% return, demonstrating its reliability as a traditional store of value. The S&P 500 remained strong, with a 28.3% return. Conversely, oil prices declined, with a return of -0.13%, and US Treasuries offered moderate returns: 5-year Treasuries at 5.3%, and 10-year Treasuries slightly higher at 8.2%.
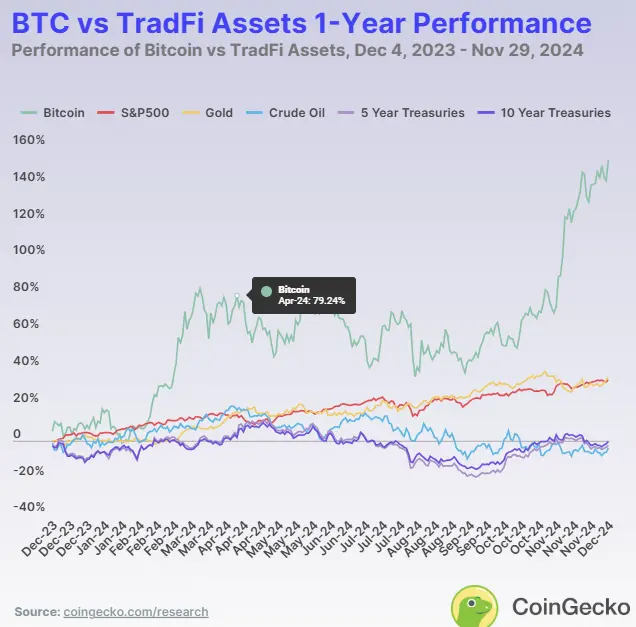
Looking at the 1-year period, Bitcoin continued to outperform other assets with a return of 153.1%. Gold returned 34.8%, and the S&P 500 gained 33.1%. The strong performance of these three assets over the past year indicates market stability. However, bonds are more sensitive to economic changes, with 5-year and 10-year bonds returning -4.3% and -2.6%, respectively. These figures highlight how bonds fluctuate with interest rates and fiscal policy.
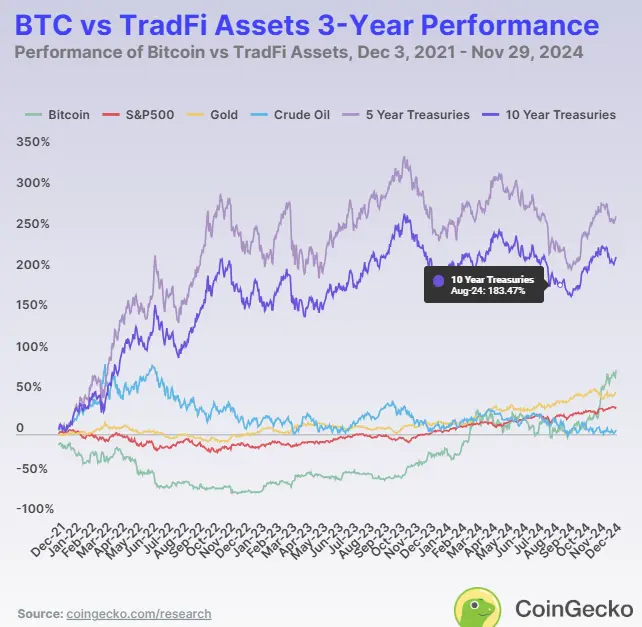
Over a three-year span, the market performance landscape shifted, with bonds gaining favor as economic stability became more important. US Treasuries led the way, with 5-year yields at 267.8% and 10-year yields at 218%. Bitcoin also performed well, with a return of 79%, while gold provided a steady 53.1%, offering some safety amid market uncertainty. Oil was the only asset underperforming in this period, with a return of just 6.1%.
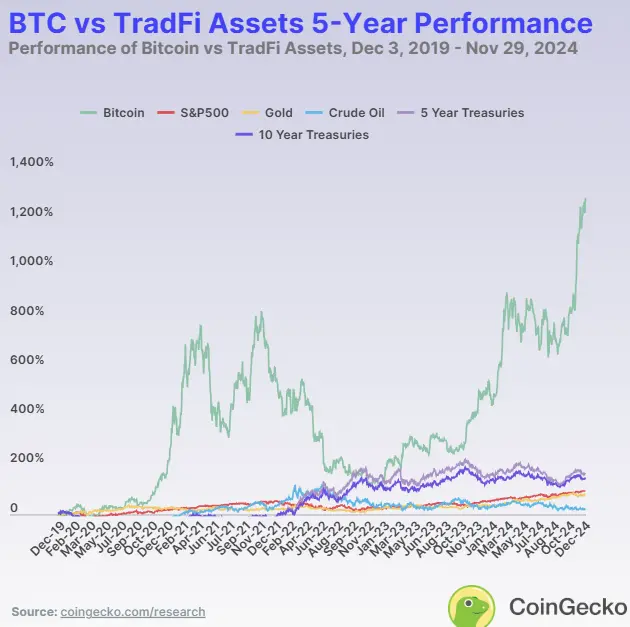
Over five years, Bitcoin’s performance was the strongest, with a return of 1,283.6%. The S&P 500 and gold remained stable, with returns of 96.7% and 84.6%, respectively. US Treasuries also performed well, with 5-year yields at 157.1% and 10-year yields at 149.9%. Oil prices increased by only 25.3%, making long-term investments less attractive. Data from this period suggest Bitcoin offers significant potential gains in mid-term investing, while stocks and gold provide steady growth and balance.
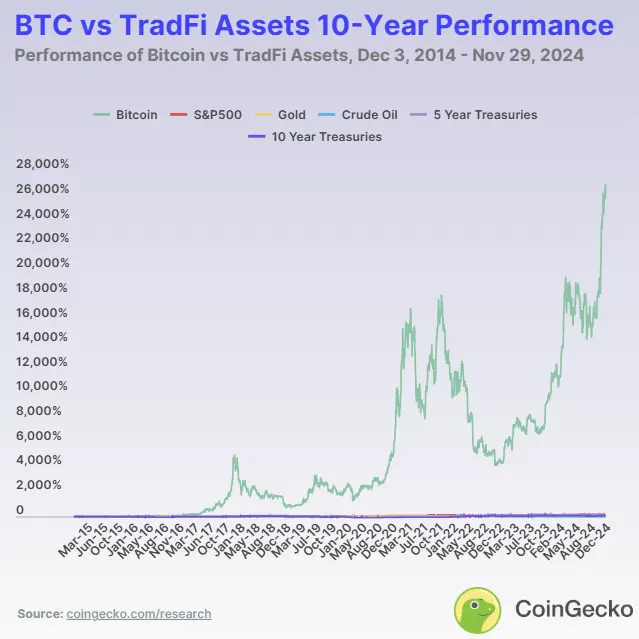
Looking at a decade-long horizon, Bitcoin’s growth rate reached 26,931.1%, demonstrating its enormous potential for early investors. Although other assets’ returns are far lower, they still provide stable income, such as the S&P 500’s 193.3% return and gold’s 125.8%. US Treasuries also maintained value, with 5-year yields at 157.1% and 10-year yields at 86.8%. Oil’s return was only 4.3%, far behind other assets.
This decade-long view confirms Bitcoin as the ultimate high-growth asset, while gold, bonds, and stocks offer safer, lower-yield alternatives for risk-averse investors. However, Bitcoin was still a relatively new asset at the time, with a much smaller market cap than other assets. Its smaller base allowed for faster growth.
Has Bitcoin’s volatility been high over the past decade?
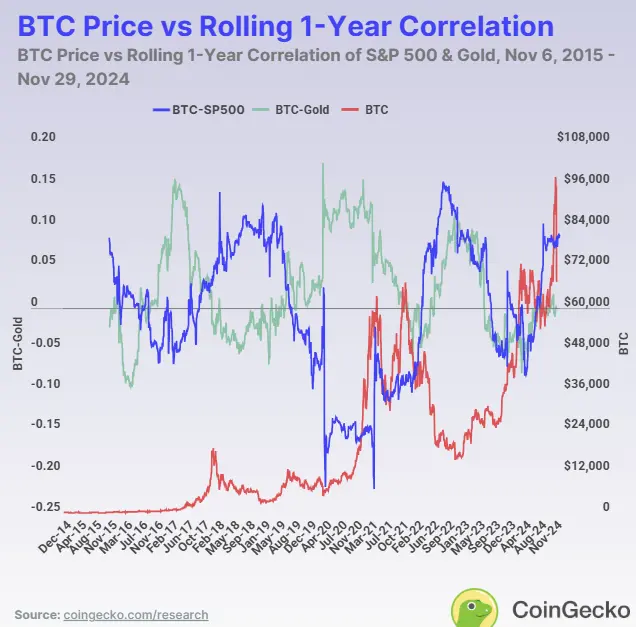
Over the past ten years, Bitcoin’s massive gains have been accompanied by significant volatility. Its lowest price was $172.15, and its highest soared to $103,679. The chart clearly shows Bitcoin’s cyclical nature, coinciding with halving events roughly every four years. During these ten years, Bitcoin experienced two “bull markets,” in 2017–2018 and 2020–2021, and is currently in one of these cycles. Near the end of each cycle, Bitcoin’s price often crashes below 70% of its peak, making its volatility quite high. This extreme volatility highlights its high-risk, high-reward profile, attractive to growth-focused investors but challenging for those seeking stability.
Does Bitcoin’s performance correlate with other assets?
Beyond volatility, analyzing Bitcoin’s correlation with major assets like the S&P 500 and gold can further reveal its unique behavior. Correlation analysis shows how Bitcoin either moves in tandem with or diverges from traditional markets:
Bitcoin and the S&P 500
Over the years, Bitcoin’s correlation with the S&P 500 (shown by the blue line) has been unstable, generally near zero before 2018. This low correlation indicates that during this period, Bitcoin’s behavior was largely independent of equities. However, since 2020, this correlation has increased, with Bitcoin and stocks moving more in sync during major economic events like the COVID-19 pandemic. Price correlations also align with Bitcoin’s rallies in 2018, 2020, and 2024.
Bitcoin and Gold
Regarding gold, Bitcoin’s correlation with it tends to be inversely related to its correlation with the S&P 500. This suggests that although both are viewed as alternative investments, Bitcoin and gold (shown by the green line) often move independently. Moreover, the correlation tends to reverse when Bitcoin’s price rises—correlation decreases as Bitcoin gains, and vice versa. This indicates that when Bitcoin underperforms, investors often turn to gold. During macroeconomic events, correlations can spike temporarily, reflecting similar market reactions. Nonetheless, Bitcoin has yet to fully establish itself as “digital gold.”
Comparison of 10-year price returns of Bitcoin and traditional assets: