What Are the Top Crypto Derivatives Market Signals in 2026: Futures Open Interest, Funding Rates, and Liquidation Data Explained


Understanding the Three Core Derivatives Signals: Futures Open Interest, Funding Rates, and Liquidation Data in 2026
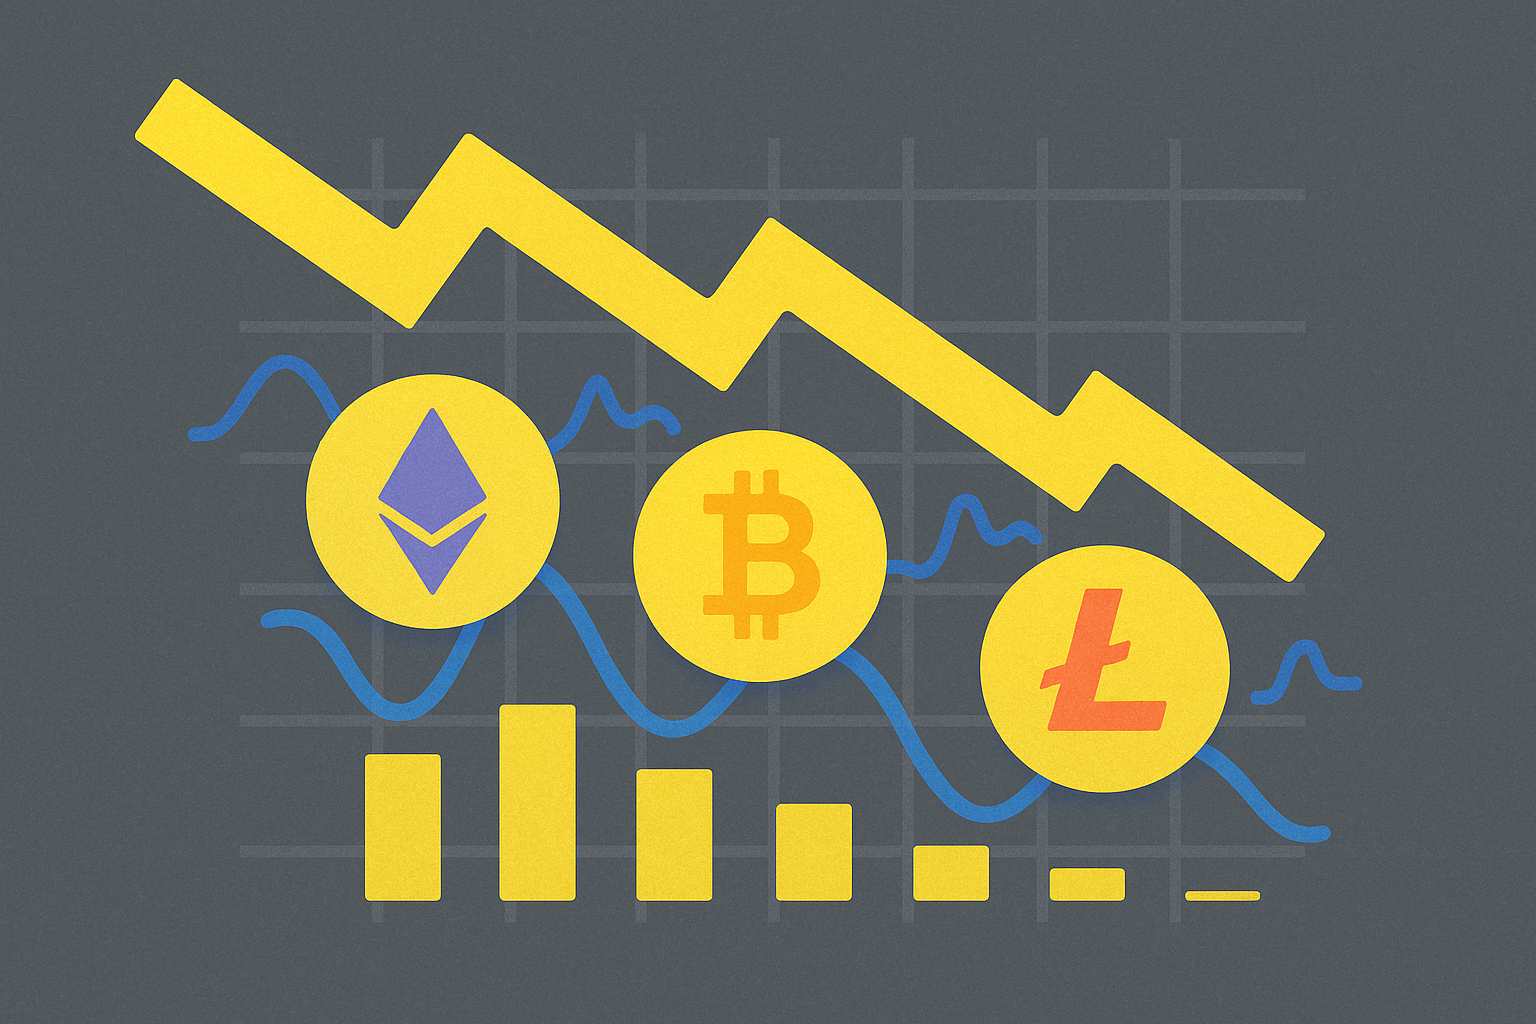
Crypto derivatives markets in 2026 operate through interconnected signals that provide institutional and retail traders with critical insights into market direction and risk levels. These three core metrics—futures open interest, funding rates, and liquidation data—work synergistically to reveal the true sentiment beneath price movements. Futures open interest measures the total value of active derivative contracts, and when Bitcoin futures reached $63 billion in recent periods, it demonstrated substantial institutional participation in derivatives trading. High open interest typically suggests strong conviction from leveraged traders, often indicating potential turning points when positions become extreme. Funding rates, expressed as periodic payments between long and short traders, fluctuate based on market sentiment extremes. Positive rates signal bullish bias with leverage, while negative rates indicate bearish positioning. When funding rates spike dramatically in either direction, they often precede liquidation cascades that can destabilize markets. Liquidation data captures the vulnerable positions—the unhedged contracts and margin calls awaiting execution. With derivatives markets showing $1.5 billion plus in activity, liquidation zones become critical support and resistance levels. Understanding how these three signals interact transforms raw market data into actionable intelligence, revealing whether price movements reflect genuine institutional accumulation or speculative excess vulnerable to sudden reversals.
Long-Short Ratios and Options Open Interest: Advanced Metrics for Reading Market Sentiment
Interpreting market sentiment requires understanding how traders position themselves through both long and short exposure. Long-short ratios reveal the balance between bullish and bearish traders, with elevated long positions signaling optimistic market conditions while increased short positioning suggests bearish pressure. When long-short ratios shift dramatically, they often precede significant price movements, making them invaluable for timing market entries and exits.
Options open interest complements this analysis by tracking the cumulative put and call contracts held by market participants. A rising call open interest during uptrends indicates fresh capital entering the market, reinforcing bullish momentum. Conversely, expanding put open interest during downtrends confirms distribution phases where sellers dominate. The put-call ratio, calculated from these open interest levels, provides precise sentiment measurements across different strike prices and expiration dates.
For 2026, combining long-short ratios with options open interest creates a comprehensive sentiment framework. Price action gains credibility when accompanied by rising open interest and supporting volume—this convergence signals authentic trend development rather than temporary reversals driven by short covering. When prices rise while open interest declines, skepticism is warranted as rallies may reflect short squeeze dynamics rather than genuine buying interest.
These advanced metrics work synergistically on platforms like gate, where traders access real-time long-short data and options chains. Professional analysts examine 90-day moving averages of open interest to filter noise, comparing current levels against historical context. During uncertain economic periods like 2026's outlook, these sentiment indicators help distinguish between organic market moves and tactical positioning shifts, enabling traders to align with authentic market trends rather than temporary fluctuations.
Practical Applications: How Professional Traders Use Derivatives Signals to Predict Market Reversals
Professional traders leverage multiple derivatives signals in concert to identify potential reversals before they fully materialize. Leading indicators like the Relative Strength Index and Stochastic Oscillator serve as early warning systems, detecting overbought and oversold conditions that often precede trend changes. When these momentum oscillators diverge from price action—showing weakness while prices remain elevated, for instance—traders recognize a significant reversal signal within their derivatives trading framework.
Pattern-based approaches complement these indicators effectively. The Sushi Roll reversal pattern, a distinctive 10-bar sequence, provides structural confirmation of trend exhaustion. Skilled traders combine this pattern with RSI or momentum indicators to validate signals before executing positions. When a bearish Sushi Roll forms alongside an RSI reversal showing divergence, the convergence of these derivatives market signals substantially increases confidence in the anticipated move. Options market metrics further refine this analysis: elevated put-call ratios and increased put skew suggest institutional positioning for downside protection, while gamma exposure data indicates market sensitivity to sharp price movements. By integrating futures-based signals—such as funding rates and open interest levels—with these technical indicators and options sentiment, professional traders construct a multifaceted analytical framework. This layered approach to derivatives signals dramatically improves timing accuracy for reversal trades, as multiple confirmation sources reduce false signals and enhance risk management. The combination transforms raw market data into actionable intelligence for predicting directional reversals with higher precision.
FAQ
What is Futures Open Interest (OI)? How does it reflect the long-short power comparison in cryptocurrency markets?
Open Interest represents total outstanding futures contracts, reflecting market bullish-bearish sentiment. Rising OI with price gains indicates strong trend conviction, while OI divergence from price signals potential reversal in crypto derivatives markets.
What does Funding Rate mean in crypto derivatives? What does high funding rate mean?
Funding Rate is a periodic payment mechanism in perpetual futures that keeps contract prices aligned with spot prices. High funding rates indicate strong bullish sentiment, meaning long position holders pay shorts premium fees, signaling potential market overheating or reversal risk.
How to judge market risk and potential price reversals through liquidation data?
Liquidation data reveals extreme leveraged positions that trigger forced selling. High liquidation concentrations indicate fragile positions prone to reversal. Monitor liquidation levels aligned with technical resistance and support to identify potential turning points and manage risk effectively.
What are the main trading signals for cryptocurrency derivatives market in 2026? How to comprehensively use these indicators?
In 2026, key signals include futures open interest, funding rates, and liquidation data. Combine technical indicators like moving averages and RSI with institutional flows and DeFi activity. Monitor liquidation levels for entry points, use funding rates to gauge market sentiment, and correlate open interest changes with price movements for comprehensive market analysis.
What is the relationship between futures open interest, funding rates, and liquidation data?
Futures open interest, funding rates, and liquidation data are interconnected market signals. High open interest reflects increased positions, rising funding rates indicate higher holding costs, and elevated liquidation data reveals forced exits. Together, they signal market leverage, sentiment shifts, and potential price reversals.
How can retail investors leverage these derivative market signals to optimize their trading strategies?
Monitor open interest, funding rates, and liquidation data to gauge market sentiment. Rising open interest with positive funding rates suggests bullish momentum—ideal for long positions. Conversely, high liquidation data signals potential reversals. Use these signals to time entries, adjust position sizes, and set stop-losses effectively for improved risk management.
What are the main risks in crypto derivatives trading and how to prevent liquidation risk?
Main risks include market volatility and liquidation exposure. Prevent liquidation by: using stop-loss orders, maintaining adequate margin, monitoring funding rates and open interest levels, managing position sizing, and adjusting leverage according to market conditions.
Do derivatives data signals differ across major exchanges?
Yes, derivatives signals vary across exchanges due to different trading volumes, liquidity levels, and user bases. Each platform's open interest, funding rates, and liquidation data reflect unique market dynamics, so analyzing multiple sources provides more comprehensive market insights.
FAQ
What is TA coin and what are its main functions and uses?
TA coin is the native cryptocurrency of Trusta.AI, powering its identity and on-chain reputation protocol. It facilitates transactions, governance participation, and enables trust-building within the Crypto+AI ecosystem through decentralized identity verification and reputation mechanisms.
How to buy and trade TA coin? Which exchanges and payment methods are supported?
You can purchase TA coin through multiple payment methods including credit cards, bank transfers, and peer-to-peer trading. TA is available on major crypto exchanges offering flexible trading options for both beginners and experienced traders seeking to buy, sell, or trade TA tokens efficiently.
What is the total supply of TA coin? What is the token distribution mechanism?
TA coin has a total supply of 1 billion tokens. The distribution mechanism allocates 20% to investors and advisors, with a 12-month cliff period after TGE followed by gradual vesting.
How secure is TA coin? How to safely store and manage it?
TA coin utilizes advanced blockchain security protocols. Store securely in reputable Web3 wallets, enable two-factor authentication, and backup your recovery phrases. Never share private keys. Hardware wallets offer maximum security for long-term holdings.
What is the project background and team of TA coin? What technological innovations does it have?
TA coin is developed by leading AI and security experts from Fintech and Web3 sectors. The team focuses on revolutionary identity protocols and digital identity management. Key innovations include advanced AI and blockchain integration for secure, decentralized identity solutions.
What are the price trends and market prospects of TA coin? What are the investment risks?
TA coin has shown a 8.59% decline over the past 7 days, reflecting current market sentiment. The market demonstrates strong fundamentals with growing adoption potential. Long-term prospects appear positive as the project expands its ecosystem and use cases.
Share
Content
Understanding the Three Core Derivatives Signals: Futures Open Interest, Funding Rates, and Liquidation Data in 2026
Long-Short Ratios and Options Open Interest: Advanced Metrics for Reading Market Sentiment
Practical Applications: How Professional Traders Use Derivatives Signals to Predict Market Reversals
FAQ
FAQ
How to Buy Cryptocurrency


Trending Cryptocurrencies


Why is CryptoJack so hopeful about Gate.com and GT TOKEN in this bull run?

How Do Crypto Derivatives Market Signals Like Open Interest, Funding Rates, and Liquidations Predict Price Movements in 2025?
How do crypto derivatives market signals predict price movements: analyzing futures open interest, funding rates, and liquidation data?

What Are Crypto Derivatives Market Signals: Analyzing PENGU's Open Interest, Funding Rates, and Liquidation Data?

What Are the Derivatives Market Signals for Crypto in 2025: Analyzing Futures Open Interest, Funding Rates, and Liquidation Data?

How Will Derivative Market Signals Impact ARTX's Price in 2025?

Fear Market in Cryptocurrency: How to Navigate Extreme Sentiment and Find Opportunities

Coincheck: A Japan-Based Digital Currency Exchange
SEI Price Analysis: Technical Formation Indicating Potential Bullish Breakout

Is Polkadot Legit? A Look at Whether DOT Is Real or a Scam

HBAR Price Analysis: Hedera's Mainnet Upgrade and Enterprise Partnerships Fuel Market Momentum