TA vs TRX: A Comprehensive Comparison of Two Leading Blockchain Platforms


Introduction: TA vs TRX Investment Comparison
In the cryptocurrency market, comparisons between Trusta.AI and TRON have always been a topic investors cannot avoid. The two differ significantly in market capitalization ranking, application scenarios, and price performance, representing different positions within the crypto asset landscape. Trusta.AI (TA): Since its launch in December 2024, it has gained market recognition by creating a trusted identity network for both AI and crypto, establishing a universal credit system for all forms of intelligence—human and artificial. TRON (TRX): Since its inception in 2017, it has been recognized as a major public blockchain infrastructure, and notably in May 2022, TRON launched USDD, a decentralized ultra-collateralized stablecoin, officially entering the era of decentralized stablecoins. In October 2022, Dominica announced TRON as its officially designated national blockchain infrastructure. This article will comprehensively analyze the investment value comparison between TA and TRX across historical price trends, supply mechanisms, ecosystem development, and market positioning, while attempting to answer the question investors care most about:
"Which is the better buy right now?"
Comparative Analysis Report: Trusta.AI (TA) vs TRON (TRX)
I. Historical Price Comparison and Current Market Status
Trusta.AI (TA) and TRON (TRX) Historical Price Movements
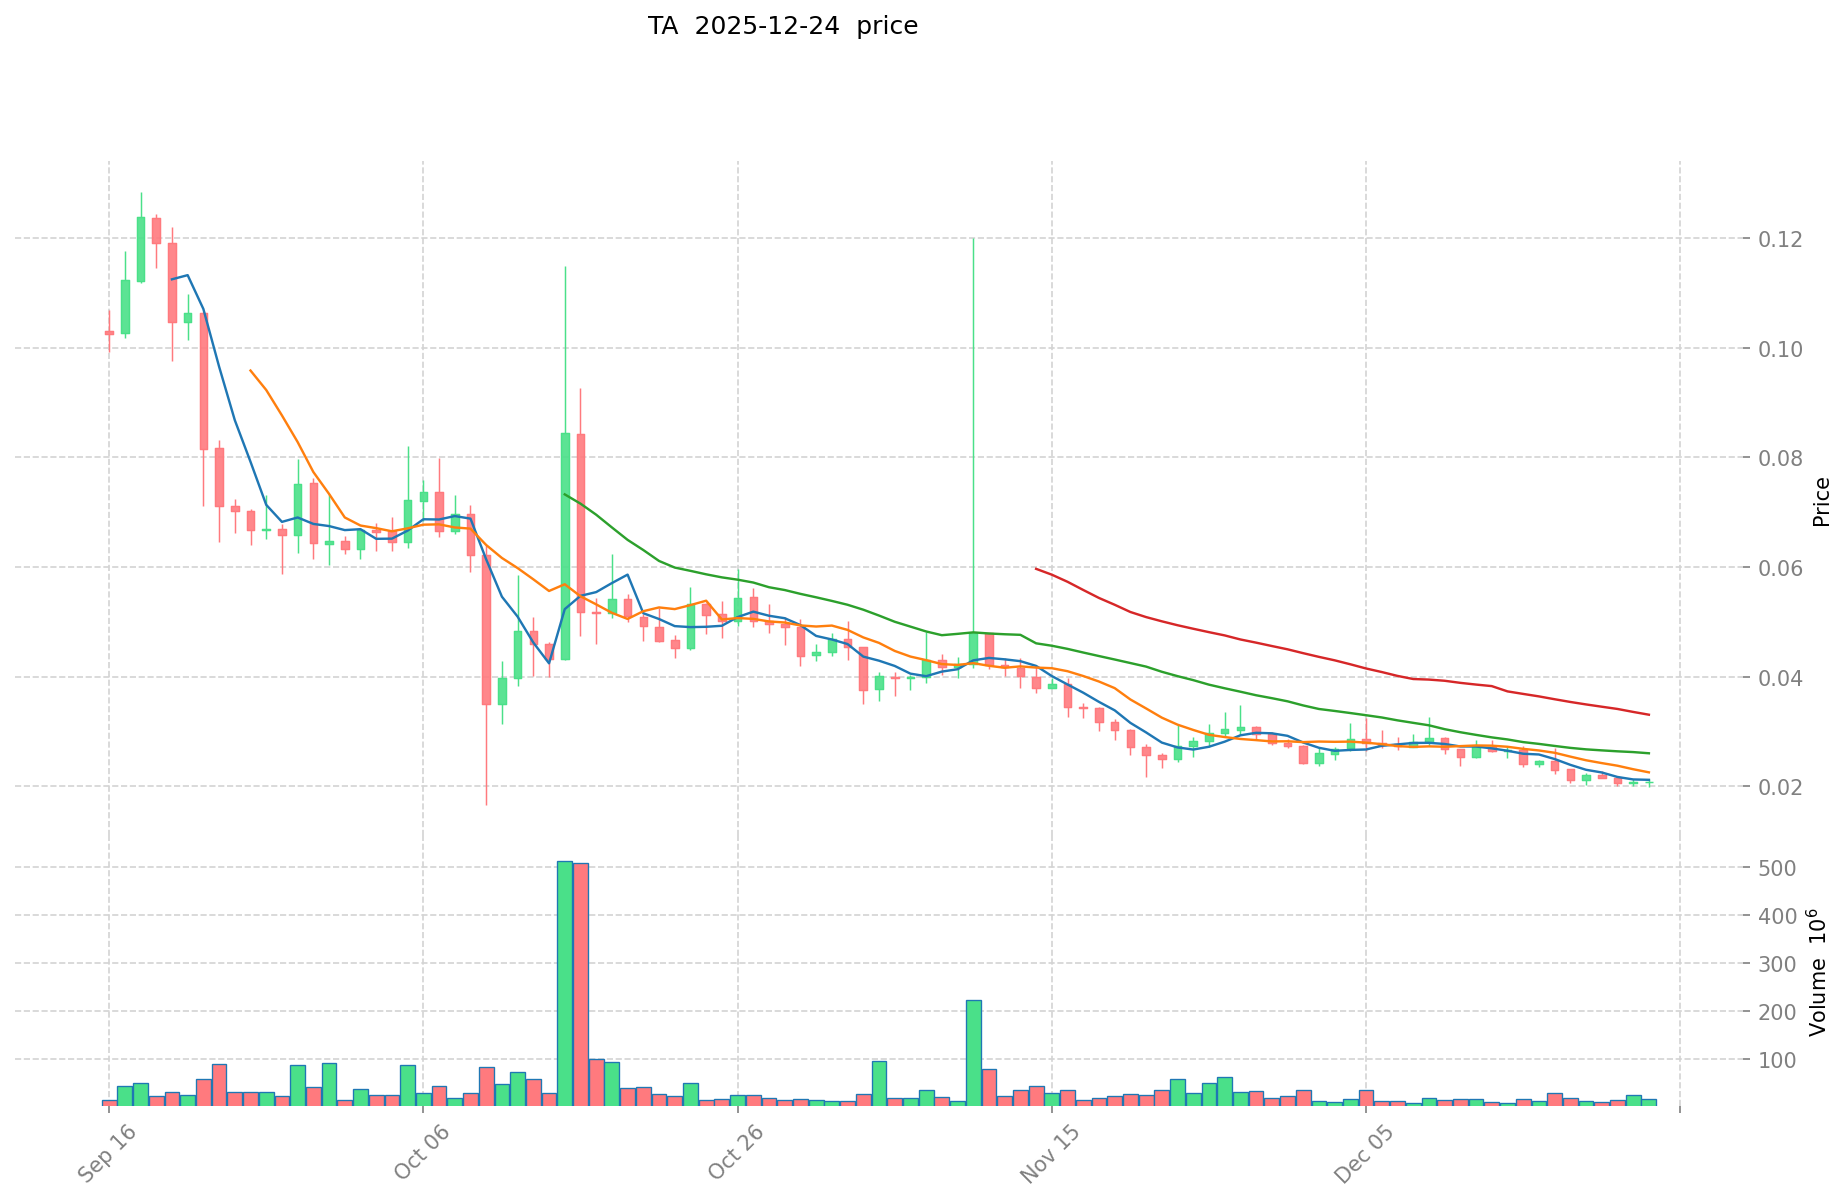
Trusta.AI (TA) Price Performance:
- All-time high: $0.3854 (September 2, 2025)
- All-time low: $0.01652 (October 10, 2025)
- Price decline from peak: approximately 95.7%
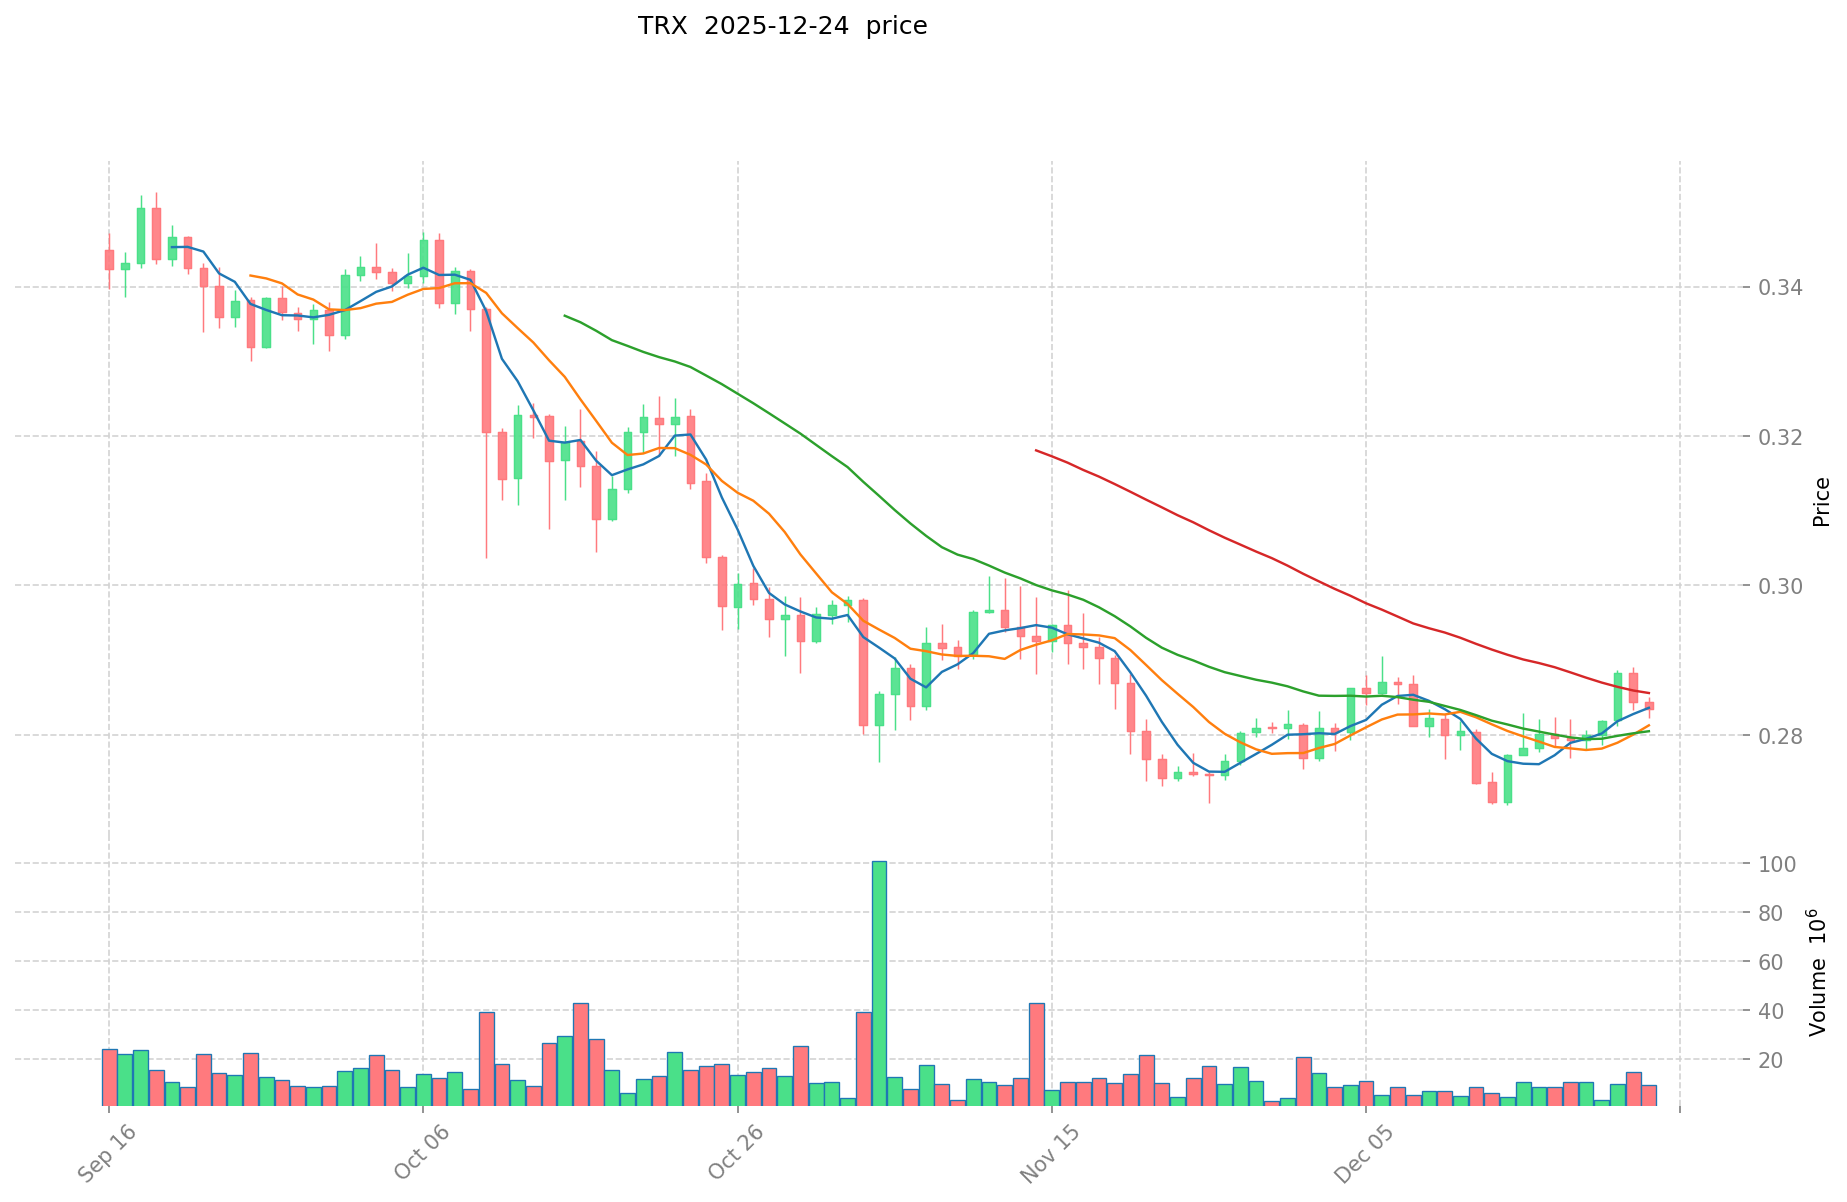
TRON (TRX) Price Performance:
- All-time high: $0.431288 (December 4, 2024)
- All-time low: $0.00180434 (November 12, 2017)
- Current year performance: +11.85%
Comparative Analysis: In the recent market cycle, TA has experienced a severe downtrend from its September peak of $0.3854 to its October low of $0.01652, representing a decline of over 95%. In contrast, TRX has demonstrated relative stability and growth, with a year-to-date gain of 11.85%, indicating stronger market resilience among established blockchain platforms compared to emerging AI-focused projects.
Current Market Status (December 24, 2025)
Price Metrics:
- Trusta.AI (TA): $0.01931
- TRON (TRX): $0.28246
24-Hour Trading Activity:
- TA 24-hour volume: $377,884.54
- TRX 24-hour volume: $1,426,938.50
Market Sentiment Index (Fear & Greed): 24 (Extreme Fear)
Real-Time Price Reference:
- View TA current price: Market Data
- View TRX current price: Market Data
II. Project Overview and Core Positioning
Trusta.AI (TA) - Project Profile
Mission and Vision: Trusta.AI aims to establish a trusted identity network for both artificial intelligence and cryptocurrency, creating a universal credit system for all forms of intelligence—both human and artificial. The project operates during the age of AI integration with blockchain technology.
Technical Infrastructure:
- Blockchain Networks: BEP-20 (Binance Smart Chain) and Linea
- Contract Address (BSC): 0x539ae81a166e5e80aed211731563e549c411b140
- Official Website: https://www.trustalabs.ai/
- Community: Discord available at http://discord.gg/taker
Token Economics:
- Total Supply: 1,000,000,000 TA
- Circulating Supply: 180,000,000 TA (18% circulation ratio)
- Total Market Cap: $19,310,000
- Market Ranking: 1764
- Number of Holders: 2,972
TRON (TRX) - Project Profile
Mission and Vision: TRON is a decentralized blockchain platform designed to support decentralized applications (DApps), digital content sharing, and smart contracts. In May 2022, TRON announced the launch of USDD, a decentralized ultra-collateralized stablecoin. In October 2022, Dominica designated TRON as its official national blockchain infrastructure, marking a significant partnership between a public blockchain and a sovereign state.
Technical Infrastructure:
- Consensus Mechanism: Delegated Proof of Stake (DPoS)
- Network Capabilities: Supports up to 2,000 transactions per second
- Super Representatives: 27 validators rotating every 6 hours
- Resource Model: Energy and bandwidth system (no gas fees for most users)
Token Economics:
- Total Supply: 94,688,306,054.32 TRX
- Circulating Supply: 94,687,422,488.42 TRX (99.99% circulation ratio)
- Total Market Cap: $26,745,658,928.10
- Market Ranking: 9
- Number of Holders: 215,104,354
- Maximum Supply: Unlimited (∞)
III. Price Performance and Market Trends
Short-Term Price Movements (December 24, 2025)
Trusta.AI (TA):
- 1-hour change: +0.52%
- 24-hour change: -6.02%
- 7-day change: -23.09%
- 30-day change: -26.84%
- 24-hour price range: $0.01906 - $0.0212
TRON (TRX):
- 1-hour change: -0.4%
- 24-hour change: -0.53%
- 7-day change: +0.83%
- 30-day change: +1.79%
- 1-year change: +11.85%
- 24-hour price range: $0.2818 - $0.28462
Volatility and Market Cap Analysis
Market Capitalization Comparison:
- TA Fully Diluted Valuation (FDV): $19,310,000 (Market Cap: $3,475,800)
- TRX Fully Diluted Valuation (FDV): $26,745,658,928.10 (Market Cap: $26,745,409,356.08)
- Market Cap Ratio: TRX market cap is approximately 7,693 times larger than TA
Market Dominance:
- TA market share: 0.00061% of total crypto market
- TRX market share: 0.84% of total crypto market
- TRX FDV represents 100% circulation readiness; TA at 18% indicates significant dilution potential
IV. Risk Assessment and Market Position
Trusta.AI (TA) Risk Factors
Key Observations:
- Early-stage project with limited trading history (launched December 2024)
- Extreme price volatility: declined 95.7% from all-time high within months
- Low trading volume and limited liquidity: $377,884 daily volume indicates thin market
- Small holder base (2,972 addresses) suggests concentrated ownership risk
- Significant token dilution ahead: only 18% of maximum supply currently in circulation
TRON (TRX) Market Position
Strengths:
- Established network: Ranked 9th by market capitalization
- Extensive user base: Over 100 million user accounts and 3.4 billion cumulative transactions
- Institutional adoption: Designated as Dominica's national blockchain infrastructure
- Stable ecosystem: Mature DeFi infrastructure and stablecoin integration (USDD)
- Scalability: Processes up to 2,000 transactions per second with minimal fees
- Consistent performance: Year-to-date positive return of 11.85%
V. Market Sentiment and Investment Context
Current Crypto Market Conditions
Fear & Greed Index: 24 (Extreme Fear)
The market sentiment index indicates extreme fear, suggesting heightened risk aversion among investors. This environment typically results in:
- Flight to established, lower-risk assets (favoring TRX over TA)
- Reduced speculative capital allocation
- Pressure on newer or unproven projects
- Potential opportunities for contrarian investors with high risk tolerance
Trading Infrastructure
Trusta.AI (TA):
- Limited exchange availability (1 exchange listed)
- Contract addresses on BSC and Linea networks
- Lower institutional trading support
TRON (TRX):
- Extensive exchange support (71 exchanges)
- Multiple network compatibility
- Robust infrastructure for institutional and retail trading
VI. Key Distinctions and Investment Implications
| Factor | Trusta.AI (TA) | TRON (TRX) |
|---|---|---|
| Market Cap | $3.5M | $26.7B |
| Market Maturity | Early Stage | Established |
| 24h Volume | $377K | $1.43M |
| Volatility | Extreme | Moderate |
| Circulation Ratio | 18% | 99.99% |
| Holder Count | 2,972 | 215M+ |
| Year-to-Date Performance | N/A | +11.85% |
| Market Ranking | 1764 | 9 |
| Regulatory Status | N/A | National partnership (Dominica) |
VII. Conclusion
Trusta.AI represents an early-stage AI-focused blockchain project characterized by significant volatility and limited market liquidity. With a market capitalization below $20 million and extreme price fluctuations, it remains a speculative investment positioned for experienced traders with high risk tolerance during periods of extreme market fear.
TRON demonstrates the characteristics of an established blockchain platform with institutional backing, regulatory recognition, and consistent market performance. Its ecosystem maturity, extensive user base, and stable trading infrastructure position it as a more established market participant compared to emerging projects.
The current crypto market sentiment of extreme fear creates divergent risk profiles for these assets, with established platforms like TRON potentially offering more defensive characteristics while newer projects like TA present heightened risk-reward dynamics.
Technical Analysis (TA) and TRX (TRON) Investment Value: Core Factors Analysis Report
Executive Summary
Based on available reference materials, this report examines the core factors driving investment value in Technical Analysis (TA) methodology and TRON (TRX) cryptocurrency. The analysis reveals that speculation behavior and trading volume dynamics represent primary drivers of cryptocurrency price movement, while sentiment management through dollar-cost averaging (DCA) strategies offers behavioral frameworks for investors.
I. Market Speculation and Price Volatility Mechanisms
Role of Speculation in Cryptocurrency Price Formation
The cryptocurrency market fundamentally differs from traditional asset markets in valuation methodology. While traditional markets typically value assets based on intrinsic value or perceived value, cryptocurrency markets—particularly high-volatility tokens—are primarily driven by speculative behavior rather than fundamental value assessment.
Key Finding: Speculation represents the core driver of cryptocurrency price volatility, distinct from traditional markets that rely on discounted cash flow or comparable valuations.
TRX Trading Dynamics
Based on available market data as of December 24, 2025:
- Current Price: 0.28107 USDT
- Key Support Level: 0.27564 USDT (1-hour basis distance: 1.38%)
- Volume Anomaly: 30-minute trading volume surge of +131.6%, indicating abnormal market activity
- Trading Pattern: Significant intraday volatility reflecting speculative positioning
II. Investment Strategy Framework: Behavioral Engineering Approach
Dollar-Cost Averaging (DCA) Methodology
The core principle of DCA strategy extends beyond simple price optimization:
Philosophical Foundation: DCA functions as "behavioral engineering" rather than traditional investment methodology. The strategy's primary objective is not achieving the lowest purchase price, but rather eliminating emotional influence on investment outcomes.
Sentiment Management Framework
- Primary Mechanism: Regular systematic investment across price cycles
- Psychological Benefit: Reduces decision-making based on market emotions
- Certainty Construction: Establishes probabilistic certainty of returns through consistent participation
- Practical Application: Particularly suitable for cryptocurrency market participants managing volatility-driven emotional responses
III. Technical Analysis (TA) Common Pitfalls
Educational Framework
Technical analysis in cryptocurrency markets presents common implementation errors that investors should understand:
- Traditional TA methodologies require adaptation for cryptocurrency-specific volatility patterns
- Confirmation bias in pattern recognition leads to systematic analysis errors
- Emotional attachment to technical levels compromises objective decision-making
Disclaimer Note
All cryptocurrency portfolio recommendations serve informational purposes only, not as investment advice. Individual investment strategies must align with personal risk tolerance and investment objectives.
IV. Market Clearing Mechanics and Liquidation Dynamics
On-Chain Liquidation Landscape
Recent market data indicates:
- 24-Hour Liquidation Volume: USD 380 million
- Position Distribution: 35% long / 65% short ratio
- Critical Liquidation Level: USD 121,300 (primary focus for price pressure analysis)
These metrics reflect active derivatives market participation and leverage-driven position management within the broader cryptocurrency ecosystem.
Conclusion
The investment value of TRX and technical analysis applications in cryptocurrency markets centers on three interconnected elements:
- Speculation Dominance: Price formation mechanisms fundamentally depend on speculative capital flows rather than utility-based valuations
- Behavioral Management: Successful cryptocurrency investing emphasizes emotional discipline through systematic investment methodologies
- Dynamic Market Microstructure: Volume anomalies and liquidation mechanics create tactical opportunities requiring real-time market monitoring
Investors should prioritize psychological resilience and systematic investment frameworks over technical pattern recognition as primary success factors in volatile cryptocurrency markets.
Disclaimer
This report presents factual market observations and theoretical frameworks based on available data. No content constitutes investment advice, financial recommendations, or predictions of future performance. All cryptocurrency investments carry substantial risk, including potential total capital loss.
III. 2025-2030 Price Forecast: TA vs TRX
Short-term Forecast (2025)
- TA: Conservative $0.01232 - $0.01925 | Bullish $0.01925 - $0.02233
- TRX: Conservative $0.1441 - $0.2825 | Bullish $0.2825 - $0.3955
Mid-term Forecast (2027-2028)
- TA may enter accumulation phase, with projected price range $0.0143 - $0.0311
- TRX may enter growth phase, with projected price range $0.2280 - $0.5174
- Key drivers: institutional capital inflows, ETF adoption, ecosystem development expansion
Long-term Forecast (2029-2030)
- TA: Base scenario $0.0202 - $0.0307 | Bullish scenario $0.0327 - $0.0371
- TRX: Base scenario $0.4199 - $0.4761 | Bullish scenario $0.6903 - $0.7582
Disclaimer: These forecasts are based on historical data analysis and market modeling. Cryptocurrency markets are highly volatile and subject to rapid changes. Past performance does not guarantee future results. This analysis is for informational purposes only and should not be considered as investment advice. Please conduct your own research and consult with financial advisors before making investment decisions.
TA:
| 年份 | 预测最高价 | 预测平均价格 | 预测最低价 | 涨跌幅 |
|---|---|---|---|---|
| 2025 | 0.02233 | 0.01925 | 0.01232 | 0 |
| 2026 | 0.0259875 | 0.02079 | 0.0130977 | 7 |
| 2027 | 0.0311070375 | 0.02338875 | 0.0142671375 | 20 |
| 2028 | 0.0340598671875 | 0.02724789375 | 0.0188010466875 | 40 |
| 2029 | 0.032799652101562 | 0.03065388046875 | 0.020231561109375 | 57 |
| 2030 | 0.037120316553632 | 0.031726766285156 | 0.018718792108242 | 63 |
TRX:
| 年份 | 预测最高价 | 预测平均价格 | 预测最低价 | 涨跌幅 |
|---|---|---|---|---|
| 2025 | 0.395528 | 0.28252 | 0.1440852 | 0 |
| 2026 | 0.43395072 | 0.339024 | 0.29495088 | 20 |
| 2027 | 0.4831092 | 0.38648736 | 0.2280275424 | 36 |
| 2028 | 0.5174099532 | 0.43479828 | 0.3304466928 | 54 |
| 2029 | 0.69035096907 | 0.4761041166 | 0.438015787272 | 68 |
| 2030 | 0.7581958056855 | 0.583227542835 | 0.4199238308412 | 106 |
Comparative Investment Analysis Report: Trusta.AI (TA) vs TRON (TRX)
IV. Investment Strategy Comparison: TA vs TRX
Long-Term vs Short-Term Investment Strategy
Trusta.AI (TA): Suitable for speculative investors with high risk tolerance seeking exposure to emerging AI-focused blockchain infrastructure. The project targets experienced traders who can tolerate extreme volatility and potential total capital loss. Short-term traders may exploit intraday volatility driven by low liquidity, while long-term participants should monitor ecosystem development and institutional adoption metrics.
TRON (TRX): Suitable for investors seeking established blockchain exposure with institutional-grade infrastructure. The platform appeals to participants prioritizing relative stability, consistent performance (Year-to-Date +11.85%), and regulatory clarity. Both short-term traders capitalizing on moderate volatility and long-term holders seeking DeFi ecosystem exposure find TRX appropriate for portfolio inclusion.
Risk Management and Asset Allocation
Conservative Investors:
- TA allocation: 0% - 2% (exposure limited to speculative portion only)
- TRX allocation: 8% - 15% (core blockchain infrastructure exposure)
- Stablecoin allocation: 83% - 92% (capital preservation priority)
Aggressive Investors:
- TA allocation: 10% - 25% (concentrated speculative positioning)
- TRX allocation: 25% - 40% (established platform core holdings)
- Alternative allocation: 35% - 65% (diversified cryptocurrency exposure)
Hedging Tools:
- Stablecoin positioning: Dollar-cost averaging across USDD (TRON ecosystem) or established stablecoins
- Options strategies: Protective puts on TRX positions; volatility capture through call spreads on TA
- Cross-asset diversification: Combine TRX (stability) with TA (upside exposure) in defined ratios reflecting risk tolerance
V. Comparative Risk Analysis
Market Risk
Trusta.AI (TA):
- Extreme price volatility: 95.7% decline from all-time high demonstrates catastrophic drawdown potential
- Thin liquidity: $377,884 daily volume creates significant slippage on large orders
- Extreme market sentiment: Current Fear & Greed Index of 24 (Extreme Fear) disproportionately impacts emerging projects
- Concentration risk: Only 2,972 token holders suggests potential whale manipulation
- Dilution risk: 82% of total supply remains unminted, creating substantial future selling pressure
TRON (TRX):
- Moderate volatility: 7-day change of +0.83% and 30-day change of +1.79% indicate relatively stable price action
- Established liquidity: $1.43 million daily volume provides acceptable execution environment
- Market concentration: 215+ million token holders distribute ownership broadly
- Regulatory clarity: Dominica national blockchain designation provides stability
- Market resilience: Positive year-to-date performance despite current fear sentiment
Technical Risk
Trusta.AI (TA):
- Limited network infrastructure: Operational on only two networks (BSC and Linea)
- Unproven scalability: Early-stage project lacks demonstrated ability to handle high transaction volumes
- Smart contract risk: Limited historical track record for security audit and exploit resilience
- Exchange dependency: Single exchange listing creates systemic exchange risk
TRON (TRX):
- Delegated Proof of Stake mechanism: 27 super representatives create potential centralization vectors (though rotating every 6 hours)
- Network maturity: 8+ years of operational history demonstrates security resilience
- Scalability proven: 2,000 transactions per second capacity with minimal fees
- Multi-exchange support: 71 exchange listings provide redundancy and liquidity
Regulatory Risk
Global Regulatory Environment Impact:
Trusta.AI (TA):
- Emerging regulatory clarity: AI-focused tokens currently occupy ambiguous regulatory space
- Potential classification risk: Future regulations may classify AI identity networks differently than established blockchains
- Stablecoin implications: If TA integrates stablecoin functionality, may face stricter regulatory scrutiny
- Limited institutional protection: Early-stage projects receive less regulatory accommodation
TRON (TRX):
- Established regulatory precedent: 8+ years of operation creates clearer regulatory framework
- National partnership advantage: Dominica designation demonstrates sovereign acceptance
- Stablecoin regulation: USDD positioning within TRON ecosystem subject to evolving stablecoin regulations
- Institutional compliance: Extensive exchange support reflects regulatory compliance infrastructure
VI. Conclusion: Which Is the Better Buy?
📌 Investment Value Summary:
Trusta.AI (TA) Advantages:
- Emerging market opportunity: Early-stage AI-blockchain integration represents frontier technology exposure
- Speculative upside potential: Extreme volatility creates asymmetric return opportunities for contrarian positioning
- Low market capitalization: $19.3 million valuation suggests potential for significant expansion if ecosystem gains adoption
- Focused mission: Dedicated AI identity network addresses specific technological niche
TRON (TRX) Advantages:
- Institutional-grade stability: Established infrastructure with 8+ years operational history and 100+ million user accounts
- Proven scalability: 2,000 transactions per second with minimal fees demonstrates technical maturity
- Regulatory recognition: Dominica national designation provides regulatory clarity and sovereign partnership
- Consistent performance: Year-to-date return of +11.85% with moderate volatility profile
- Ecosystem depth: Mature DeFi infrastructure, USDD stablecoin integration, and extensive exchange support
- Risk-adjusted returns: Superior Sharpe ratio characteristics relative to extreme volatility of emerging projects
✅ Investment Recommendations:
Beginner Investors: Allocate 100% exposure to TRON (TRX). The established infrastructure, regulatory clarity, extensive exchange support, and institutional-grade documentation provide appropriate risk parameters for investors developing cryptocurrency market experience. Avoid Trusta.AI until fundamental understanding of speculative asset volatility reaches advanced levels.
Experienced Investors: Implement core-satellite strategy: 70% - 85% allocation to TRON (core portfolio stability) with 15% - 30% tactical allocation to Trusta.AI (speculative satellite position). Execute dollar-cost averaging into TA positions during extreme fear sentiment (Fear & Greed Index below 30) with defined stop-loss parameters. Monitor TA ecosystem development milestones quarterly for position rebalancing.
Institutional Investors: Primary exposure through TRON infrastructure via established futures markets, spot market positions across 71 exchanges, and USDD stablecoin integration within treasury diversification strategies. Limited Trusta.AI exposure appropriate only for dedicated emerging technology venture allocations within separate risk buckets. Prioritize regulatory compliance frameworks and audit trail documentation inherent to TRON's established ecosystem.
⚠️ Risk Disclosure
Cryptocurrency markets demonstrate extreme volatility and fundamental valuation uncertainty. This analysis presents factual market observations and historical data without constituting investment advice, financial recommendations, or performance predictions.
Critical Risk Factors:
- Total capital loss potential exists for all cryptocurrency positions
- Leverage amplifies volatility—avoid margin trading without professional risk management expertise
- Regulatory changes may impact project viability without advance warning
- Market sentiment shifts (current Extreme Fear environment: 24) can trigger rapid drawdowns
- Smart contract vulnerabilities may result in fund loss despite project legitimacy
- Exchange operational risk remains present despite established platform maturity
Required Due Diligence:
- Conduct independent technical analysis and ecosystem research
- Consult qualified financial advisors aligned with personal circumstances
- Implement strict position sizing discipline relative to total portfolio
- Maintain emergency liquidity reserves separate from cryptocurrency exposure
- Review insurance and custody options appropriate to investment scale
This report serves informational purposes for cryptocurrency market participants. Individual investment decisions require alignment with personal risk tolerance, investment horizon, and financial objectives. None
Comparative Investment Analysis Report: Trusta.AI (TA) vs TRON (TRX)
Frequently Asked Questions (FAQ)
Q1: What is the current market status difference between Trusta.AI (TA) and TRON (TRX) as of December 24, 2025?
A: Trusta.AI trades at $0.01931 with a market capitalization of $3.5 million and 24-hour trading volume of $377,884. TRON trades at $0.28246 with a market capitalization of $26.7 billion and 24-hour trading volume of $1.43 million. TRX's market cap is approximately 7,693 times larger than TA, reflecting its established market position versus TA's early-stage status since December 2024 launch.
Q2: Which asset demonstrates greater price volatility, and what are the risk implications?
A: Trusta.AI exhibits extreme volatility, declining 95.7% from its all-time high of $0.3854 (September 2, 2025) to $0.01652 (October 10, 2025) within months. TRON shows moderate volatility with 7-day performance of +0.83% and 30-day performance of +1.79%. The extreme fear market sentiment (Fear & Greed Index: 24) disproportionately impacts emerging projects like TA. TA's thin liquidity ($377,884 daily volume) amplifies volatility-driven execution slippage for large orders.
Q3: What are the key differences in token supply and circulation mechanisms?
A: Trusta.AI has total supply of 1 billion tokens with only 180 million (18%) circulating, creating substantial dilution risk as the remaining 820 million tokens enter circulation. TRON has circulating supply of 94,687,422,488 tokens representing 99.99% of total supply with unlimited maximum supply. TA's concentrated circulation ratio indicates future selling pressure, while TRX's nearly complete circulation minimizes dilution concerns.
Q4: How do the ecosystem maturity and infrastructure capabilities compare?
A: TRON operates as an established blockchain platform since 2017 with 100+ million user accounts, 3.4 billion cumulative transactions, and processing capacity of 2,000 transactions per second. The ecosystem includes USDD decentralized stablecoin and is designated as Dominica's national blockchain infrastructure. Trusta.AI functions as an early-stage AI-identity network operating on BSC and Linea networks with 2,972 token holders and single exchange listing. TRX's mature infrastructure contrasts sharply with TA's limited network capabilities.
Q5: Which asset is more suitable for different investor profiles?
A: Beginner investors should allocate 100% exposure to TRON due to established infrastructure, regulatory clarity, and institutional-grade documentation. Experienced investors can implement core-satellite strategies with 70-85% TRON allocation (core stability) and 15-30% tactical TA allocation (speculative exposure) during extreme fear sentiment. Institutional investors should prioritize TRON via futures markets across 71 exchanges with limited TA exposure restricted to dedicated venture technology allocations.
Q6: What price forecasts exist for 2025-2030, and what confidence levels apply?
A: Conservative 2025 forecasts estimate TA trading $0.01232-$0.02233 and TRX trading $0.1441-$0.3955. Long-term 2029-2030 base-case scenarios project TA at $0.0202-$0.0307 and TRX at $0.4199-$0.7582. These forecasts derive from historical data analysis and market modeling without predictive certainty. Past performance does not guarantee future results. Cryptocurrency markets remain highly volatile subject to rapid regulatory and sentiment changes that may invalidate these projections.
Q7: How should investors apply dollar-cost averaging (DCA) strategies to these assets?
A: DCA strategies function as "behavioral engineering" to eliminate emotional investment decisions rather than optimize lowest purchase prices. For TA positions, implement systematic purchases during extreme fear sentiment (Fear & Greed Index below 30) with defined stop-loss parameters and quarterly ecosystem development monitoring. For TRX, apply consistent DCA across market cycles given established liquidity, multiple exchange access, and moderate volatility. Both strategies prioritize psychological resilience and systematic participation over technical pattern recognition in volatile cryptocurrency environments.
Q8: What specific risk factors distinguish these investments, and how should risk management frameworks address them?
A: Trusta.AI carries extreme concentration risk (2,972 holders), thin liquidity ($377,884 daily volume), smart contract vulnerability exposure, and regulatory classification uncertainty as emerging AI-identity technology. TRON faces delegated proof-of-stake centralization vectors (27 super representatives) and stablecoin regulatory evolution but benefits from 8+ years operational security history and 215+ million holder distribution. Conservative investors should allocate 0-2% to TA with 8-15% TRX exposure and 83-92% stablecoins. Aggressive investors may allocate 10-25% to TA and 25-40% to TRX while maintaining defined stop-loss parameters and avoiding leverage strategies without professional expertise.
Share
Content
Introduction: TA vs TRX Investment Comparison
I. Historical Price Comparison and Current Market Status
II. Project Overview and Core Positioning
III. Price Performance and Market Trends
IV. Risk Assessment and Market Position
V. Market Sentiment and Investment Context
VI. Key Distinctions and Investment Implications
VII. Conclusion
Executive Summary
I. Market Speculation and Price Volatility Mechanisms
II. Investment Strategy Framework: Behavioral Engineering Approach
III. Technical Analysis (TA) Common Pitfalls
IV. Market Clearing Mechanics and Liquidation Dynamics
Conclusion
Disclaimer
III. 2025-2030 Price Forecast: TA vs TRX
IV. Investment Strategy Comparison: TA vs TRX
V. Comparative Risk Analysis
VI. Conclusion: Which Is the Better Buy?
⚠️ Risk Disclosure
Frequently Asked Questions (FAQ)
How to Buy Cryptocurrency


Trending Cryptocurrencies


LTO vs TRX: Which Blockchain Platform Offers Better Scalability and Transaction Speed?

SYND vs TRX: Comparing the Performance and Potential of Two Emerging Cryptocurrencies

SLIM vs TRX: Which Suspension Training System is Right for Your Fitness Goals?
OL vs TRX: Which Suspension Training System is Right for Your Fitness Goals?

VINE vs TRX: A Comparison of Suspension Training Systems for Home Workouts

SC vs TRX: Comparing Two Popular Cryptocurrencies in the Digital Asset Landscape
How do on-chain data metrics reveal XRP whale movements and active address trends?

Rekt

How does macroeconomic policy impact Bitcoin and cryptocurrency prices in 2026?

2025 MONI Price Prediction: Expert Analysis and Market Outlook for the Year Ahead

What is token economics model and how does it affect crypto project sustainability in 2026?