SHDW vs KAVA: A Comprehensive Comparison of Two Leading Blockchain Infrastructure Tokens
Introduction: SHDW vs KAVA Investment Comparison
In the cryptocurrency market, comparisons between Shadow Token and Kava have become an important topic for investors. The two projects not only exhibit significant differences in market capitalization rankings, application scenarios, and price performance, but also represent distinct positioning within the crypto asset landscape.
Shadow Token (SHDW): Launched in 2017, it has gained market recognition through its focus on decentralized storage solutions optimized for both web2 and web3 users on the Solana blockchain.
Kava (KAVA): Established in 2019, it has been recognized as a cross-chain decentralized finance platform providing collateralized lending and stablecoin services for mainstream digital assets such as BTC, XRP, BNB, and ATOM, supported by over 100 companies globally.
This article will conduct a comprehensive analysis of SHDW vs KAVA investment value comparison across historical price trends, supply mechanisms, market adoption, and technical ecosystems, while addressing the core question investors care most about:
"Which is the better buy right now?"
Comparative Analysis Report: Shadow Token (SHDW) and Kava (KAVA)
I. Historical Price Comparison and Current Market Status
Price Trajectory of SHDW and KAVA
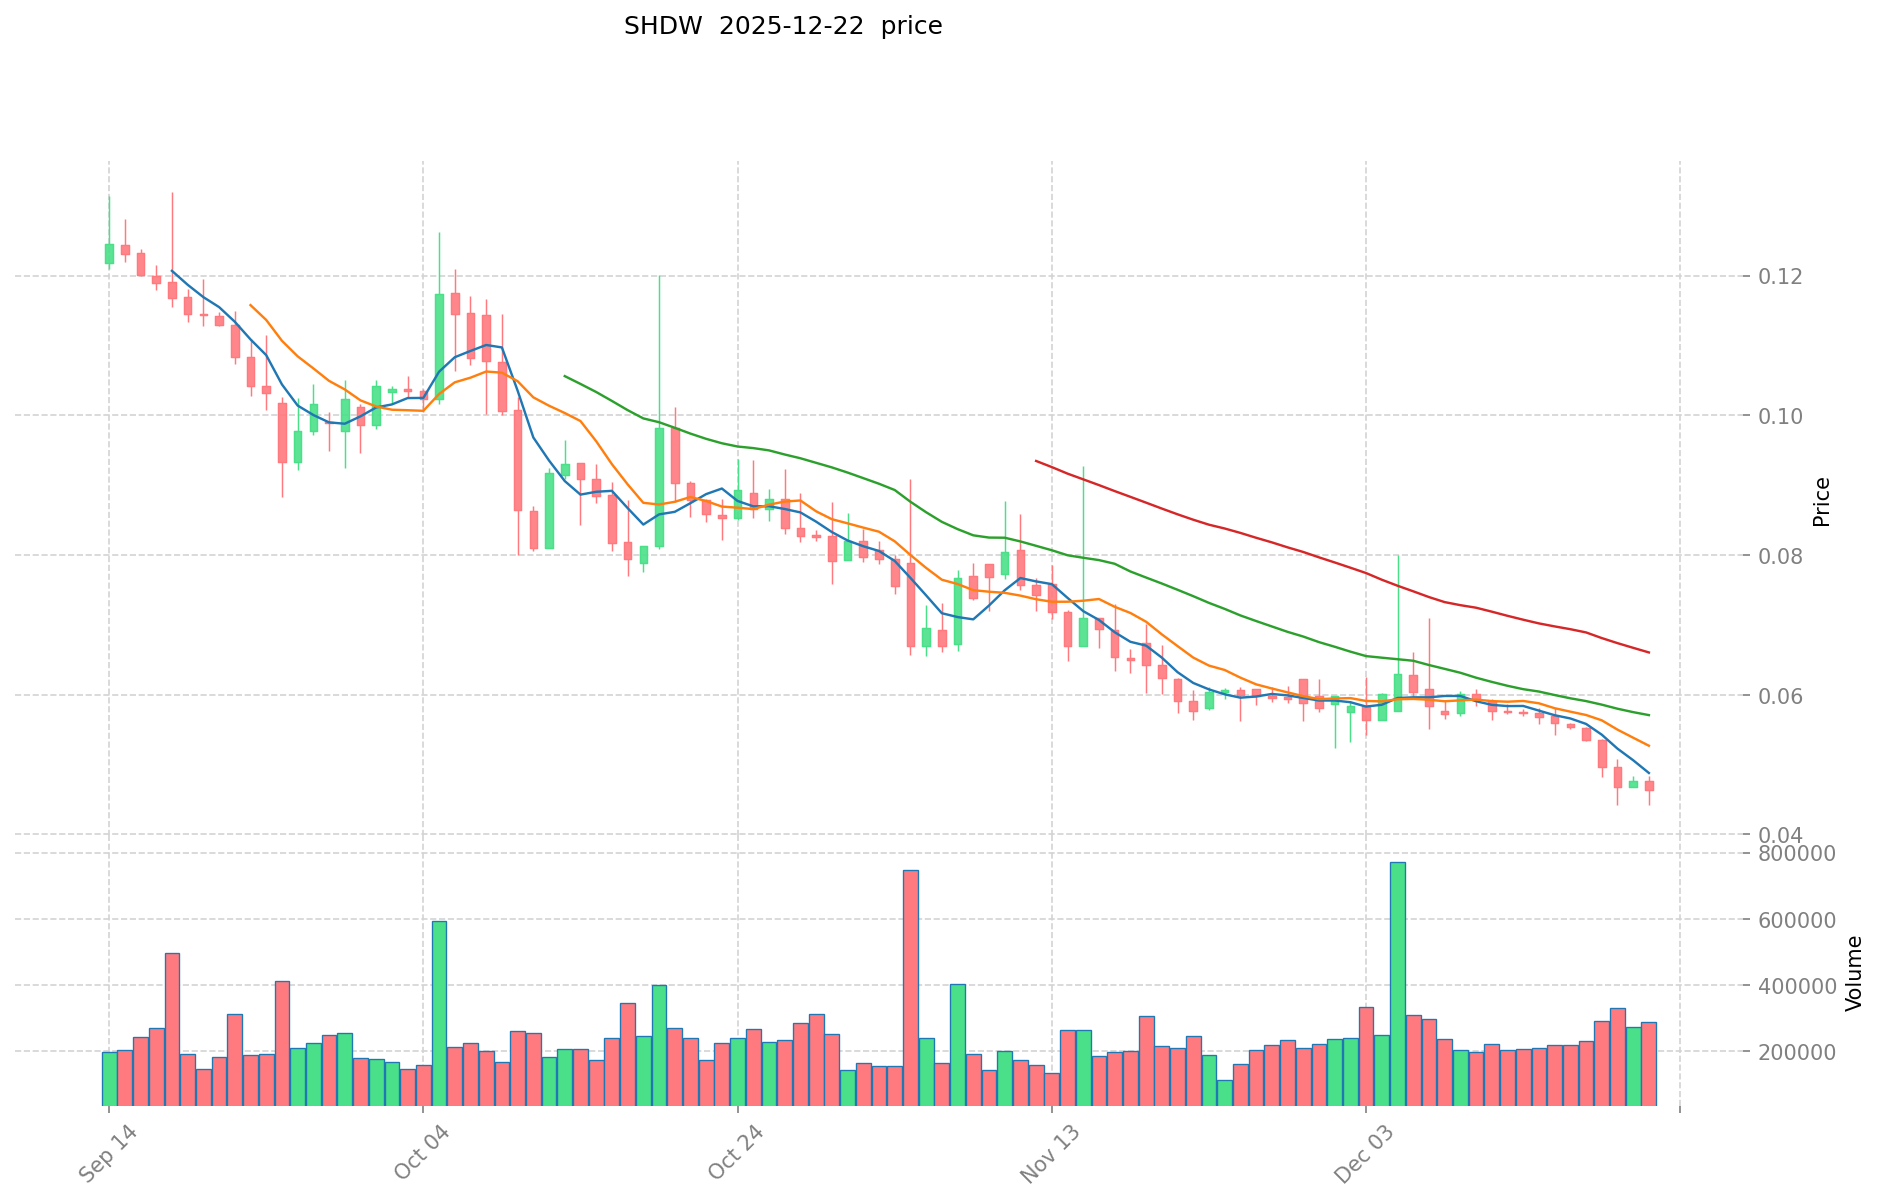
Shadow Token (SHDW):
- All-time high: $4.00 (March 27, 2024)
- All-time low: $0.04415 (December 21, 2025)
- Price decline from ATH to ATL: approximately 98.90%
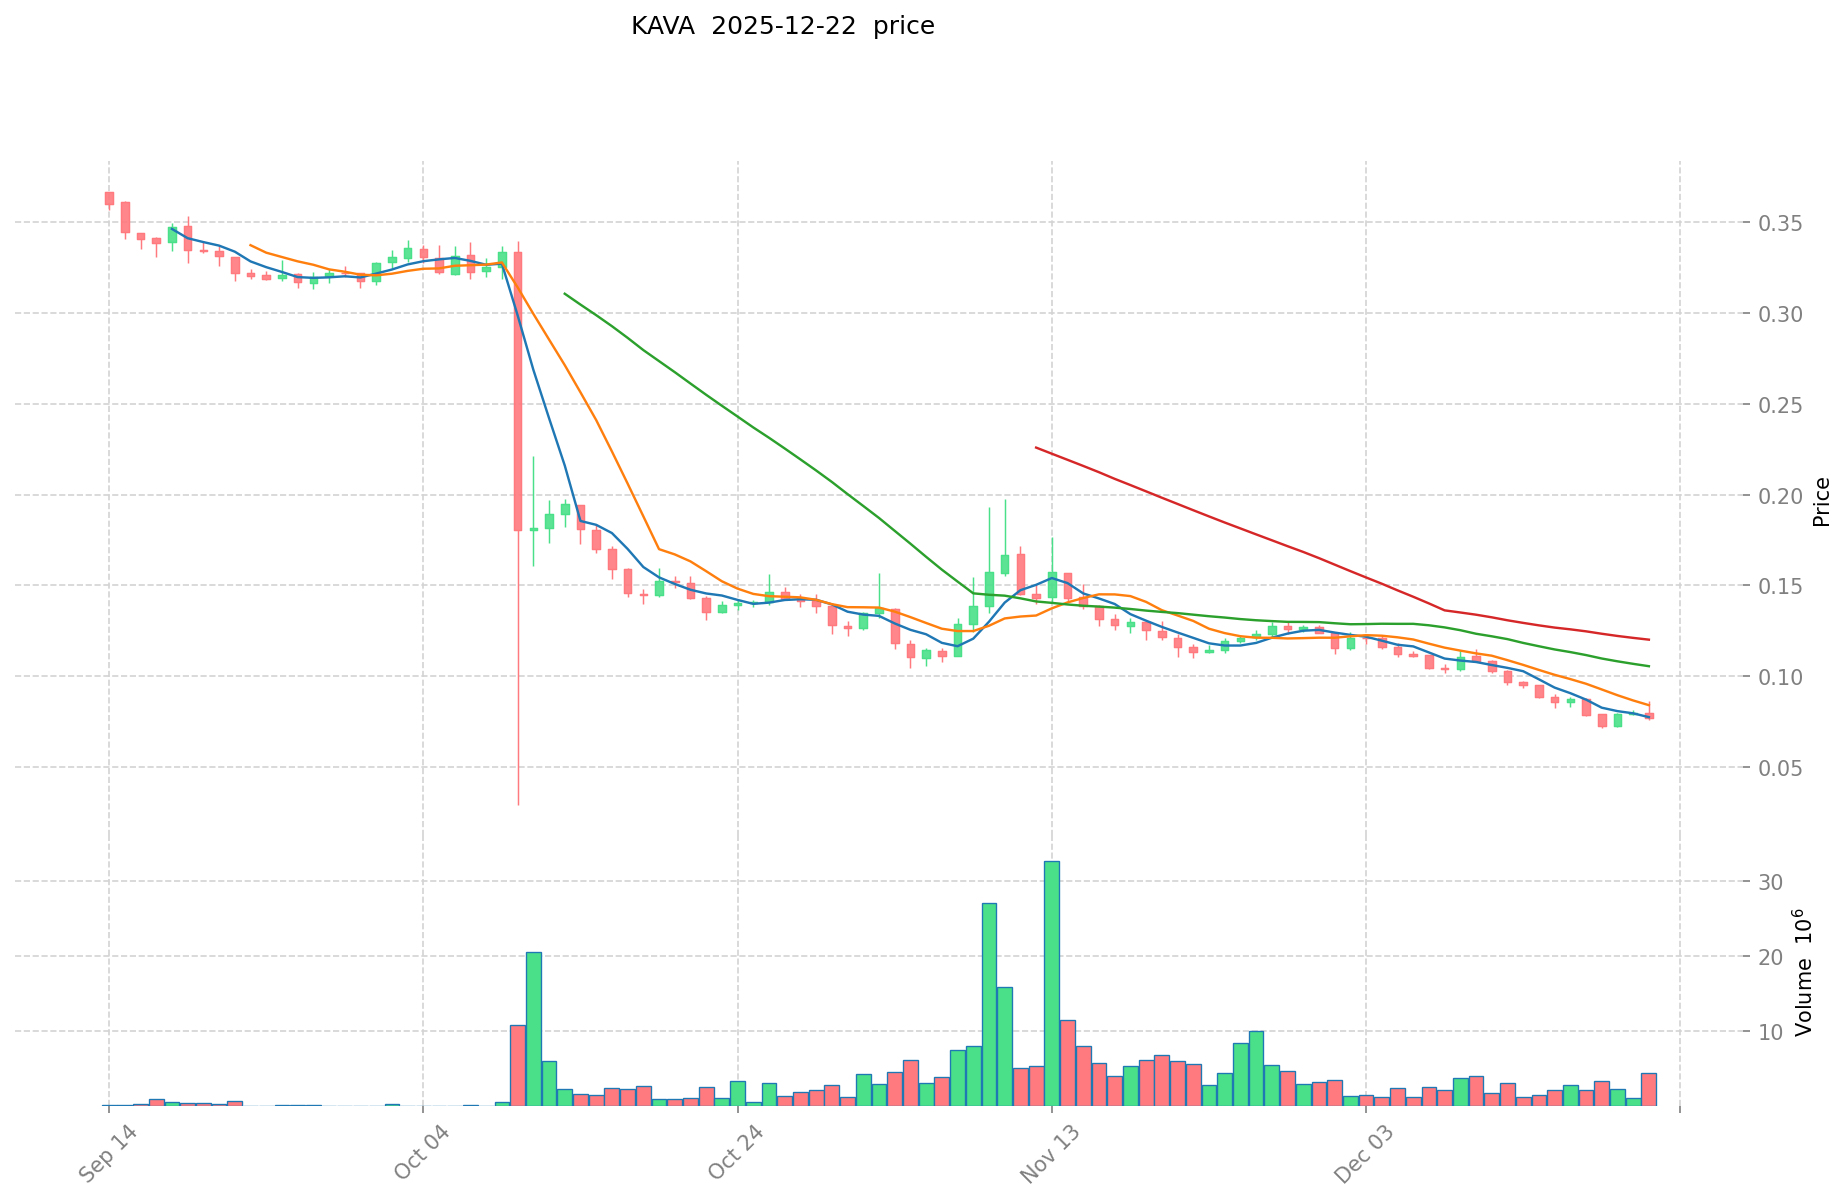
Kava (KAVA):
- All-time high: $9.12 (August 30, 2021)
- All-time low: $0.071579 (December 19, 2025)
- Price decline from ATH to ATL: approximately 92.15%
Current Market Status (December 22, 2025)
| Metric | SHDW | KAVA |
|---|---|---|
| Current Price | $0.04646 | $0.07956 |
| 24-Hour Change | +1.7% | +0.6% |
| 24-Hour High | $0.04839 | $0.07985 |
| 24-Hour Low | $0.04415 | $0.07576 |
| 24-Hour Trading Volume | $12,728.96 | $143,945.06 |
| Market Capitalization | $7,854,260.78 | $86,151,360.07 |
| Circulating Supply | 169,054,256.94 SHDW | 1,082,847,663 KAVA |
| Fully Diluted Valuation | $7,854,445.97 | $86,151,360.07 |
| Market Dominance | 0.00024% | 0.0026% |
Multi-Timeframe Price Performance
SHDW Performance:
- 1-hour change: +0.22%
- 24-hour change: +1.7%
- 7-day change: -19.0099%
- 30-day change: -21.15%
- 1-year change: -92.14%
KAVA Performance:
- 1-hour change: +0.01%
- 24-hour change: +0.6%
- 7-day change: -10.17%
- 30-day change: -30.27%
- 1-year change: -80.94%
Market Sentiment Indicator
Crypto Fear & Greed Index: 25 (Extreme Fear)
This reading indicates that market participants are experiencing heightened risk aversion, which typically correlates with bearish sentiment across the cryptocurrency sector.
II. Project Overview and Fundamental Distinctions
Shadow Token (SHDW)
Project Description: Decentralized storage application for web2 and web3 users, built on and optimized for Solana.
Key Characteristics:
- Blockchain: Solana (SPL token standard)
- Token Contract Address: SHDWyBxihqiCj6YekG2GUr7wqKLeLAMK1gHZck9pL6y
- Token Holders: 87,518
- Exchange Listings: 4
- Market Rank: 1,305
Project Infrastructure:
- Website: https://genesysgo.com/
- Twitter: @genesysgo
- Solana Explorer: Available
Kava (KAVA)
Project Description: A decentralized Layer 1 hub supporting cross-chain DeFi applications and services. Kava provides collateralized lending and stablecoin services for mainstream digital assets (BTC, XRP, BNB, ATOM, etc.).
Core Components:
- Kava CDP: Collateralized debt position lending platform
- HARD Protocol: Cross-chain money market
- USDX: Stablecoin issued against digital asset collateral
- KAVA Token: Platform governance and equity token
Key Characteristics:
- Blockchain: Kava Layer 1 (independent chain)
- Token Holders: 2,649,856
- Exchange Listings: 31
- Market Rank: 372
- Ecosystem Support: Backed by over 100 global companies
Project Infrastructure:
- Website: https://www.kava.io/
- Twitter: @KAVA_CHAIN
- GitHub: https://github.com/Kava-Labs/kava
- Community: Reddit (https://www.reddit.com/r/kava_platform/)
- Explorers: Mintscan and Kava-specific explorer
III. Comparative Market Analysis
Market Positioning
| Aspect | SHDW | KAVA |
|---|---|---|
| Market Cap Rank | 1,305th | 372nd |
| Total Market Cap | $7.85M | $86.15M |
| Market Cap Ratio | KAVA/SHDW = ~11x | Baseline |
| Trading Volume vs Market Cap | 0.162% | 0.167% |
| Circulating Supply Utilization | 99.998% | 100% |
Liquidity and Trading Characteristics
SHDW:
- 24-hour volume: $12,728.96
- Limited trading venues (4 exchanges)
- Lower liquidity profile
- Specialized storage sector focus
KAVA:
- 24-hour volume: $143,945.06 (~11.3x higher)
- Broader exchange availability (31 exchanges)
- Superior liquidity infrastructure
- Cross-chain DeFi focus
Supply Dynamics
SHDW:
- Circulating Supply: 169,054,256.94 tokens
- Total/Max Supply: 169,058,243 tokens
- Circulation Ratio: 99.998%
- Supply Characteristics: Fixed maximum supply (capped)
KAVA:
- Circulating Supply: 1,082,847,663 tokens
- Total/Max Supply: 1,082,847,663 tokens
- Circulation Ratio: 100%
- Supply Characteristics: Inflationary model (no maximum supply cap)
IV. Risk Considerations and Market Dynamics
Price Volatility Assessment
Both assets demonstrate significant downside pressure over extended timeframes, with SHDW experiencing steeper year-over-year losses (-92.14%) compared to KAVA (-80.94%). However, KAVA maintains superior market stability through its larger ecosystem and institutional backing.
Market Sentiment Context
The prevailing "Extreme Fear" sentiment (Index: 25) suggests that both tokens are trading in a risk-averse environment, potentially presenting valuation compression across smaller and mid-cap cryptocurrency assets.
Ecosystem Maturity Differential
KAVA benefits from:
- Established cross-chain infrastructure
- Multi-exchange liquidity
- Broader institutional recognition
- Diversified user base across DeFi services
SHDW operates within:
- Specialized storage niche
- Solana ecosystem constraints
- Limited trading venues
- Concentrated use case focus
V. Reference Links
- SHDW Market Data: https://www.gate.com/price/shadow-token-shdw
- KAVA Market Data: https://www.gate.com/price/kava-kava
- SHDW Block Explorer: https://explorer.solana.com/account/SHDWyBxihqiCj6YekG2GUr7wqKLeLAMK1gHZck9pL6y
Report Generated: December 22, 2025
Data Currency: Real-time market conditions as of report date
Disclaimer: This analysis is provided for informational purposes only and should not be construed as financial advice or investment recommendation.
Investment Value Analysis: SHDW vs KAVA
I. Executive Summary
Based on the available reference materials, this report analyzes the investment value drivers for SHDW and KAVA tokens. The provided sources offer limited but relevant information regarding KAVA as a cross-chain DeFi platform, while information on SHDW remains minimal. The analysis below focuses on documented characteristics and market factors.
II. Core Factors Influencing SHDW vs KAVA Investment Value
Tokenomics and Supply Mechanisms
-
SHDW: The reference materials do not provide sufficient tokenomics data regarding supply mechanisms, emission schedules, or deflationary models.
-
KAVA: Specific tokenomics details are not comprehensively detailed in the provided sources. However, KAVA operates as a utility token within the Kava cross-chain DeFi ecosystem.
Note: Detailed supply mechanism comparisons cannot be established without additional technical documentation.
Institutional Adoption and Market Applications
-
Machine Adoption: The materials indicate that KAVA, as a cross-chain DeFi platform, offers collateralized lending and stablecoin services. Institutional interest in DeFi infrastructure platforms has grown, though specific institutional holdings data is absent from the sources.
-
Enterprise Use Cases: KAVA serves decentralized finance functions including lending protocols and stablecoin issuance. SHDW's privacy-focused positioning suggests differentiated use cases in privacy-preserving transactions.
-
Regulatory Environment: The reference materials mention that traditional capital participation in DeFi is influenced by sovereign credit considerations, though specific jurisdictional regulatory stances toward SHDW or KAVA are not documented.
Technology Development and Ecosystem Building
-
KAVA Technical Infrastructure: KAVA positions itself as a cross-chain DeFi platform, providing multi-functional services including collateralized lending and stablecoin protocols. The ecosystem focuses on DeFi composability and interoperability.
-
SHDW Technical Focus: The materials identify SHDW as privacy-protection oriented, though specific technical upgrades or development roadmaps are not detailed in the provided sources.
-
Ecosystem Comparison: The reference materials do not provide comprehensive comparative data on DeFi, NFT, payment infrastructure, or smart contract deployments between the two tokens.
Macroeconomic Context and Market Cycles
-
Inflation Protection Characteristics: The materials note that cryptocurrency market dynamics are subject to significant price volatility. Current aggregate cryptocurrency market capitalization stands at $3.73 trillion USD, with Bitcoin comprising 59.9% ($2.23 trillion USD). Stablecoin market capitalization totals $304.6 billion USD, with USDT representing 58.88% of this segment.
-
Monetary Policy Implications: The reference materials suggest that DeFi growth drivers include declining sovereign credit confidence, though direct correlations between macroeconomic policy and individual token performance are not established in the sources.
-
Market Volatility: Both SHDW and KAVA experience significant price fluctuations, as noted in the materials. The documented market environment indicates ongoing volatility affecting investment prospects across crypto assets.
III. Risk Considerations
-
Market Volatility: The materials emphasize that both tokens experience substantial price volatility, creating uncertainty for investors.
-
Ecosystem Maturity: Cross-chain platforms like KAVA face competitive pressures and ecosystem sustainability challenges, as evidenced by broader multi-chain ecosystem challenges documented in the materials.
-
Information Limitations: Comprehensive comparative data regarding long-term performance metrics, liquidity profiles, and adoption trajectories remain insufficient in the provided sources.
IV. Conclusion
Investment decisions regarding SHDW and KAVA should prioritize verification through additional primary sources, including official technical documentation, audited financial reports, and regulatory filings. The investment value of these tokens depends on market demand, technological innovation continuity, and ecosystem development trajectories. Current market conditions are characterized by elevated volatility, warranting careful risk assessment before investment consideration.
III. 2025-2030 Price Forecast: SHDW vs KAVA
Short-term Forecast (2025)
- SHDW: Conservative $0.0255-$0.0465 | Optimistic $0.0501
- KAVA: Conservative $0.0437-$0.0795 | Optimistic $0.1017
Mid-term Forecast (2027-2028)
- SHDW could enter a consolidation phase with growth potential, expected price range $0.0446-$0.0744
- KAVA could enter an expansion phase, expected price range $0.0785-$0.1107
- Key drivers: Institutional capital inflows, ecosystem development, DeFi adoption
Long-term Forecast (2029-2030)
- SHDW: Base case $0.0389-$0.0824 | Bullish case $0.0942-$0.0924
- KAVA: Base case $0.0718-$0.1329 | Bullish case $0.1504-$0.1916
Disclaimer
This analysis is based on historical data and predictive modeling. Cryptocurrency markets are highly volatile and unpredictable. These forecasts should not be considered investment advice. Past performance does not guarantee future results. Please conduct thorough research and consult with financial advisors before making investment decisions.
SHDW:
| 年份 | 预测最高价 | 预测平均价格 | 预测最低价 | 涨跌幅 |
|---|---|---|---|---|
| 2025 | 0.0501768 | 0.04646 | 0.025553 | 0 |
| 2026 | 0.05798208 | 0.0483184 | 0.037205168 | 3 |
| 2027 | 0.074410336 | 0.05315024 | 0.0515557328 | 14 |
| 2028 | 0.07781195136 | 0.063780288 | 0.0446462016 | 36 |
| 2029 | 0.0941588391744 | 0.07079611968 | 0.038937865824 | 52 |
| 2030 | 0.092374776958464 | 0.0824774794272 | 0.043713064096416 | 77 |
KAVA:
| 年份 | 预测最高价 | 预测平均价格 | 预测最低价 | 涨跌幅 |
|---|---|---|---|---|
| 2025 | 0.1017984 | 0.07953 | 0.0437415 | 0 |
| 2026 | 0.102450546 | 0.0906642 | 0.070718076 | 13 |
| 2027 | 0.11007540522 | 0.096557373 | 0.07434917721 | 21 |
| 2028 | 0.1270791586053 | 0.10331638911 | 0.0785204557236 | 29 |
| 2029 | 0.150909083753521 | 0.11519777385765 | 0.109437885164767 | 44 |
| 2030 | 0.191596937480043 | 0.133053428805585 | 0.071848851555016 | 67 |
Comparative Investment Analysis Report: Shadow Token (SHDW) vs Kava (KAVA)
I. Historical Price Comparison and Current Market Status
Price Trajectory of SHDW and KAVA
Shadow Token (SHDW):
- All-time high: $4.00 (March 27, 2024)
- All-time low: $0.04415 (December 21, 2025)
- Price decline from ATH to ATL: approximately 98.90%
Kava (KAVA):
- All-time high: $9.12 (August 30, 2021)
- All-time low: $0.071579 (December 19, 2025)
- Price decline from ATH to ATL: approximately 92.15%
Current Market Status (December 22, 2025)
| Metric | SHDW | KAVA |
|---|---|---|
| Current Price | $0.04646 | $0.07956 |
| 24-Hour Change | +1.7% | +0.6% |
| 24-Hour Trading Volume | $12,728.96 | $143,945.06 |
| Market Capitalization | $7,854,260.78 | $86,151,360.07 |
| Circulating Supply | 169,054,256.94 | 1,082,847,663 |
| Market Dominance | 0.00024% | 0.0026% |
Multi-Timeframe Price Performance
SHDW Performance:
- 7-day change: -19.0099%
- 30-day change: -21.15%
- 1-year change: -92.14%
KAVA Performance:
- 7-day change: -10.17%
- 30-day change: -30.27%
- 1-year change: -80.94%
Market Sentiment: Crypto Fear & Greed Index at 25 (Extreme Fear) indicates heightened risk aversion across the cryptocurrency sector.
II. Project Overview and Fundamental Distinctions
Shadow Token (SHDW)
Project Description: Decentralized storage solution optimized for both web2 and web3 users, built on the Solana blockchain.
Key Characteristics:
- Blockchain: Solana (SPL token standard)
- Token Holders: 87,518
- Exchange Listings: 4
- Market Rank: 1,305th
- Supply Type: Fixed maximum supply (capped at 169,058,243 tokens)
Market Infrastructure:
- Official Website: https://genesysgo.com/
- Community: Twitter (@genesysgo)
Kava (KAVA)
Project Description: A decentralized Layer 1 hub supporting cross-chain DeFi applications and services, providing collateralized lending and stablecoin services for mainstream digital assets (BTC, XRP, BNB, ATOM, etc.).
Core Components:
- Kava CDP: Collateralized debt position lending platform
- HARD Protocol: Cross-chain money market
- USDX: Stablecoin backed by digital asset collateral
- KAVA Token: Platform governance and utility token
Key Characteristics:
- Blockchain: Kava Layer 1 (independent blockchain)
- Token Holders: 2,649,856
- Exchange Listings: 31
- Market Rank: 372nd
- Ecosystem Support: Backed by over 100 global companies
- Supply Type: Inflationary model (no maximum supply cap)
Market Infrastructure:
- Official Website: https://www.kava.io/
- Community: Twitter (@KAVA_CHAIN), Reddit (https://www.reddit.com/r/kava_platform/)
- Developer Resources: GitHub (https://github.com/Kava-Labs/kava)
III. Comparative Market Analysis
Market Positioning and Liquidity
| Aspect | SHDW | KAVA |
|---|---|---|
| Market Cap Rank | 1,305th | 372nd |
| Total Market Cap | $7.85M | $86.15M |
| Market Cap Ratio | KAVA/SHDW ≈ 11x | Baseline |
| 24-Hour Volume | $12,728.96 | $143,945.06 (~11.3x higher) |
| Volume/Market Cap Ratio | 0.162% | 0.167% |
| Exchange Availability | 4 | 31 |
Supply Dynamics
SHDW:
- Circulating Supply: 169,054,256.94 tokens
- Circulation Ratio: 99.998%
- Supply Mechanism: Fixed maximum supply
KAVA:
- Circulating Supply: 1,082,847,663 tokens
- Circulation Ratio: 100%
- Supply Mechanism: Inflationary (no maximum cap)
Ecosystem Maturity Differential
KAVA Advantages:
- Established cross-chain DeFi infrastructure
- Multi-exchange liquidity (31 exchange listings)
- Broader institutional recognition
- Diversified user base across multiple DeFi services
- Independent Layer 1 blockchain with dedicated governance
SHDW Characteristics:
- Specialized storage niche application
- Solana ecosystem constraints
- Limited trading venues (4 exchanges)
- Concentrated use case focus
- SPL token dependency
IV. Investment Strategy Comparison: SHDW vs KAVA
Long-term vs Short-term Investment Strategies
SHDW: Suitable for investors focusing on specialized decentralized storage solutions and Solana ecosystem participants seeking exposure to emerging web3 infrastructure. The fixed supply mechanism offers predictable tokenomics for long-term holders.
KAVA: Suitable for investors seeking exposure to established cross-chain DeFi infrastructure with institutional backing, collateralized lending protocols, and stablecoin services. The broader ecosystem and exchange availability provide superior liquidity for both short and medium-term trading strategies.
Risk Management and Asset Allocation
Conservative Investors:
- SHDW: 15% | KAVA: 35% (prioritizing KAVA's established infrastructure and broader institutional support)
- Remaining allocation: Stable coins and Bitcoin-correlated assets for portfolio stability
Aggressive Investors:
- SHDW: 35% | KAVA: 40% (accepting higher volatility for potential growth exposure)
- Remaining allocation: Emerging Layer 1 platforms and sector-specific exposure
Hedging Mechanisms:
- Stablecoin allocation (USDC, USDT) to manage extreme volatility
- Cross-asset diversification across different DeFi segments
- Multi-token combinations to reduce single-point failure risk
V. Potential Risk Comparison
Market Risks
SHDW:
- Extreme downside pressure (-92.14% year-over-year decline) indicates severe market rejection or liquidity challenges
- Minimal trading volume ($12,728.96 daily) creates slippage risk for larger trades
- Limited exchange accessibility constrains entry and exit flexibility
KAVA:
- Significant price deterioration (-80.94% year-over-year) reflects broader DeFi sector challenges
- However, superior trading volume and exchange availability provide better liquidity conditions
- Competitive pressure from established DeFi platforms (Aave, MakerDAO) may impact adoption rates
Technology Risks
SHDW:
- Solana network stability and validator dependency create indirect technical risk
- Storage solution scalability constraints in handling enterprise-level data volumes
- Limited developer ecosystem relative to major blockchain platforms
KAVA:
- Cross-chain bridge security requires robust auditing and consensus mechanisms
- Layer 1 platform scaling challenges as transaction volume increases
- Collateral liquidation risks during extreme market volatility
Regulatory Risks
Both tokens face potential regulatory uncertainty regarding:
- Classification as utility tokens vs securities in major jurisdictions
- DeFi lending protocol regulatory framework development
- Stablecoin governance and reserve requirements (specifically relevant to KAVA's USDX stablecoin)
Note: The materials do not provide comprehensive jurisdictional regulatory analysis; investors should conduct independent regulatory assessment.
VI. Conclusion: Which Is the Better Buy?
📌 Investment Value Summary:
SHDW Advantages:
- Fixed supply mechanism provides deflation protection and scarcity characteristics
- Solana ecosystem positioning during potential Layer 1 rebalancing
- Minimal token holder base (87,518) may support future supply concentration benefits
- Specialized decentralized storage focus addresses emerging web3 infrastructure demand
KAVA Advantages:
- Established cross-chain DeFi infrastructure with proven use cases (CDP, lending, stablecoins)
- 11x larger market capitalization provides market validation and adoption signal
- 31 exchange listings enable superior liquidity and trading flexibility
- Institutional backing (100+ companies) indicates enterprise recognition
- Broader ecosystem reach across multiple DeFi protocols
- 2.6M token holders suggest wider community adoption
- Superior daily trading volume ($143,945) reduces execution risk
✅ Investment Recommendations:
Beginner Investors: KAVA represents the more defensible entry point due to its established infrastructure, superior liquidity, and institutional backing. The 31 exchange listings facilitate simpler purchasing processes. Conservative position sizing (5-10% portfolio allocation) is recommended given current extreme fear sentiment and downside volatility.
Experienced Investors: Consider a diversified approach with portfolio allocation to KAVA as a core DeFi infrastructure position (35-40%) while maintaining selective SHDW exposure (15-25%) as a higher-risk/reward speculative allocation. Implement strict stop-loss orders at -15% below entry prices to manage volatility. Monitor ecosystem development milestones for both projects to adjust allocations accordingly.
Institutional Investors: KAVA demonstrates substantially better risk-adjusted characteristics through market capitalization scale, institutional network effects (100+ company backing), and cross-chain infrastructure maturity. The superior liquidity profile accommodates larger position sizes. SHDW exposure should be limited to dedicated web3 infrastructure allocation buckets only, if at all.
⚠️ Risk Disclaimer
Cryptocurrency markets demonstrate extreme volatility, with both SHDW and KAVA experiencing substantial price declines from all-time highs. Current market conditions are characterized by an Extreme Fear sentiment index (25), indicating heightened risk aversion. The analysis contained herein is provided for informational purposes only and does not constitute investment advice, financial recommendation, or solicitation to purchase or sell these tokens. Past performance does not guarantee future results. All cryptocurrency investments carry substantial risk of total loss. Investors must conduct independent research, understand their risk tolerance, and consult qualified financial advisors before making investment decisions.
Report Generated: December 22, 2025
Data Currency: Real-time market conditions as of report date
Reference Sources: Gate market data, official project websites, blockchain explorers
None
FAQ: SHDW vs KAVA Investment Comparison
I. Market Performance and Price Comparison
Q1: Why has SHDW experienced a more severe price decline than KAVA?
A: SHDW has declined 98.90% from its all-time high of $4.00 (March 2024) to $0.04415, compared to KAVA's 92.15% decline from $9.12 (August 2021). SHDW's steeper decline reflects several factors: (1) concentrated market capitalization ($7.85M vs KAVA's $86.15M), (2) limited trading venues (4 exchanges vs 31 for KAVA), (3) minimal daily trading volume ($12,728.96 vs $143,945.06), and (4) niche market positioning within decentralized storage. KAVA's larger institutional backing (100+ companies) and cross-chain DeFi infrastructure provide greater market resilience during downturns.
Q2: What is the current trading liquidity difference between SHDW and KAVA?
A: KAVA demonstrates substantially superior liquidity characteristics. KAVA's 24-hour trading volume of $143,945.06 is approximately 11.3 times higher than SHDW's $12,728.96. Additionally, KAVA is listed on 31 exchanges compared to SHDW's 4 exchange listings. This liquidity differential translates to lower slippage costs, faster order execution, and enhanced flexibility for entry and exit strategies. For larger trades, KAVA presents significantly reduced execution risk.
II. Project Fundamentals and Technology
Q3: What are the core functional differences between SHDW and KAVA?
A: SHDW operates as a decentralized storage solution optimized for web2 and web3 users on the Solana blockchain, addressing specific infrastructure needs for distributed data management. KAVA functions as a comprehensive cross-chain DeFi platform offering collateralized debt positions (CDP lending), cross-chain money markets (HARD Protocol), and stablecoin services (USDX) backed by mainstream digital assets (BTC, XRP, BNB, ATOM). KAVA's ecosystem spans multiple DeFi use cases, while SHDW maintains focused specialization in storage applications.
Q4: How do the supply mechanisms differ between these tokens?
A: SHDW implements a fixed maximum supply cap at 169,058,243 tokens with current circulation at 99.998%, creating inherent scarcity and deflationary characteristics. KAVA operates under an inflationary model with no maximum supply cap, currently at 100% circulation (1,082,847,663 tokens). This structural difference means SHDW holders benefit from predictable tokenomics and potential supply-driven value appreciation, while KAVA's inflationary design may be offset by platform utility growth and institutional adoption expansion.
III. Risk Assessment and Investment Suitability
Q5: Which token presents lower investment risk for conservative investors?
A: KAVA presents lower risk characteristics for conservative investors based on: (1) 11x larger market capitalization ($86.15M vs $7.85M) providing greater market validation, (2) institutional backing from 100+ companies indicating enterprise recognition, (3) superior market liquidity reducing execution risk, and (4) established cross-chain DeFi infrastructure with proven use cases. SHDW carries higher risk due to market concentration, minimal liquidity, and niche market positioning. However, both tokens exhibit extreme downside pressure, making conservative allocation sizing (5-10% portfolio allocation) essential regardless of selection.
Q6: What are the key risk factors specific to each token?
A: SHDW risks include: (1) Solana network dependency creating indirect technical vulnerability, (2) minimal trading volume causing severe slippage on larger trades, (3) limited exchange accessibility constraining market exit flexibility, and (4) storage solution scalability limitations. KAVA risks include: (1) competitive pressure from established DeFi platforms (Aave, MakerDAO), (2) cross-chain bridge security requirements demanding robust auditing, (3) collateral liquidation risks during extreme volatility, and (4) regulatory uncertainty regarding stablecoin governance and DeFi lending frameworks. Both tokens face classification uncertainty as utilities versus securities.
IV. Investment Strategy and Recommendations
Q7: What investment allocation strategy is recommended for SHDW and KAVA?
A: For conservative investors: allocate 35% KAVA, 15% SHDW, with remaining capital in stablecoins and Bitcoin-correlated assets for portfolio stability. For aggressive investors: allocate 40% KAVA, 35% SHDW, accepting higher volatility for growth potential. Implement strict stop-loss orders at -15% below entry prices to manage extreme volatility. Monitor ecosystem development milestones for both projects quarterly to adjust allocations accordingly. Maintain stablecoin hedging (USDC, USDT) to manage the Extreme Fear sentiment environment (current Fear & Greed Index: 25).
Q8: Which token represents better long-term investment value?
A: KAVA demonstrates superior long-term investment characteristics through established cross-chain DeFi infrastructure, proven collateralized lending and stablecoin services, broader institutional adoption (100+ company backing), and diversified revenue streams across multiple DeFi protocols. SHDW offers long-term potential within specialized decentralized storage infrastructure, particularly if Solana ecosystem adoption accelerates and enterprise-level storage solutions gain market traction. However, current market conditions suggest KAVA provides more defensible risk-adjusted returns for most investors, while SHDW suits higher-risk allocations within dedicated web3 infrastructure portfolio segments. Both require conviction in their respective technological ecosystems and should not represent core portfolio holdings given current market volatility and extreme fear sentiment.
Report Generated: December 22, 2025
Data Currency: Real-time market conditions as of report date
Disclaimer: This analysis is provided for informational purposes only and does not constitute investment advice or financial recommendation. Past performance does not guarantee future results. All cryptocurrency investments carry substantial risk of total loss.
Share
How to Buy Cryptocurrency


Trending Cryptocurrencies


What Are the Key Differences Between SOL and Its Competitors in 2025?

ML vs SOL: Comparing Machine Learning and Statistical Learning for Data Analysis
What Does the Meteora (MET) Whitepaper Reveal About Its Core Logic and Use Cases?

How Will Jupiter (JUP) Evolve in the Crypto Market by 2030?

2025 FRAG Price Prediction: Analyzing Market Trends and Potential Growth Factors for the Cryptocurrency

PLSPAD vs SOL: The Battle of Blockchain Platforms for Decentralized Finance

What does on-chain data analysis reveal about Render's whale movements and active addresses in 2026?

What is PEPE coin's fundamental analysis: white paper logic, use cases, and team background explained
What is tokenomics: token distribution, inflation mechanisms, and governance rights explained

What are the compliance and regulatory risks of crypto tokens in 2026: SEC guidance and KYC/AML requirements explained

How Much Will CARV Crypto Price Drop: 2.58% Decline Analysis and Support Resistance Levels