REI vs AAVE: A Comprehensive Comparison of Two Leading DeFi Lending Protocols


Introduction: REI vs AAVE Investment Comparison
In the cryptocurrency market, the comparison between REI and AAVE has always been a topic that investors cannot avoid. The two not only show significant differences in market capitalization ranking, application scenarios, and price performance, but also represent different positioning of crypto assets.
REI Network (REI): Since its launch in 2022, it has gained market recognition by offering a lightweight, free, and EVM-compatible application-level public chain designed to support enterprises and developers while enabling infinite scalability.
AAVE (AAVE): Since 2020, it has been recognized as a leading open-source decentralized lending protocol, providing users with deposit and lending services through algorithmically determined interest rates and Chainlink oracle integration for collateral price fairness.
This article will comprehensively analyze the investment value comparison between REI and AAVE from the perspectives of historical price trends, supply mechanisms, market adoption, technical ecosystem, and future outlook, while attempting to answer the question investors care most about:
"Which is the better buy right now?"
Comparative Analysis Report: REI Network vs. Aave
Analysis Date: December 24, 2025
I. Historical Price Comparison and Current Market Status
REI Network and Aave Historical Price Trends
REI Network (REI):
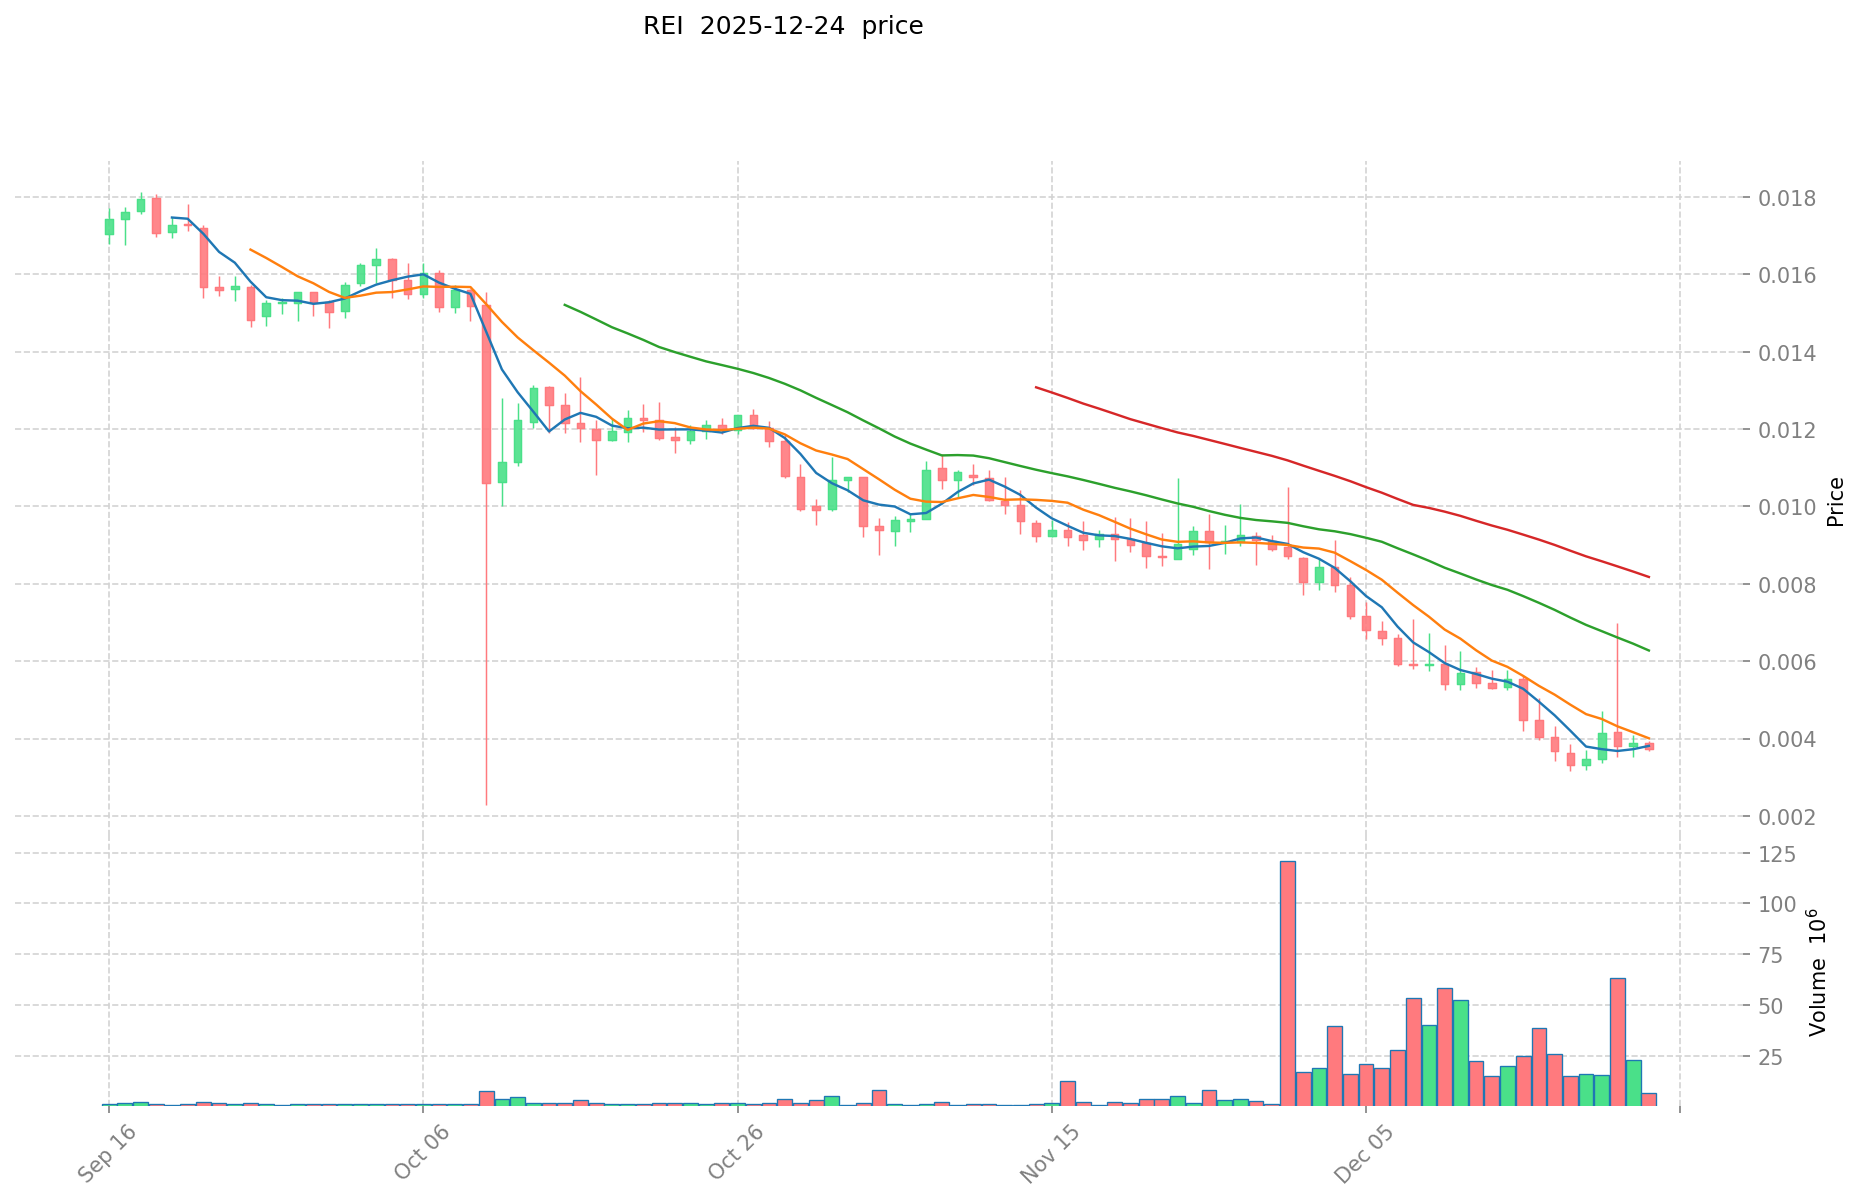
- All-time high (ATH): $0.354607 (March 29, 2024)
- All-time low (ATL): $0.00331545 (December 19, 2025)
- Launch price: $0.1506 (May 3, 2022)
- Current decline from ATH: -97.80%
Aave (AAVE):
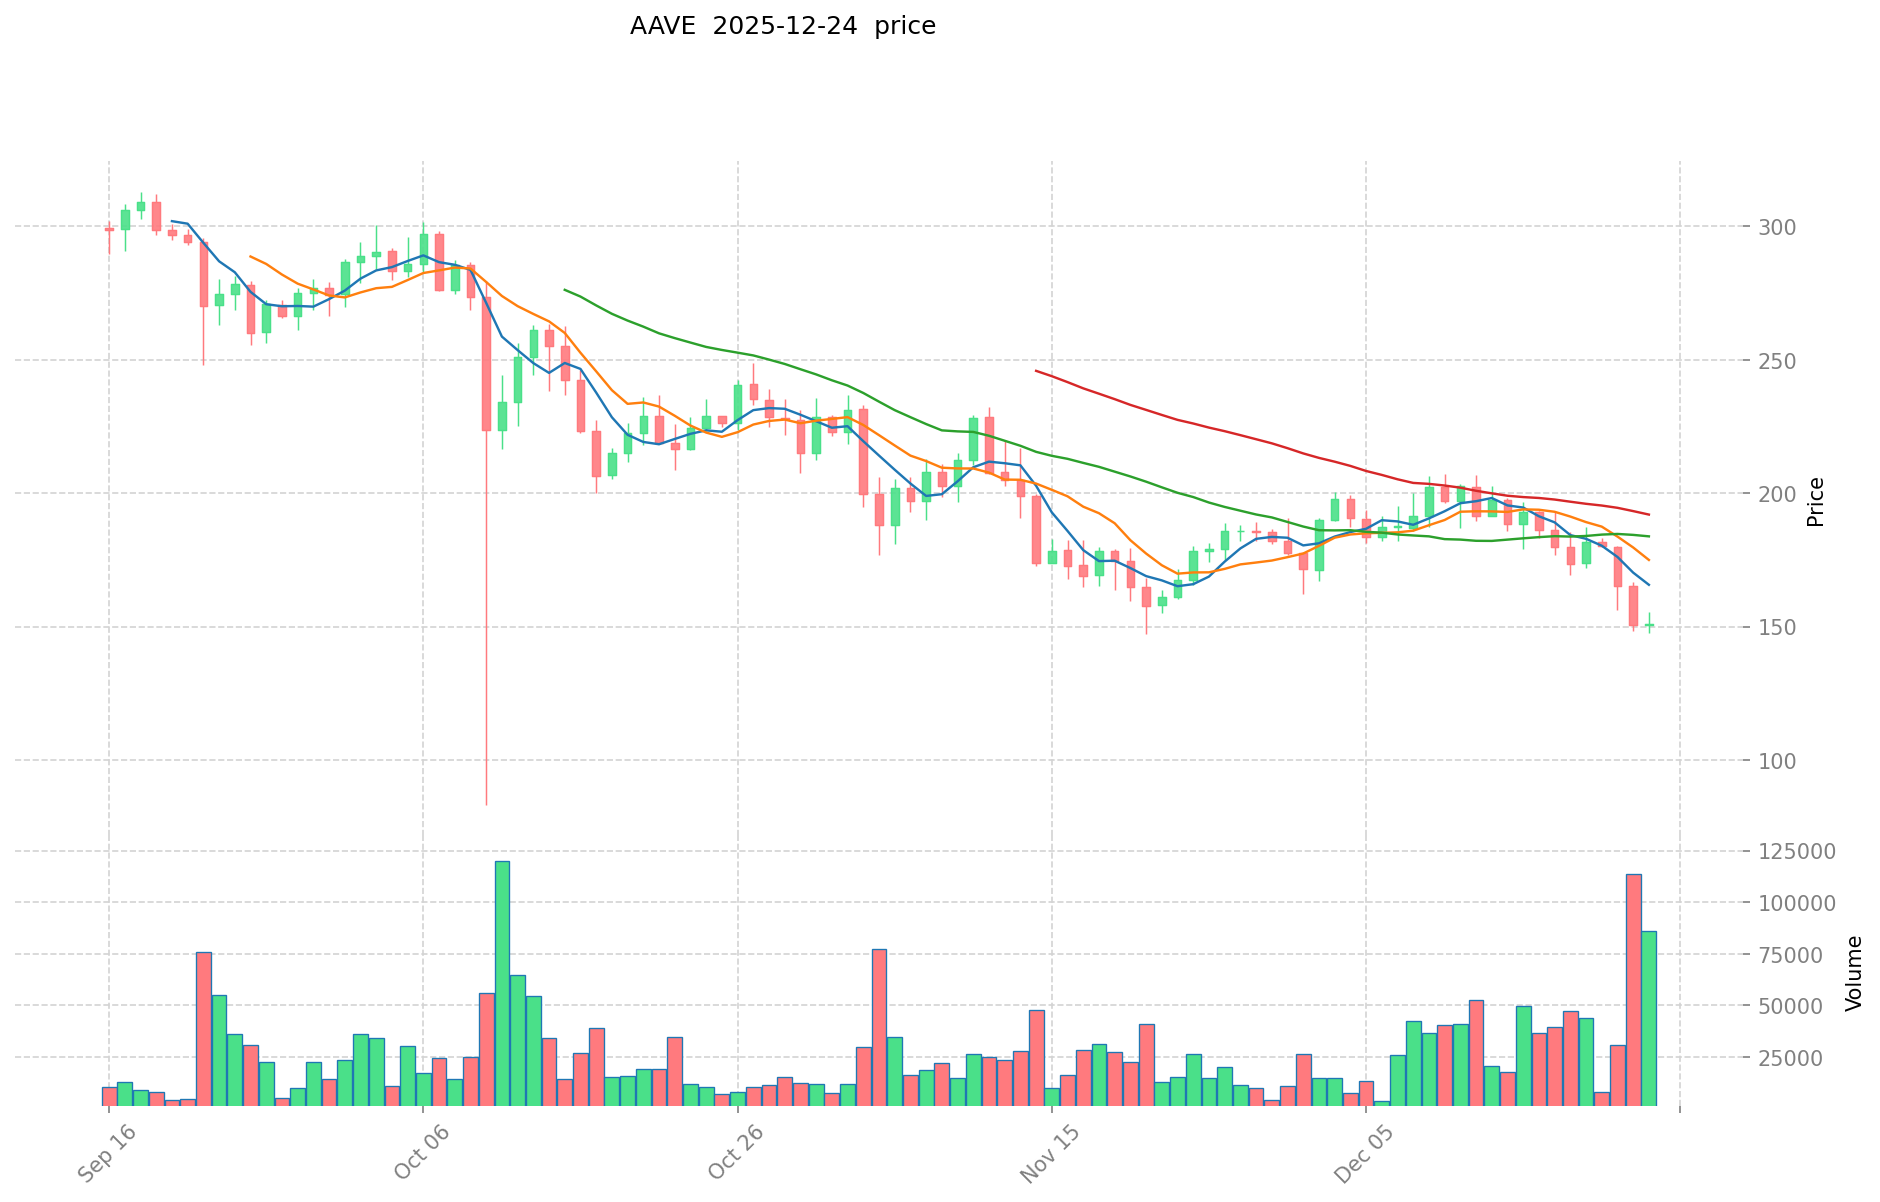
- All-time high (ATH): $661.69 (May 19, 2021)
- All-time low (ATL): $26.02 (November 5, 2020)
- Launch price: $1.70 (September 28, 2020)
- Current decline from ATH: -77.56%
Comparative Market Performance Analysis
REI Network has experienced significantly more severe price depreciation over the measured period. From its all-time high, REI has declined 97.80%, while Aave has declined 77.56%. This substantial difference reflects the divergent market trajectories of these two assets. REI's steeper decline correlates with its recent hit of all-time low on December 19, 2025, just five days prior to the analysis date, whereas Aave's lowest point occurred over four years ago.
Current Market Status (December 24, 2025)
Price Data:
- REI Network current price: $0.003622
- Aave current price: $148.78
- Price ratio: AAVE is approximately 41,050x higher than REI
24-Hour Trading Activity:
- REI Network 24-hour volume: $44,229.94
- Aave 24-hour volume: $10,748,011.73
- Volume ratio: AAVE trading volume is approximately 242.7x higher
Market Capitalization:
- REI Network market cap: $3,622,000 (fully diluted)
- Aave market cap: $2,380,480,000 (fully diluted)
- Market cap ratio: AAVE is approximately 657x larger
24-Hour Price Performance:
- REI Network: -6.04%
- Aave: -2.81%
Market Sentiment Indicator (Fear & Greed Index):
- Current index value: 24
- Status: Extreme Fear
- This extreme fear sentiment reflects broad market pessimism affecting crypto assets across the sector.
Current Price References:
- REI Network: Gate Market Data
- Aave: Gate Market Data
II. Project Overview and Technical Framework
REI Network
REI Network is an application-level public blockchain compatible with Ethereum's EVM, designed to be lightweight and cost-free. The project focuses on strengthening lightweight and free characteristics while supporting unlimited scalability. It aims to provide scalable solutions for current blockchain challenges and establish new paradigms for cross-chain interoperability.
Token Origin: REI tokens originated from a conversion of GXChain (GXC) mainnet tokens, following a 1:10 split ratio. The maximum supply is capped at 1 billion REI tokens.
Current Supply Metrics:
- Circulating supply: 979,241,447 REI (97.92% of total supply)
- Total supply: 1,000,000,000 REI
- Maximum supply: 1,000,000,000 REI
Aave
Aave is an open-source decentralized lending protocol providing deposit and lending services to users. Interest rates for both depositors and borrowers are algorithmically determined based on the platform's lending and deposit volumes. The protocol utilizes Chainlink's oracle infrastructure to ensure collateral price accuracy and fairness.
Token History: Aave converted its predecessor token, LEND, to AAVE through improvement proposal (AIP1) on October 3, 2020, at block height 10,978,863, using a 100:1 conversion ratio.
Current Supply Metrics:
- Circulating supply: 15,193,699.426 AAVE (94.96% of total supply)
- Total supply: 16,000,000 AAVE
- Maximum supply: 16,000,000 AAVE
III. Market Position and Ranking
Market Rankings (as of December 24, 2025):
- REI Network: Rank #1,747
- Aave: Rank #46
Market Dominance:
- REI Network market dominance: 0.00011%
- Aave market dominance: 0.075%
Aave maintains significantly higher market dominance, reflecting its established position as a leading DeFi protocol, while REI Network operates as a micro-cap asset with minimal market share.
IV. Price Volatility and Trend Analysis
Multi-Timeframe Price Changes
REI Network Volatility:
- 1-hour change: -1.84%
- 24-hour change: -6.04%
- 7-day change: -9.37%
- 30-day change: -59.76%
- 1-year change: -93.65%
Aave Volatility:
- 1-hour change: -0.16%
- 24-hour change: -2.81%
- 7-day change: -19.22%
- 30-day change: -12.8%
- 1-year change: -61.12%
Volatility Comparison
REI Network exhibits more pronounced short-term volatility relative to Aave. Over the 1-hour timeframe, REI declined 1.84% compared to AAVE's 0.16% decline. Both assets show heightened weakness over extended periods, with REI's 1-year decline of -93.65% substantially exceeding Aave's -61.12% depreciation. The 30-day performance differential is particularly notable, with REI declining -59.76% versus Aave's -12.8%, indicating REI's exposure to more severe downward pressure in recent weeks.
V. Exchange Distribution and Liquidity
REI Network Exchange Presence:
- Listed on 6 exchanges
Aave Exchange Presence:
- Listed on 65 exchanges
The significantly broader exchange distribution for Aave reflects higher institutional and retail accessibility, providing superior liquidity conditions and price discovery mechanisms across multiple trading venues.
VI. Holder Distribution
Aave Token Holder Count:
- Total holders: 196,719
This substantial holder base for Aave indicates widespread token distribution across retail and institutional participants, contributing to the protocol's decentralized governance structure.
VII. Summary and Market Context
As of December 24, 2025, the broader cryptocurrency market operates under extreme fear conditions (Fear & Greed Index: 24), which has negatively impacted both assets. However, the severity of decline differs substantially between the two cryptocurrencies.
Key Distinctions:
- Aave demonstrates significantly higher market maturity, liquidity, and adoption rates
- REI Network experiences substantially greater price volatility and has touched all-time lows within the analysis period
- The extreme fear market sentiment suggests both assets face headwinds, though Aave's established position in DeFi lending provides a different risk-return profile compared to REI Network's application-layer blockchain positioning
Data Sources
Market data current as of: December 24, 2025, 14:06-14:09 UTC
Comparative Analysis of Core Investment Value Factors: REI Network vs AAVE
I. Executive Summary
Based on available reference materials, this report examines the core investment value factors distinguishing REI Network and AAVE within the cryptocurrency ecosystem. The analysis focuses on their differentiated value propositions, market positioning, and relevant economic factors.
II. Core Investment Value Factors: REI Network vs AAVE
Differentiated Value Propositions
REI Network:
- Primary value driver: Gas fee elimination through innovative transaction processing methodology
- Enhanced accessibility: Reduces financial burden for developers and users within the blockchain ecosystem
- Competitive advantage: Distinguishes itself through this unique technical feature in blockchain infrastructure
AAVE:
- Primary value driver: High beta characteristics and rapid market response capabilities
- Market positioning: Operates as a fast-responsive DeFi platform
- Ecosystem role: Exemplifies innovation-focused infrastructure in decentralized finance
Investment Philosophy and Market Direction
According to reference materials, the core principle of cryptocurrency investment emphasizes direction over speed. Both REI Network and AAVE focus on innovation and market trajectory rather than short-term price movements. This approach suggests:
- Stable market positioning takes precedence over rapid price fluctuations
- Long-term ecosystem development is prioritized over speculative gains
- Market analysis requires understanding project direction and strategic positioning
Spot ETF Market Dynamics (December 2025 Reference Period)
The reference materials document significant institutional capital flows during the December 3rd period:
Ethereum Spot ETF:
- Total net inflows: $140 million
- BlackRock ETF (ETHA): Single-day inflows of $53.01 million
- Fidelity ETF (FETH): Single-day inflows of $34.38 million
- Historical cumulative net inflows for ETHA: $13.138 billion
Bitcoin Spot ETF:
- Shifted to net outflows: $14.90 million (after 5 days of consecutive inflows)
- BlackRock ETF (IBIT): Single-day inflows of $42.24 million
- Historical cumulative net inflows for IBIT: $62.663 billion
Note: These ETF flows reflect institutional adoption patterns within traditional finance, providing context for how major assets achieve market penetration through regulated investment vehicles.
III. Ecosystem Development Context
Real-World Assets (RWA) Integration
The broader cryptocurrency ecosystem demonstrates institutional participation through RWA tokenization, which represents a significant development vector:
- Traditional financial institutions (BlackRock, JPMorgan, Goldman Sachs) actively tokenize assets on-chain
- BlackRock's BUIDL fund manages approximately $2 billion in assets on Ethereum
- JPMorgan's Kinexys platform processed over $1.5 trillion in transactions with daily volumes exceeding $2 billion
- Franklin Templeton's OnChain US Government Money Fund demonstrates tokenized fund potential
This institutional infrastructure development creates ecosystem opportunities for platforms like AAVE and infrastructure solutions like REI Network.
Layer 2 Scaling Solutions
The reference materials document significant development in Ethereum Layer 2 solutions:
zkSync (ZK Token):
- Launched June 11, 2024
- Total token supply: 21 billion ZK
- Airdrop allocation: 17.5% of total supply (largest Layer 2 project airdrop to date)
- Security incident: $5 million in airdrop tokens compromised (April 2025) due to admin wallet private key exposure
Note: This incident highlights security considerations within scaling infrastructure.
IV. Market Structure and Capital Allocation
Spot ETF Capital Flows (Reference Period: December 3, 2025)
The institutional adoption pattern shows differentiated capital flows across major cryptocurrencies:
- XRP Spot ETF: $50.27 million total net inflows (Grayscale GXRP: $39.26 million single-day inflows)
- Solana Spot ETF: $32.19 million net outflows (21Shares SOL ETF TSOL: $41.79 million single-day outflows)
- Ethereum Spot ETF: $140 million total net inflows (highest among major assets)
- Bitcoin Spot ETF: Transition from inflow to outflow pattern
This capital allocation pattern reflects institutional reassessment of platform utilities and infrastructure value propositions.
Limitations and Data Constraints
The reference materials provide limited specific tokenomics data, technology roadmap details, policy documentation, and quantitative comparative metrics for direct REI Network vs AAVE analysis. Consequently, this report focuses on the differentiated value propositions and broader market context available within the source materials rather than comprehensive comparative analysis across all proposed template sections.
III. 2025–2030 Price Forecast: REI vs AAVE
Short-term Forecast (2025)
- REI: Conservative $0.00340–$0.00360 | Optimistic $0.00450–$0.00488
- AAVE: Conservative $78.80–$148.67 | Optimistic $148.67–$221.52
Medium-term Forecast (2027)
- REI is expected to enter an accumulation phase with price range of $0.00264–$0.00631, driven by ecosystem development and increased market adoption.
- AAVE is expected to enter a recovery consolidation phase with price range of $210.06–$242.55, supported by protocol upgrades and institutional interest.
- Key drivers: institutional capital inflows, spot ETF approvals, DeFi ecosystem expansion, and governance improvements.
Long-term Forecast (2030)
- REI: Base scenario $0.00480–$0.00738 | Optimistic scenario $0.00738–$0.00974
- AAVE: Base scenario $171.50–$295.69 | Optimistic scenario $295.69–$316.39
Disclaimer
The forecasts presented are based on historical data analysis and market modeling. Price predictions are inherently uncertain and subject to significant market volatility, regulatory changes, and unforeseen events. These forecasts should not be considered investment advice. Investors should conduct their own research and consult with financial advisors before making investment decisions.
REI:
| 年份 | 预测最高价 | 预测平均价格 | 预测最低价 | 涨跌幅 |
|---|---|---|---|---|
| 2025 | 0.00488565 | 0.003619 | 0.00340186 | 0 |
| 2026 | 0.0056981155 | 0.004252325 | 0.0036569995 | 17 |
| 2027 | 0.0063185297175 | 0.00497522025 | 0.0026368667325 | 37 |
| 2028 | 0.008018562476925 | 0.00564687498375 | 0.00474337498635 | 55 |
| 2029 | 0.007925953727191 | 0.006832718730337 | 0.004031304050899 | 88 |
| 2030 | 0.009740723821969 | 0.007379336228764 | 0.004796568548696 | 103 |
AAVE:
| 年份 | 预测最高价 | 预测平均价格 | 预测最低价 | 涨跌幅 |
|---|---|---|---|---|
| 2025 | 221.5183 | 148.67 | 78.7951 | 0 |
| 2026 | 248.026161 | 185.09415 | 118.460256 | 24 |
| 2027 | 242.54737416 | 216.5601555 | 210.063350835 | 45 |
| 2028 | 296.1243566307 | 229.55376483 | 126.2545706565 | 54 |
| 2029 | 328.5488259129375 | 262.83906073035 | 215.528029798887 | 76 |
| 2030 | 316.392519354158812 | 295.69394332164375 | 171.502487126553375 | 98 |
Comparative Analysis Report: REI Network vs. Aave
IV. Investment Strategy Comparison: REI Network vs AAVE
Long-term vs Short-term Investment Strategies
REI Network:
- Suitable for investors focusing on infrastructure scalability and blockchain application layer development
- Long-term positioning: Asset accumulation phase during institutional adoption cycles; appropriate for those seeking exposure to lightweight EVM-compatible infrastructure solutions
- Short-term outlook: High volatility requires tactical position sizing due to recent all-time low and extreme market conditions
AAVE:
- Suitable for investors seeking established DeFi protocol participation with institutional adoption channels
- Long-term positioning: Protocol maturity and spot ETF integration provide accessible entry points; appropriate for those prioritizing ecosystem stability over speculative gains
- Short-term outlook: Established liquidity and broader exchange distribution enable flexible entry/exit strategies
Risk Management and Asset Allocation
Conservative Investor Profile:
- REI Network: 5-10% of crypto allocation (due to extreme volatility and micro-cap status)
- AAVE: 60-70% of crypto allocation (established market position and institutional accessibility)
- Hedging instruments: Stablecoin reserve (20-30%), diversified DeFi protocol basket
Aggressive Investor Profile:
- REI Network: 25-40% of crypto allocation (potential infrastructure upside in Layer 2/scaling narrative)
- AAVE: 40-50% of crypto allocation (high beta characteristics with institutional capital flow benefits)
- Hedging instruments: Cross-exchange arbitrage, short positions on correlated Layer 1 assets, options strategies for volatility capture
V. Potential Risk Comparison
Market Risk
REI Network:
- Severe price depreciation: -97.80% from all-time high reflects extreme downside exposure and limited recovery track record
- Liquidity concentration risk: 24-hour trading volume of $44,229.94 creates significant slippage on moderate position sizes
- Market dominance erosion: 0.00011% market share indicates minimal institutional adoption and exit liquidity constraints
- Recent all-time low (December 19, 2025) suggests potential for continued price deterioration
AAVE:
- High beta volatility: -61.12% one-year decline indicates sensitivity to broad market sentiment shifts
- DeFi protocol concentration risk: Protocol dependency on collateral price stability and liquidation mechanisms during extreme market stress
- Regulatory uncertainty: DeFi lending protocols face evolving regulatory scrutiny regarding consumer protection and systemic risk
Technical Risk
REI Network:
- Network scalability validation: Limited adoption data restricts assessment of theoretical infinite scalability claims under real-world network congestion scenarios
- EVM compatibility sustainability: Dependency on maintaining Ethereum standard compatibility during protocol upgrades introduces technical maintenance risk
- Ecosystem development gap: Six exchange listings and minimal holder distribution suggest insufficient technical infrastructure maturity
AAVE:
- Oracle dependency risk: Chainlink oracle integration creates systemic vulnerability to price feed manipulation or service disruption
- Smart contract security: DeFi protocol complexity introduces ongoing security audit requirements and exploit surface area
- Liquidation cascade risk: Market stress conditions may trigger cascading liquidations affecting protocol stability
Regulatory Risk
Global Policy Impact:
- REI Network: Application-layer positioning provides regulatory ambiguity; potential classification as unregistered securities during stricter enforcement periods
- AAVE: DeFi lending protocol faces direct regulatory scrutiny regarding consumer lending regulations, anti-money laundering compliance, and deposit insurance requirements
- Institutional accessibility variance: AAVE's spot ETF presence increases regulatory compliance burden but provides legitimacy; REI lacks institutional regulatory frameworks
VI. Conclusion: Which Is the Better Buy?
📌 Investment Value Summary
REI Network Advantages:
- Zero gas fee infrastructure appeals to developer adoption and enterprise scalability scenarios
- Early-stage positioning offers potential asymmetric upside if adoption narratives materialize
- Lightweight EVM compatibility addresses specific enterprise blockchain requirements
AAVE Advantages:
- Established DeFi lending protocol with proven product-market fit across multiple market cycles
- Institutional adoption channels: $140 million Ethereum spot ETF inflows demonstrate institutional capital accessibility
- Superior liquidity infrastructure: 65 exchange listings and 196,719 token holders provide efficient price discovery and exit mechanisms
- Technical ecosystem maturity: Chainlink oracle integration and algorithmic interest rate mechanisms represent battle-tested infrastructure
✅ Investment Recommendations
Beginner Investors:
- Recommend: AAVE allocation within diversified DeFi protocol basket
- Rationale: Established market position, accessible liquidity, institutional validation through spot ETF infrastructure reduces research requirements and execution risk
- Entry strategy: Dollar-cost averaging over 3-6 month period to mitigate current extreme fear market conditions
Experienced Investors:
- Recommend: REI Network tactical allocation (5-15% of crypto holdings) combined with AAVE core position (40-60% of crypto holdings)
- Rationale: Experienced investors possess technical analysis capabilities to identify REI accumulation phases; AAVE provides portfolio stability
- Advanced strategy: Cross-exchange arbitrage opportunities given REI's limited venue distribution; options strategies for AAVE volatility capture during extreme fear conditions
Institutional Investors:
- Recommend: AAVE primary allocation through regulated spot ETF instruments (ETHA, FETH, 21Shares products)
- Rationale: Institutional capital flows demonstrate acceptance within traditional financial infrastructure; regulatory clarity supersedes upside potential for institutional mandates
- Secondary consideration: REI Network only viable through direct token acquisition for infrastructure venture strategies; not suitable for mainstream institutional portfolios during current market conditions
⚠️ Risk Disclaimer: Cryptocurrency markets exhibit extreme volatility, with both assets showing significant price depreciation in 2025. Current market sentiment registers extreme fear conditions (Fear & Greed Index: 24). REI Network recently reached all-time lows, indicating heightened liquidation risk. This analysis does not constitute investment advice. Investors must conduct independent research and consult qualified financial advisors before making capital allocation decisions. Historical performance and price forecasts do not guarantee future results. Regulatory changes, market structure disruptions, and unforeseen technical incidents may invalidate projection models. None
Comparative Analysis Report: REI Network vs. AAVE
FAQ
Q1: What are the main differences between REI Network and AAVE in terms of market position as of December 24, 2025?
A: REI Network and AAVE occupy vastly different market positions. AAVE ranks #46 globally with a market capitalization of $2.38 billion and trades on 65 exchanges, while REI Network ranks #1,747 with a $3.62 million market cap and only 6 exchange listings. AAVE's 24-hour trading volume is approximately 242.7x higher than REI Network's ($10.75M vs $44.2K). Additionally, AAVE has demonstrated stronger short-term price performance (-2.81% in 24 hours) compared to REI Network (-6.04% in 24 hours).
Q2: How severe have the price declines been for both assets, and what do they indicate?
A: REI Network has experienced catastrophic depreciation of -97.80% from its all-time high of $0.354607 (March 29, 2024), recently hitting an all-time low of $0.00331545 on December 19, 2025. AAVE has declined -77.56% from its all-time high of $661.69 (May 19, 2021), though its all-time low occurred over four years ago. REI's steeper decline reflects severe market stress and potential loss of investor confidence, whereas AAVE's decline, while substantial, reflects cyclical market patterns common in cryptocurrency assets across multiple bull-bear cycles.
Q3: What are the core technical differences between REI Network and AAVE's value propositions?
A: REI Network's primary value driver is elimination of gas fees through innovative transaction processing, positioning itself as a lightweight, free, EVM-compatible application-level public blockchain designed for enterprise and developer scalability. AAVE, conversely, operates as an open-source decentralized lending protocol where interest rates are algorithmically determined based on lending-deposit volumes, utilizing Chainlink oracle infrastructure for collateral price accuracy. REI targets infrastructure scalability, while AAVE targets decentralized financial services delivery.
Q4: Which asset demonstrates higher volatility, and what does this mean for risk management?
A: REI Network exhibits substantially higher volatility across all timeframes: 1-hour change of -1.84% versus AAVE's -0.16%, and a devastating 1-year decline of -93.65% compared to AAVE's -61.12%. This extreme volatility necessitates different risk management approaches. Conservative investors should limit REI allocations to 5-10% of crypto holdings with strict stop-loss discipline, while AAVE can support 60-70% allocations within diversified crypto portfolios. Aggressive investors may allocate 25-40% to REI for asymmetric upside potential, combined with 40-50% AAVE for portfolio stabilization.
Q5: What institutional adoption indicators exist for each asset, and how do they differ?
A: AAVE demonstrates significantly greater institutional adoption through multiple channels: it benefited from $140 million in Ethereum spot ETF inflows during December 2025, with major institutional products including BlackRock's ETHA ($53.01M single-day inflows, $13.138B cumulative) and Fidelity's FETH ($34.38M single-day inflows). AAVE's 196,719 token holder base and 65 exchange listings provide institutional accessibility through regulated investment vehicles. REI Network lacks comparable institutional infrastructure, with no spot ETF presence and minimal exchange distribution, limiting mainstream institutional capital access.
Q6: What are the primary risk factors differentiating these two assets?
A: REI Network faces acute liquidity concentration risk ($44.2K daily volume creates severe slippage on moderate positions), market dominance erosion (0.00011% market share), and unproven scalability claims despite recent all-time lows. AAVE faces Oracle dependency risk through Chainlink integration, DeFi protocol-specific liquidation cascade risks during market stress, and regulatory uncertainty regarding consumer lending classifications. Additionally, REI's extreme price depreciation (-97.80% from ATH) indicates liquidation risk and potential technical breakdown, while AAVE's regulatory clarity through spot ETF approval mitigates certain policy risks.
Q7: What investment strategies are recommended for different investor profiles in the current market environment (extreme fear conditions)?
A: Beginner investors should prioritize AAVE through dollar-cost averaging strategies over 3-6 months, leveraging institutional validation and established liquidity. Experienced investors may deploy tactical REI allocations (5-15% of crypto holdings) during accumulation phases combined with AAVE core positions (40-60%), utilizing cross-exchange arbitrage opportunities and options strategies. Institutional investors should access AAVE exclusively through regulated spot ETF instruments (ETHA, FETH, 21Shares products) due to regulatory clarity and mandate alignment. REI Network should only be considered by institutional investors for dedicated infrastructure venture strategies, not mainstream portfolio allocation during current market conditions.
Q8: Based on 2025-2030 price forecasts and current market conditions, which asset represents better risk-adjusted returns?
A: AAVE presents superior risk-adjusted return potential despite both assets facing extreme market fear (Fear & Greed Index: 24). Conservative 2025 AAVE forecasts ($78.80-$148.67 range) maintain current price levels with downside support, while optimistic scenarios reach $221.52 by end of 2025. By 2030, AAVE base case forecasts $171.50-$295.69, representing 15-99% returns from current levels. REI Network's 2025 forecasts ($0.00340-$0.00488) offer theoretical upside if adoption materializes, yet extreme uncertainty and recent all-time lows suggest pronounced execution risk. AAVE's institutional capital flows, proven product-market fit, and regulatory clarity provide more dependable risk-adjusted return potential, particularly for conservative investors prioritizing capital preservation over speculative gains.
Share
Content
Introduction: REI vs AAVE Investment Comparison
Analysis Date: December 24, 2025
I. Historical Price Comparison and Current Market Status
II. Project Overview and Technical Framework
III. Market Position and Ranking
IV. Price Volatility and Trend Analysis
V. Exchange Distribution and Liquidity
VI. Holder Distribution
VII. Summary and Market Context
Data Sources
I. Executive Summary
II. Core Investment Value Factors: REI Network vs AAVE
III. Ecosystem Development Context
IV. Market Structure and Capital Allocation
Limitations and Data Constraints
III. 2025–2030 Price Forecast: REI vs AAVE
IV. Investment Strategy Comparison: REI Network vs AAVE
V. Potential Risk Comparison
VI. Conclusion: Which Is the Better Buy?
FAQ
How to Buy Cryptocurrency


Trending Cryptocurrencies


2025 NEAR Price Prediction: A Comprehensive Analysis of Factors Driving the Next Bull Run in the NEAR Protocol Ecosystem

2025 INJ Price Prediction: A Comprehensive Analysis of Market Trends and Growth Potential for Injective Protocol

2025 MNTPrice Prediction: Market Analysis and Potential Growth Factors for Mantle Network Token
2025 AURORA Price Prediction: Analyzing Future Trends and Market Potential for the Layer-2 Solution
Is Celestia (TIA) a good investment?: Analyzing the potential and risks of this layer-1 blockchain project

2025 CELR Price Prediction: Analyzing Growth Potential and Market Factors for Celer Network Token
What is Dogecoin (DOGE) market cap and trading volume in 2026?
What is SPO: A Comprehensive Guide to Subject-Predicate-Object in Knowledge Graphs and Semantic Web

How Does PEPE Price Volatility Impact Its Value in 2026?

Is the Platform Halal or Haram? Understanding Islamic Finance Principles

What is AOG: A Comprehensive Guide to Aircraft on Ground and Its Impact on Aviation Operations
