OAX vs OP: Comparing Layer 2 Scaling Solutions for Ethereum

2025-10-30 03:12:08
Altcoins
Crypto Ecosystem
DeFi
Ethereum
Layer 2
Article Rating : 4.8
half-star
0 ratings
This article provides a detailed comparison between OAX and OP, two prominent Layer 2 scaling solutions for Ethereum. It analyzes their historical price trends, current market status, supply mechanisms, and potential risks, aiming to determine "Which is the better buy right now?" Suitable for investors looking for insights into decentralized exchange technology and Ethereum's scalability solutions, the article suggests investment strategies and risk management options. With key information on price predictions and institutional adoption, it offers a comprehensive overview for informed decision-making. For real-time prices, visit Gate for OAX and OP updates.
OAX vs OP: Comparing Layer 2 Scaling Solutions for Ethereum

Introduction: Investment Comparison of OAX vs OP

In the cryptocurrency market, the comparison between OAX vs OP has always been a topic that investors can't avoid. The two not only have significant differences in market cap ranking, application scenarios, and price performance, but also represent different crypto asset positioning.

OpenANX (OAX): Since its launch in 2017, it has gained market recognition for its open-source and decentralized trading platform.

Optimism (OP): Introduced in 2022, it has been hailed as a low-cost, lightning-fast Ethereum Layer 2 blockchain solution.

This article will comprehensively analyze the investment value comparison between OAX vs OP, focusing on historical price trends, supply mechanisms, institutional adoption, technical ecosystems, and future predictions, and attempt to answer the question that investors are most concerned about:

"Which is the better buy right now?"

I. Price History Comparison and Current Market Status

  • 2018: OAX reached its all-time high of $2.34 on January 7, 2018.
  • 2024: OP hit its all-time high of $4.84 on March 6, 2024.
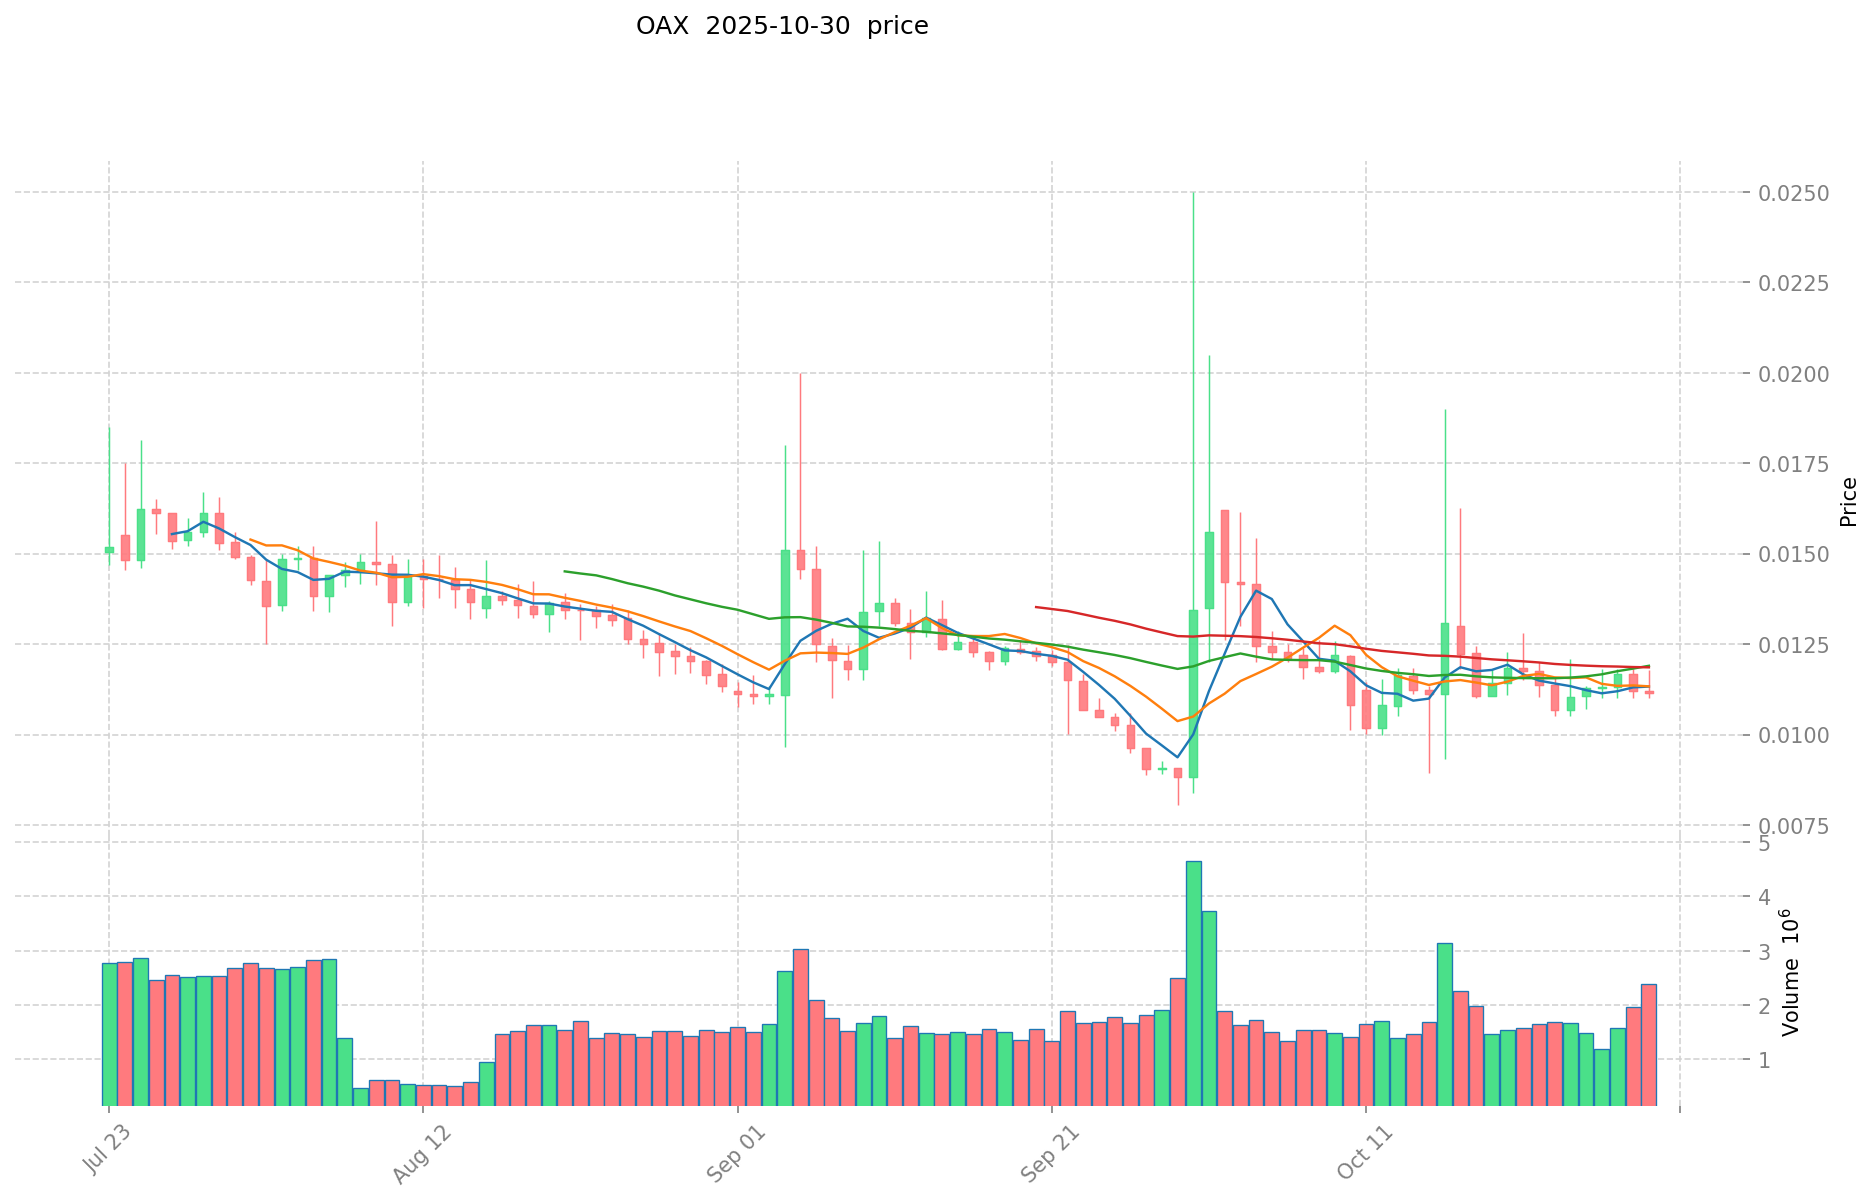
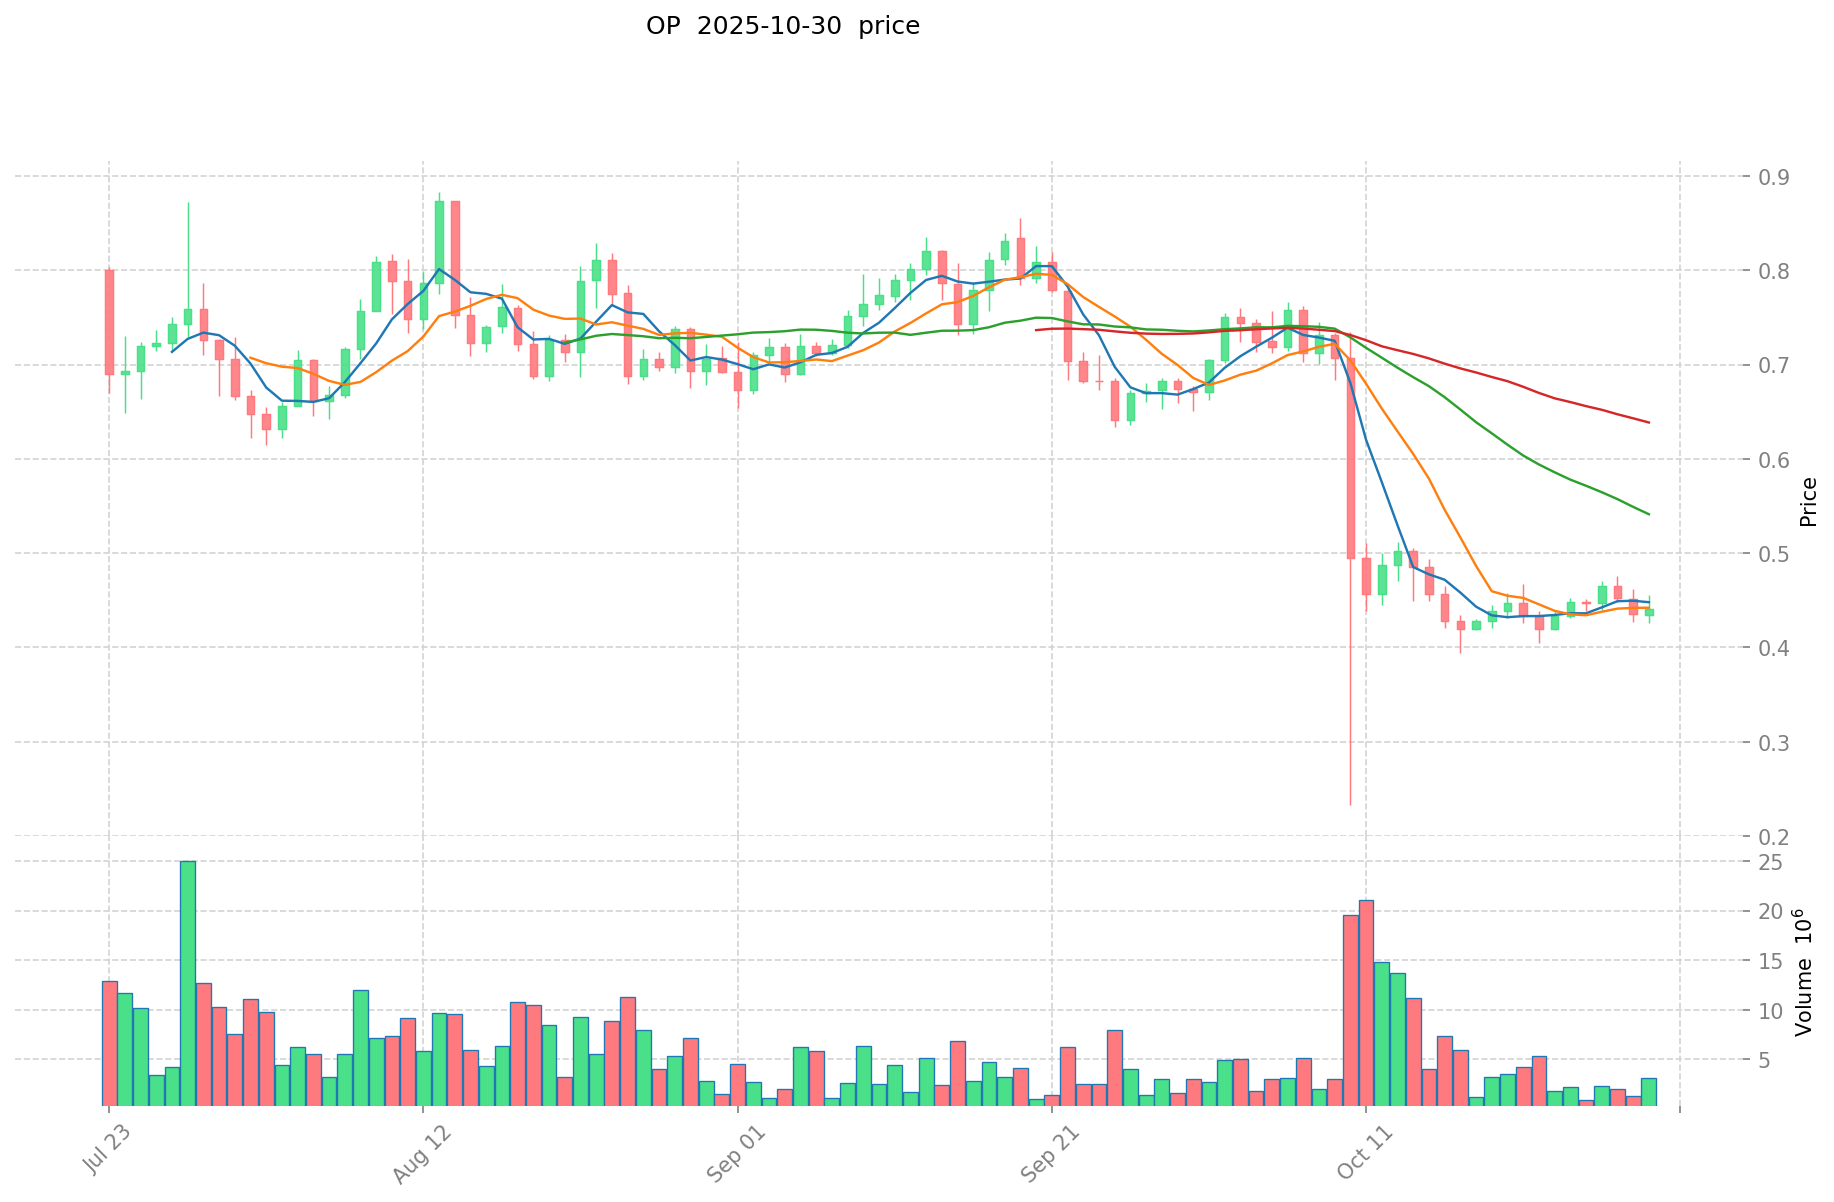
  • Comparative analysis: In the recent market cycle, OAX dropped from its all-time high of $2.34 to a low of $0.00804059, while OP fell from $4.84 to $0.34081.

Current Market Situation (2025-10-30)

  • OAX current price: $0.011216
  • OP current price: $0.4449
  • 24-hour trading volume: OAX $27,136.21 vs OP $1,406,552.01
  • Market Sentiment Index (Fear & Greed Index): 34 (Fear)

Click to view real-time prices:

price_image1 price_image2

II. Core Factors Affecting OAX vs OP Investment Value

Supply Mechanism Comparison (Tokenomics)

  • OAX: Functions as the core driver of the platform, supporting the ecosystem's operation and development while granting token holders voting rights in platform governance.
  • OP: Limited information available regarding its specific supply mechanism.
  • 📌 Historical Pattern: The governance utility of OAX tokens may create value through increased platform adoption and user participation in decision-making processes.

Institutional Adoption and Market Applications

  • Institutional Holdings: Limited information available on institutional preference between these assets.
  • Enterprise Adoption: OAX focuses on exploring the future of decentralized exchanges, addressing four key weaknesses: speed, scalability, interoperability, and trust.
  • Regulatory Attitudes: Limited information available on specific regulatory positions toward these assets across different countries.

Technical Development and Ecosystem Building

  • OAX Technical Development: OpenANX Foundation aims to explore the future of decentralized exchanges and solve their four main shortcomings.
  • OP Technical Development: Limited information available on its specific technical roadmap.
  • Ecosystem Comparison: OAX is positioned as part of a platform ecosystem that supports decentralized operations and development, though specific DeFi, NFT, and payment applications are not detailed in the available information.

Macroeconomic Factors and Market Cycles

  • Performance in Inflationary Environments: Limited information available on comparative inflation-resistant properties.
  • Macroeconomic Monetary Policy: Limited information available on how interest rates and dollar index specifically affect these assets.
  • Geopolitical Factors: Limited information available on how cross-border transaction demands affect these specific assets.

III. 2025-2030 Price Prediction: OAX vs OP

Short-term Prediction (2025)

  • OAX: Conservative $0.0091922 - $0.01121 | Optimistic $0.01121 - $0.0150214
  • OP: Conservative $0.381582 - $0.4437 | Optimistic $0.4437 - $0.643365

Mid-term Prediction (2027)

  • OAX may enter a growth phase, with prices expected in the range of $0.00992071548 - $0.02146777776
  • OP may enter a bullish market, with prices expected in the range of $0.57397032 - $0.8788920525
  • Key drivers: Institutional capital inflow, ETF, ecosystem development

Long-term Prediction (2030)

  • OAX: Base scenario $0.024480975530232 - $0.029132360880976 | Optimistic scenario $0.029132360880976+
  • OP: Base scenario $0.926216578005468 - $1.092935562046453 | Optimistic scenario $1.092935562046453+

View detailed price predictions for OAX and OP

Disclaimer: This analysis is for informational purposes only and should not be considered as financial advice. Cryptocurrency markets are highly volatile and unpredictable. Always conduct your own research before making any investment decisions.

OAX:

年份 预测最高价 预测平均价格 预测最低价 涨跌幅
2025 0.0150214 0.01121 0.0091922 0
2026 0.019411236 0.0131157 0.00786942 16
2027 0.02146777776 0.016263468 0.00992071548 45
2028 0.0275438094048 0.01886562288 0.0116966861856 68
2029 0.025757234918064 0.0232047161424 0.01508306549256 106
2030 0.029132360880976 0.024480975530232 0.021788068221906 118

OP:

年份 预测最高价 预测平均价格 预测最低价 涨跌幅
2025 0.643365 0.4437 0.381582 0
2026 0.652239 0.5435325 0.353296125 21
2027 0.8788920525 0.59788575 0.57397032 34
2028 0.9229861265625 0.73838890125 0.3765783396375 65
2029 1.021745642104687 0.83068751390625 0.490105633204687 86
2030 1.092935562046453 0.926216578005468 0.620565107263664 107

IV. Investment Strategy Comparison: OAX vs OP

Long-term vs Short-term Investment Strategy

  • OAX: Suitable for investors focused on decentralized exchange ecosystems and governance potential
  • OP: Suitable for investors interested in Layer 2 scaling solutions and Ethereum ecosystem growth

Risk Management and Asset Allocation

  • Conservative investors: OAX: 20% vs OP: 80%
  • Aggressive investors: OAX: 40% vs OP: 60%
  • Hedging tools: Stablecoin allocation, options, cross-currency portfolios

V. Potential Risk Comparison

Market Risk

  • OAX: Limited liquidity and higher volatility due to lower market cap
  • OP: Exposure to overall Ethereum ecosystem performance

Technical Risk

  • OAX: Scalability, network stability
  • OP: Reliance on Ethereum's base layer, potential Layer 2 vulnerabilities

Regulatory Risk

  • Global regulatory policies may impact both assets differently, with potential scrutiny on decentralized exchanges affecting OAX

VI. Conclusion: Which Is the Better Buy?

📌 Investment Value Summary:

  • OAX advantages: Focus on decentralized exchange technology, governance utility
  • OP advantages: Ethereum Layer 2 scaling solution, potential for wider adoption

✅ Investment Advice:

  • New investors: Consider a small allocation to OP as part of a diversified crypto portfolio
  • Experienced investors: Balance between OAX and OP based on risk tolerance and belief in respective ecosystems
  • Institutional investors: Focus on OP for its potential role in Ethereum scaling and broader market adoption

⚠️ Risk Warning: Cryptocurrency markets are highly volatile. This article does not constitute investment advice. None

FAQ

Q1: What are the main differences between OAX and OP? A: OAX focuses on decentralized exchange technology and governance, while OP is an Ethereum Layer 2 scaling solution. OAX has been around since 2017, while OP was introduced in 2022. Their market caps, trading volumes, and price performances also differ significantly.

Q2: Which asset has shown better price performance historically? A: Based on the available data, OP has shown better price performance. It reached an all-time high of $4.84 in March 2024, while OAX's all-time high was $2.34 in January 2018. However, both have experienced significant price drops from their peaks.

Q3: How do the current market situations of OAX and OP compare? A: As of 2025-10-30, OAX is priced at $0.011216, while OP is at $0.4449. OP has a significantly higher 24-hour trading volume of $1,406,552.01 compared to OAX's $27,136.21, indicating higher liquidity and market activity for OP.

Q4: What are the key factors affecting the investment value of OAX and OP? A: Key factors include their supply mechanisms, institutional adoption, technical development, ecosystem building, and macroeconomic factors. OAX's value is driven by its role in platform governance, while OP's value is tied to its function as an Ethereum scaling solution.

Q5: What are the price predictions for OAX and OP in the coming years? A: By 2030, OAX is predicted to reach a base scenario of $0.024480975530232 - $0.029132360880976, while OP is expected to reach $0.926216578005468 - $1.092935562046453. These predictions suggest potentially higher growth for OP, but it's important to note that cryptocurrency markets are highly unpredictable.

Q6: How should investors approach OAX and OP in terms of risk management? A: For conservative investors, a suggested allocation could be 20% OAX and 80% OP. For aggressive investors, it could be 40% OAX and 60% OP. Hedging tools such as stablecoin allocation, options, and cross-currency portfolios should be considered to manage risk.

Q7: Which asset might be better for different types of investors? A: New investors might consider a small allocation to OP as part of a diversified crypto portfolio. Experienced investors could balance between OAX and OP based on their risk tolerance and belief in respective ecosystems. Institutional investors might focus on OP for its potential role in Ethereum scaling and broader market adoption.

* The information is not intended to be and does not constitute financial advice or any other recommendation of any sort offered or endorsed by Gate.
Related Articles
CORL vs OP: The Battle for Algorithmic Trading Supremacy in Cryptocurrency Markets

CORL vs OP: The Battle for Algorithmic Trading Supremacy in Cryptocurrency Markets

The article "CORL vs OP: The Battle for Algorithmic Trading Supremacy in Cryptocurrency Markets" offers an in-depth comparison between Coral Finance (CORL) and Optimism (OP) in terms of investment value. It addresses critical factors such as price history, supply mechanisms, institutional adoption, and technical ecosystems. Suitable for investors keen on understanding price predictions, investment strategies, and potential risks, the article guides readers to make informed decisions. Keywords: CORL, OP, investment value, cryptocurrency market, algorithmic trading.
2025-11-26 02:13:59
Aptos vs Giants: Performance Analysis & Market Share of This Rising Layer 1 Blockchain

Aptos vs Giants: Performance Analysis & Market Share of This Rising Layer 1 Blockchain

Dive into the world of Aptos with our comprehensive competitor analysis. Discover how Aptos stacks up against Ethereum in performance, its market cap ranking, and user growth data. Uncover Aptos' unique advantages and explore its evolving market share trends in the dynamic blockchain landscape.
2025-06-24 03:28:13
Why SUI is Bullish Right Now

Why SUI is Bullish Right Now

SUI has quickly become one of the most talked-about Layer 1s in 2025—and for good reason. With skyrocketing total value locked (TVL), surging daily users, and bullish price action, the SUI/USDT pair is catching fire. Whether you're a swing trader or a long-term believer, the setup right now looks strong. Let's break down what's happening, where it's headed, and how to position yourself before the next move.
2025-07-23 07:09:19
What is AVAX: A Comprehensive Guide to Avalanche's Native Cryptocurrency

What is AVAX: A Comprehensive Guide to Avalanche's Native Cryptocurrency

The article offers a comprehensive guide to AVAX, Avalanche's native cryptocurrency, highlighting its significance as a scalable blockchain platform in DeFi, NFTs, and enterprise blockchain solutions. It delves into Avalanche's technical architecture, origins, market performance, and unique systems like the Proof-of-Stake consensus mechanism and subnet functionalities. This guide addresses the needs of developers, investors, and enthusiasts by explaining market dynamics, ecosystem applications, and potential controversies. Structured to showcase Avalanche's strategic collaborations, community insights, and future roadmap, this resource is invaluable for those seeking to understand or participate in AVAX's thriving ecosystem.
2025-09-11 03:15:20
2025 LRC Price Prediction: Analyzing Market Trends, Tokenomics and Growth Potential in the Layer 2 Ecosystem

2025 LRC Price Prediction: Analyzing Market Trends, Tokenomics and Growth Potential in the Layer 2 Ecosystem

This article provides an in-depth analysis of Loopring (LRC) within the layer-2 ecosystem, focusing on its market position, historical price trends, and growth potential as of 2025. It offers professional price predictions from 2025 to 2030, exploring key factors such as tokenomics, macroeconomic impacts, and technological advancements influencing LRC's future value. Targeting investors and crypto enthusiasts, the piece outlines investment strategies, risk management frameworks, and addresses potential market, regulatory, and technical risks. Readers will gain insights into LRC's investment value, trading methods, and FAQs on future price projections.
2025-09-26 07:47:40
What is BAL: Understanding the Basics of Balance Sheet Assessment in Financial Analysis

What is BAL: Understanding the Basics of Balance Sheet Assessment in Financial Analysis

Explore the fundamental aspects of Balancer (BAL), focusing on its role in revolutionizing decentralized finance through automated market making and liquidity provision. Learn about BAL's origins, technical workings, market performance, strategic partnerships, and community engagement, tackling issues like scalability and regulatory risks. Targeted at both newcomers and seasoned crypto enthusiasts, this article provides insights into BAL's innovative contributions to the DeFi landscape. Key topics include BAL's market dynamics, ecosystem applications, community sentiment, and future roadmap, with actionable advice on engaging with BAL, including purchasing on Gate and participating in governance.
2025-09-28 14:42:27
Recommended for You
Is Parex Ecosystem (PRX) a good investment?: A Comprehensive Analysis of Performance, Tokenomics, and Market Potential

Is Parex Ecosystem (PRX) a good investment?: A Comprehensive Analysis of Performance, Tokenomics, and Market Potential

# Article Overview: Is Parex Ecosystem (PRX) a Good Investment? This comprehensive analysis evaluates PRX as an investment opportunity through detailed performance metrics, tokenomics examination, and market potential assessment. The report addresses critical questions for cryptocurrency investors: whether PRX represents a viable investment, what risks accompany this digital asset, and what price trajectories may unfold through 2031. Ideal for both novice and experienced investors seeking evidence-based PRX investment guidance, this analysis combines historical price data, technical specifications, and risk evaluation. Structured across market performance review, project foundation analysis, tokenomics breakdown, and forward-looking predictions, the report provides actionable insights on PRX positioning within the Layer 1 DeFi ecosystem—currently trading at $0.0024 on Gate with extreme volatility, minimal liquidity, and bearish technical signals requiring careful consideration.
2026-01-06 00:22:43
Is FEAR (FEAR) a good investment?: A Comprehensive Analysis of Risk Factors, Market Potential, and Future Prospects for 2024 and Beyond

Is FEAR (FEAR) a good investment?: A Comprehensive Analysis of Risk Factors, Market Potential, and Future Prospects for 2024 and Beyond

# FEAR Token Investment Guide: Comprehensive Analysis of Risk Factors, Market Potential, and 2026+ Prospects **Article Overview** This comprehensive investment analysis examines FEAR, a hybrid NFT utility token within the blockchain gaming ecosystem, trading at $0.0019507 (January 2026) with a $34.5K market cap. The guide addresses whether FEAR represents a viable investment by analyzing historical price performance, tokenomic deflationary mechanisms, and multi-chain deployment across Ethereum and Polygon networks on Gate exchange. Designed for retail investors, traders, and cryptocurrency portfolio managers, this report evaluates FEAR's core gaming utility, identifies critical risk factors including 96.35% year-over-year decline and minimal $4,369 daily liquidity, and projects price scenarios through 2031. By combining market data analysis with ecosystem fundamentals, readers gain actionable insights to determine FEAR's appropriate role within diversified crypto portfolios while understanding concentration
2026-01-06 00:21:40
Is Frok AI (FROKAI) a good investment?: A Comprehensive Analysis of Market Potential, Risk Factors, and Future Prospects

Is Frok AI (FROKAI) a good investment?: A Comprehensive Analysis of Market Potential, Risk Factors, and Future Prospects

# Article Overview: Is Frok AI (FROKAI) a Good Investment? Frok AI (FROKAI) is an ERC-20 token operating on Base blockchain, enabling AI-powered content generation for creative professionals. This comprehensive analysis examines FROKAI's market performance, investment viability, and risk factors through detailed price analytics, token economics, and adoption metrics. The article addresses critical questions for potential investors: evaluating whether FROKAI represents genuine investment opportunity or speculative micro-cap asset, analyzing its 98.6% price depreciation, and assessing future prospects through 2031. Structured analysis covering market status, risk assessment, liquidity constraints, and portfolio allocation guidance serves risk-aware investors, crypto traders, and financial decision-makers. Real-time data sourced from Gate ensures investment decisions are grounded in current market evidence.
2026-01-06 00:21:29
GPUAI vs XRP: Which Cryptocurrency Offers Better Investment Potential in the AI and Blockchain Era?

GPUAI vs XRP: Which Cryptocurrency Offers Better Investment Potential in the AI and Blockchain Era?

# Article Overview: GPUAI vs XRP Investment Comparison This comprehensive analysis compares GPUAI and XRP across market performance, tokenomics, and investment potential in the AI and blockchain era. The article examines historical price trends, institutional adoption, technical ecosystems, and 2026-2031 price forecasts to help investors determine which cryptocurrency aligns better with their portfolio strategy. It addresses critical questions regarding volatility, liquidity, regulatory risks, and long-term growth prospects. Designed for beginner to institutional investors, this guide provides actionable investment recommendations, risk assessment frameworks, and asset allocation strategies tailored to different risk profiles. Through detailed comparison on Gate, the article equips readers with data-driven insights to make informed cryptocurrency investment decisions in emerging AI infrastructure and payment settlement markets.
2026-01-06 00:12:12
MA vs ETC: A Comprehensive Comparison of Moving Averages and Exponential Time Constants in Technical Analysis

MA vs ETC: A Comprehensive Comparison of Moving Averages and Exponential Time Constants in Technical Analysis

# Article Overview: MA vs ETC Investment Comparison Guide This comprehensive guide compares Mind AI (MA) and Ethereum Classic (ETC) across price performance, tokenomics, and investment potential to help crypto investors make informed decisions. The article analyzes historical price trends, current market status, and 2026-2031 price forecasts, revealing that ETC has declined 52.72% while MA dropped 98.18% from peaks. It addresses critical investor questions about which asset offers better value through detailed risk assessments, strategic allocation recommendations, and ecosystem evaluations. Designed for beginner to institutional investors, this guide provides actionable insights on portfolio positioning, with ETC favored for stability and MA for growth potential. Real-time price data available on Gate, plus expert risk warnings ensure balanced decision-making in volatile crypto markets.
2026-01-06 00:11:38
Understanding Spot Balance on a Cryptocurrency Exchange

Understanding Spot Balance on a Cryptocurrency Exchange

Discover the difference between fiat and spot balances on Gate. This complete guide covers spot cryptocurrency trading, order types (Limit, Market, Stop-Limit), balance management, and essential basics for novice traders.
2026-01-05 23:42:56