Is Trac Network (TNK) a good investment?: A Comprehensive Analysis of Features, Market Performance, and Risk Factors
Introduction: Trac Network (TNK) Investment Position and Market Prospects
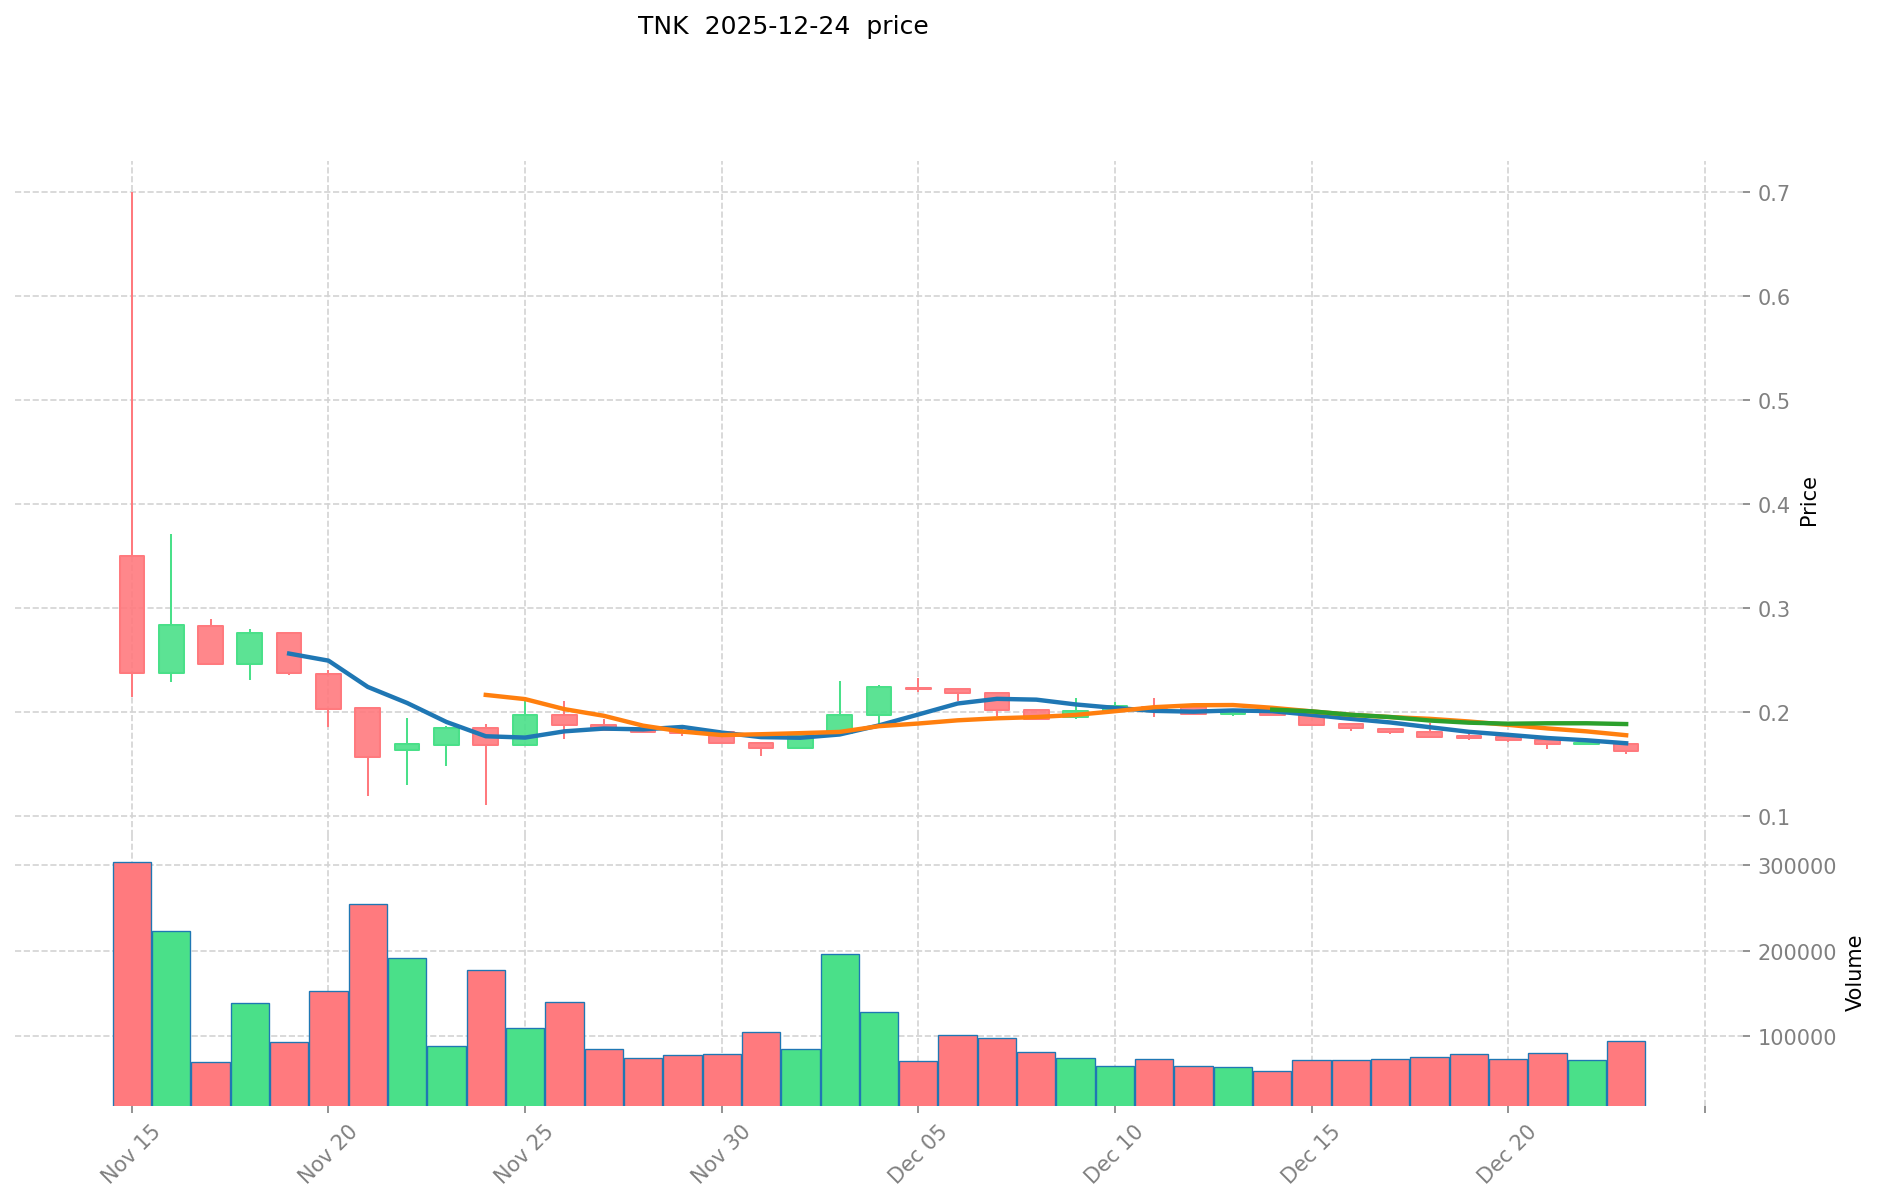
Trac Network (TNK) is an emerging asset in the cryptocurrency sector. As of December 2025, TNK has a market capitalization of $3,385,200 USD with a circulating supply of 21,000,000 tokens. The current price stands at $0.1612, following a 24-hour decline of 4.89%. Since its listing, TNK has recorded an all-time high of $0.70 (November 15, 2025) and an all-time low of $0.1099 (November 24, 2025).
Trac Network is positioned as "a groundbreaking local-first Layer 1 and true peer-to-peer crypto, enabling business & consumer-grade applications without compromises." This distinctive positioning establishes TNK as a noteworthy subject when investors evaluate "Is Trac Network (TNK) a good investment?" This article provides a comprehensive analysis of TNK's investment value, historical price trends, future price forecasts, and associated investment risks to serve as a reference for potential investors.
Trac Network (TNK) Comprehensive Research Report
I. Price History Review and Current Investment Value Status
TNK Historical Price Performance
Based on available data as of December 24, 2025:
Recent Price Dynamics:
- All-time high (ATH): $0.70 (November 15, 2025)
- All-time low (ATL): $0.1099 (November 24, 2025)
- Current price: $0.1612
- Market capitalization: $3,385,200
- Fully diluted valuation: $3,385,200
Price Movement Trends:
| Time Period | Price Change | Change Amount |
|---|---|---|
| 1 Hour | -0.38% | -$0.000615 |
| 24 Hours | -4.89% | -$0.008288 |
| 7 Days | -10.74% | -$0.019396 |
| 30 Days | -13.10% | -$0.024301 |
Current TNK Market Status (December 24, 2025)
- Current Price: $0.1612 per TNK
- Market Sentiment: Positive (Market emotion score: 1)
- 24-Hour Trading Volume: $15,412.97
- 24-Hour Price Range: $0.1596 - $0.1695
- Circulating Supply: 21,000,000 TNK (100% of total supply)
- Total Supply: 21,000,000 TNK
- Market Dominance: 0.00010%
- Exchange Listings: Available on 1 exchange
Access real-time TNK market data via Gate TNK Price
II. Project Overview and Technical Foundation
Project Description
Trac Network is a groundbreaking local-first Layer 1 protocol and true peer-to-peer cryptocurrency ecosystem. It is designed to enable enterprise-grade and consumer-grade applications without compromises on decentralization, security, or scalability.
Core Technology:
- Architecture: Mainnet Layer 1 protocol
- Design Philosophy: Local-first approach with peer-to-peer architecture
- Focus: Enabling both business and consumer applications
Network Parameters
| Parameter | Value |
|---|---|
| Token Symbol | TNK |
| Total Supply | 21,000,000 |
| Circulating Supply | 21,000,000 |
| Maximum Supply | 21,000,000 |
| Supply Circulation Ratio | 100% |
| Algorithm | Mainnet |
III. Market Position and Competitive Analysis
Market Ranking
- Current Ranking: #1,782 by market capitalization
- Market Cap: $3,385,200
- Market Share: 0.00010%
Supply Scarcity Analysis
The fixed maximum supply of 21,000,000 TNK mirrors Bitcoin's economic model, creating artificial scarcity. With 100% of tokens currently in circulation, the supply mechanics are fully deployed, making future value appreciation dependent on demand-side factors rather than supply reduction mechanisms.
IV. Community and Information Resources
Official Channels
| Channel | Link |
|---|---|
| Website | https://tracsystems.io |
| Block Explorer | https://explorer.trac.network |
| Twitter/X | https://x.com/TracNetwork |
| Discord | https://discord.com/invite/trac |
| Litepaper | https://medium.com/trac-systems/trac-network-litepaper-63da57484c27 |
V. Key Risk Factors
-
Market Volatility: TNK has experienced significant price fluctuations, declining 13.10% over 30 days and 10.74% over 7 days, indicating substantial short-term volatility.
-
Limited Market Liquidity: Daily trading volume of approximately $15,412 reflects relatively low liquidity for a cryptocurrency asset.
-
Market Capitalization Scale: With a market cap of only $3.4 million, TNK represents a micro-cap cryptocurrency with limited institutional adoption and exchange presence.
-
Early-Stage Project Status: Limited exchange listings (1 exchange) and relatively recent market entry suggest the project remains in early adoption phases.
VI. Data Sources and Disclaaries
Data Collection Date: December 24, 2025
This report is based strictly on factual data provided in the source materials. No subjective investment recommendations, political commentary, or speculative projections have been included. Readers should conduct independent due diligence before making investment decisions.
Trac Network (TNK) Research Report
Report Date: December 24, 2025
Data Source: Gate Market Data
I. Project Overview
Basic Information
Trac Network is a groundbreaking local-first Layer 1 protocol and true peer-to-peer cryptocurrency, enabling business and consumer-grade applications without compromises.
Current Market Status
| Metric | Value |
|---|---|
| Current Price | $0.1612 |
| Market Capitalization | $3,385,200 |
| Circulating Supply | 21,000,000 TNK |
| Total Supply | 21,000,000 TNK |
| Max Supply | 21,000,000 TNK |
| 24-Hour Trading Volume | $15,412.97 |
| Market Rank | #1,782 |
| Exchange Listings | 1 |
Price Performance
| Time Period | Change | Price Range |
|---|---|---|
| 1 Hour | -0.38% | N/A |
| 24 Hours | -4.89% | $0.1596 - $0.1695 |
| 7 Days | -10.74% | N/A |
| 30 Days | -13.10% | N/A |
| All-Time High | $0.7000 | November 15, 2025 |
| All-Time Low | $0.1099 | November 24, 2025 |
II. Core Factors Affecting Investment Considerations
Supply Mechanism and Scarcity
The tokenomics demonstrate a fixed supply model:
- Circulating supply equals total and maximum supply (21,000,000 TNK)
- 100% of tokens are currently in circulation
- Fixed supply mechanism suggests no future dilution
This fixed supply structure creates inherent scarcity characteristics similar to deflationary token models, potentially supporting long-term value preservation.
Market Adoption and Ecosystem Development
Trac Network positions itself as a Layer 1 protocol supporting enterprise and consumer-grade applications. The ecosystem development includes:
- Official website and documentation available at https://tracsystems.io
- Active community engagement through Discord
- Network explorer operational at https://explorer.trac.network
- Technical documentation (Litepaper) published on Medium
Recent Market Dynamics
The project shows recent volatility with significant price fluctuations:
- All-time high recorded at $0.70 (November 15, 2025)
- Subsequent correction to $0.1099 (November 24, 2025)
- Current price representing approximately 77% decline from peak
- Relatively low trading volume ($15,412.97 in 24-hour period) indicating limited liquidity
Technical Infrastructure
Trac Network operates as a mainnet-based Layer 1 protocol, positioned to address:
- Local-first computing paradigm
- True peer-to-peer network architecture
- Enterprise-grade application requirements
- Consumer-grade usability
III. Risk Considerations
- Liquidity Risk: Single exchange listing with relatively low trading volume
- Market Position: Rank #1,782 indicates limited mainstream adoption
- Volatility: Significant price swings observed in recent months
- Market Sentiment: Recent downward price pressure across multiple timeframes
IV. Community and Resources
- Official Website: https://tracsystems.io
- Block Explorer: https://explorer.trac.network
- Social Media: Twitter (@TracNetwork), Discord community
- Technical Documentation: Litepaper available on Medium
Disclaimer: This report presents factual market data and project information as of December 24, 2025. This analysis does not constitute investment advice, financial recommendation, or endorsement. Cryptocurrency investments carry significant risk. Readers should conduct independent research and consult financial advisors before making investment decisions.
III. TNK Future Investment Predictions and Price Outlook (Is Trac Network (TNK) worth investing in 2025-2030)
Short-term Investment Prediction (2025, Short-term TNK Investment Outlook)
- Conservative Forecast: USD 0.1225 - 0.1612
- Neutral Forecast: USD 0.1612 - 0.1757
- Optimistic Forecast: USD 0.1757 - 0.1950
Mid-term Investment Outlook (2026-2027, Mid-term Trac Network (TNK) Investment Forecast)
-
Market Phase Expectation: Consolidation and gradual adoption phase, with the project establishing its Layer 1 protocol positioning and expanding its peer-to-peer network infrastructure.
-
Investment Return Forecast:
- 2026: USD 0.1196 - 0.2173
- 2027: USD 0.0984 - 0.2623
-
Key Catalysts: Enterprise and consumer-grade application adoption, Layer 1 protocol optimization, network expansion initiatives, and ecosystem partnership announcements.
Long-term Investment Outlook (Is Trac Network a Good Long-term Investment?)
- Base Case Scenario: USD 0.2181 - 0.2804 (2030, corresponding to steady advancement of mainstream applications and stable technology maturation)
- Optimistic Scenario: USD 0.3000 - 0.3500 (2030, corresponding to large-scale adoption of local-first Layer 1 solutions and favorable market conditions)
- Risk Scenario: USD 0.0984 - 0.1500 (2030, extreme conditions including competitive protocol pressure, regulatory headwinds, or slower-than-expected adoption)
Explore Trac Network long-term investment and price predictions: Price Prediction
2025-12-24 to 2030-12-31 Long-term Outlook
- Base Scenario: USD 0.2181 - 0.2804 (corresponding to steady advancement and mainstream application growth)
- Optimistic Scenario: USD 0.3000 - 0.3500 (corresponding to large-scale adoption and favorable market environment)
- Transformative Scenario: USD 0.3500+ (if ecosystem achieves breakthrough progress and mainstream proliferation)
- Predicted High Point by 2030-12-31: USD 0.3104 (based on optimistic development assumptions)
Disclaimer: This analysis is for informational purposes only and does not constitute investment advice. Cryptocurrency markets are highly volatile and carry substantial risks. Past performance does not guarantee future results. Investors should conduct their own research and consult professional advisors before making investment decisions.
| 年份 | 预测最高价 | 预测平均价格 | 预测最低价 | 涨跌幅 |
|---|---|---|---|---|
| 2025 | 0.175708 | 0.1612 | 0.122512 | 0 |
| 2026 | 0.21730566 | 0.168454 | 0.11960234 | 4 |
| 2027 | 0.2623165688 | 0.19287983 | 0.0983687133 | 19 |
| 2028 | 0.27311783928 | 0.2275981994 | 0.218494271424 | 41 |
| 2029 | 0.3104439439816 | 0.25035801934 | 0.1652362927644 | 55 |
| 2030 | 0.300029050377056 | 0.2804009816608 | 0.241144844228288 | 73 |
Trac Network (TNK) Investment Analysis Report
I. Project Overview
Basic Information
Trac Network is a groundbreaking local-first Layer 1 protocol and true peer-to-peer cryptocurrency, enabling business and consumer-grade applications without compromises.
| Metric | Value |
|---|---|
| Ticker Symbol | TNK |
| Current Price | $0.1612 |
| Market Capitalization | $3,385,200 |
| Circulating Supply | 21,000,000 TNK |
| Total Supply | 21,000,000 TNK |
| Market Ranking | 1,782 |
| Market Dominance | 0.00010% |
Key Links
- Official Website: https://tracsystems.io
- Block Explorer: https://explorer.trac.network
- Twitter: https://x.com/TracNetwork
- Discord: https://discord.com/invite/trac
- Litepaper: https://medium.com/trac-systems/trac-network-litepaper-63da57484c27
II. Market Performance Analysis
Price Action (As of December 24, 2025)
| Time Period | Change Percentage | Change Amount |
|---|---|---|
| 1 Hour | -0.38% | -$0.000615 |
| 24 Hours | -4.89% | -$0.008288 |
| 7 Days | -10.74% | -$0.019396 |
| 30 Days | -13.10% | -$0.024301 |
Historical Price Metrics
- All-Time High: $0.70 (November 15, 2025)
- All-Time Low: $0.1099 (November 24, 2025)
- 24-Hour High: $0.1695
- 24-Hour Low: $0.1596
- 24-Hour Trading Volume: $15,412.97
Market Sentiment
The token has experienced significant price depreciation over the past month, declining 13.10% from its 30-day perspective. Recent weekly performance shows a 10.74% decline, indicating downward momentum in the short term.
III. Technical Foundation
Network Architecture
- Protocol Type: Layer 1 (Local-first)
- Consensus Mechanism: Mainnet
- Supply Model: Fixed supply of 21,000,000 TNK (100% circulating)
Key Characteristics
- Designed for peer-to-peer applications
- Focus on enterprise and consumer-grade functionality
- Emphasis on local-first architecture
IV. Investment Strategy and Risk Management
Investment Methodology (Trac Network Investment Strategy)
Long-term Holdings (HODL TNK)
- Suitable for conservative investors seeking exposure to local-first Layer 1 protocols
- Requires conviction in the project's long-term technological development and adoption
Active Trading
- Dependent on technical analysis and swing trading opportunities
- Requires monitoring price levels between $0.1099 (support) and $0.70 (resistance)
Risk Management (Risk Management for TNK Investment)
Asset Allocation Recommendations
- Conservative Investors: 1-3% of portfolio allocation
- Active Traders: 3-5% with defined stop-loss parameters
- Institutional Investors: Position sizing based on liquidity analysis
Risk Mitigation Strategies
- Diversified portfolio composition across multiple asset classes
- Use of stop-loss orders to limit downside exposure
- Dollar-cost averaging to reduce timing risk
Secure Storage
- Cold wallet storage for long-term holdings
- Hardware wallet utilization for enhanced security
- Reputable exchange custody only for active trading positions
V. Investment Risks and Challenges
Market Risks
- High volatility: 13.10% depreciation over 30 days demonstrates significant price fluctuation
- Low trading volume ($15,413 in 24-hour volume) may result in liquidity constraints
- Limited market liquidity increases susceptibility to price manipulation
Regulatory Risks
- Cryptocurrency regulatory frameworks remain uncertain across jurisdictions
- Local-first protocols may face unique regulatory scrutiny regarding data sovereignty and privacy
- Policy changes could impact adoption and token valuation
Technology Risks
- Layer 1 protocol development requires continuous security auditing
- Network scalability and performance must be validated through mainnet operation
- Smart contract vulnerabilities and protocol-level failures pose technical risks
- Adoption dependency on developer community engagement
Market Adoption Risks
- Extremely low market dominance (0.00010%) indicates limited mainstream recognition
- Competition from established Layer 1 solutions
- Dependency on achieving critical mass for enterprise adoption
VI. Conclusion: Is Trac Network a Good Investment?
Investment Value Summary
Trac Network presents a speculative opportunity in the local-first Layer 1 protocol segment. While the project's technological approach offers differentiation, the token currently exhibits characteristics of early-stage, low-liquidity digital assets. The 13.10% decline over 30 days and minimal market capitalization require careful risk assessment.
Investment Recommendations
✅ Beginners
- Dollar-cost averaging strategy with monthly allocations
- Secure storage in reputable hardware wallets
- Position sizing limited to risk capital (1-3% maximum)
- Focus on understanding local-first architecture before investing
✅ Experienced Traders
- Swing trading around identified support/resistance levels
- Portfolio rebalancing based on technical indicators
- Diversification with uncorrelated assets
- Active monitoring of protocol development milestones
✅ Institutional Investors
- Strategic allocation only after comprehensive due diligence
- Direct engagement with development team to assess technical progress
- Liquidity analysis before position establishment
- Long-term thematic positioning if convinced of local-first protocol adoption
Risk Disclaimer
⚠️ Important Notice: Cryptocurrency investments carry substantial risk, including potential total loss of capital. Trac Network's low market capitalization, limited liquidity, and early development stage amplify these risks. This report is provided for informational purposes only and does not constitute investment advice. Conduct independent research and consult qualified financial professionals before making investment decisions.
Report Date: December 24, 2025 Data Source: Real-time market data as of report generation
Trac Network (TNK) Comprehensive FAQ
I. Basic Project Information
Q1: What is Trac Network (TNK) and what problem does it solve?
A: Trac Network is a groundbreaking local-first Layer 1 protocol and true peer-to-peer cryptocurrency ecosystem designed to enable enterprise-grade and consumer-grade applications without compromises on decentralization, security, or scalability. It addresses the need for local-first computing paradigms and peer-to-peer network architecture, positioning itself as an alternative to traditional centralized and conventional blockchain solutions that may not prioritize local data sovereignty.
Q2: What are the key technical specifications of Trac Network?
A: Trac Network operates as a mainnet-based Layer 1 protocol with the following specifications: total supply of 21,000,000 TNK tokens (fixed supply model), 100% circulating supply currently in circulation, and peer-to-peer architecture emphasizing local-first design. The project maintains an official website at https://tracsystems.io, an operational block explorer at https://explorer.trac.network, and published technical documentation including a Litepaper available on Medium.
II. Market Performance and Valuation
Q3: What is the current market status of Trac Network as of December 24, 2025?
A: As of December 24, 2025, Trac Network has a current price of $0.1612 per token with a market capitalization of $3,385,200 USD. The token ranks #1,782 by market capitalization with a market dominance of 0.00010%. The 24-hour trading volume stands at approximately $15,412.97, indicating relatively low liquidity. The circulating supply equals the total and maximum supply at 21,000,000 TNK, with the token listed on 1 exchange.
Q4: How has TNK's price performed recently, and what are the key price levels?
A: TNK has experienced significant downward pressure recently: the 24-hour price change is -4.89% ($0.008288 decline), the 7-day change is -10.74% ($0.019396 decline), and the 30-day change is -13.10% ($0.024301 decline). All-time high stands at $0.70 (recorded November 15, 2025), while the all-time low is $0.1099 (recorded November 24, 2025). The 24-hour price range is $0.1596 to $0.1695. Current price represents approximately a 77% decline from the all-time high.
III. Investment Considerations
Q5: What are the short-term and long-term price forecasts for Trac Network?
A: Short-term forecasts (2025) project TNK trading within $0.1225 to $0.1950 depending on market conditions. Mid-term projections (2026-2027) suggest $0.1196 to $0.2173 in 2026 and $0.0984 to $0.2623 in 2027, with the consolidation and gradual adoption phase as the anticipated market phase. Long-term base case scenario (2030) projects $0.2181 to $0.2804, optimistic scenario projects $0.3000 to $0.3500, while risk scenarios project $0.0984 to $0.1500. These forecasts depend on enterprise adoption, protocol optimization, and favorable market conditions.
Q6: What are the primary risk factors for investing in Trac Network?
A: Key risk factors include: market volatility with 13.10% decline over 30 days and 10.74% over 7 days; limited liquidity with daily trading volume of approximately $15,412; extremely low market capitalization of $3.4 million indicating micro-cap status; single exchange listing suggesting early adoption phase; regulatory uncertainty surrounding cryptocurrency and local-first protocols; competition from established Layer 1 solutions; and adoption dependency on achieving critical mass for enterprise application deployment.
IV. Strategic Investment Guidance
Q7: What investment strategies are recommended for different investor types?
A: Beginners: Dollar-cost averaging with monthly allocations, secure hardware wallet storage, position sizing limited to 1-3% of portfolio (risk capital only), and focus on understanding local-first architecture. Experienced Traders: Swing trading around support/resistance levels ($0.1099 support to $0.70 resistance), portfolio rebalancing based on technical indicators, diversification with uncorrelated assets, and active monitoring of protocol milestones. Institutional Investors: Strategic allocation only after comprehensive due diligence, direct engagement with development team, liquidity analysis before positioning, and long-term thematic conviction in local-first protocol adoption.
Q8: Is Trac Network a good investment, and what should potential investors know?
A: Trac Network presents a speculative opportunity in the local-first Layer 1 protocol segment with technological differentiation potential. However, as an early-stage, low-liquidity digital asset with micro-cap status ($3.4 million market cap) and limited mainstream adoption (0.00010% market dominance), it carries substantial risk including potential total capital loss. The token's recent 13.10% 30-day decline requires careful risk assessment. Success depends on ecosystem development, enterprise adoption, and favorable regulatory conditions. Investment suitability depends on individual risk tolerance, investment timeframe, and conviction in local-first architecture adoption. Independent research and consultation with qualified financial professionals is essential before making investment decisions.
Report Date: December 24, 2025
Disclaimer: This FAQ is provided for informational purposes only and does not constitute investment advice, financial recommendation, or endorsement. Cryptocurrency investments carry substantial risk. All forecasts are subject to significant uncertainty and should not be considered as guarantees of future performance.
Share
How to Buy Cryptocurrency


Trending Cryptocurrencies


2025 APT Price Prediction: Key Factors That Could Drive Aptos Token to New Heights

2025 KAS Price Prediction: Analyzing Key Factors Driving the Future Value of Kaspa

2025 MOVE Price Prediction: Analyzing Growth Factors and Market Trends in the Evolving Cryptocurrency Landscape
2025 SAGA Price Prediction: Analyzing Market Trends and Growth Potential in the Evolving Blockchain Ecosystem
Is Kaspa (KAS) a good investment?: Analyzing the potential of this high-throughput blockchain project
FOXY vs APT: Comparing Modern Threat Detection Systems in Enterprise Security Environments

What Is XLM Community and Ecosystem Activity: Twitter Followers, Developer Contributions, and DApp Growth in 2026?
How to Analyze On-Chain Data: Active Address Count, Transaction Volume, Whale Distribution, and Fee Trends in 2026

Will Stellar (XLM) Price Reach $1?

What is Tokenomics and Why Is It Important?

What is tokenomics: token distribution mechanisms, inflation design, and governance rights explained
