Is Rarible (RARI) a good investment?: A Comprehensive Analysis of the NFT Marketplace Token's Potential and Risks in 2024
Introduction: Rarible (RARI) Investment Position and Market Prospects
RARI is an important asset in the cryptocurrency field. As the native governance token of the Rarible ecosystem, it powers infrastructure for onchain commerce. Stewarded by the RARI Foundation on behalf of the community, RARI has established itself as a key component of the NFT marketplace ecosystem.
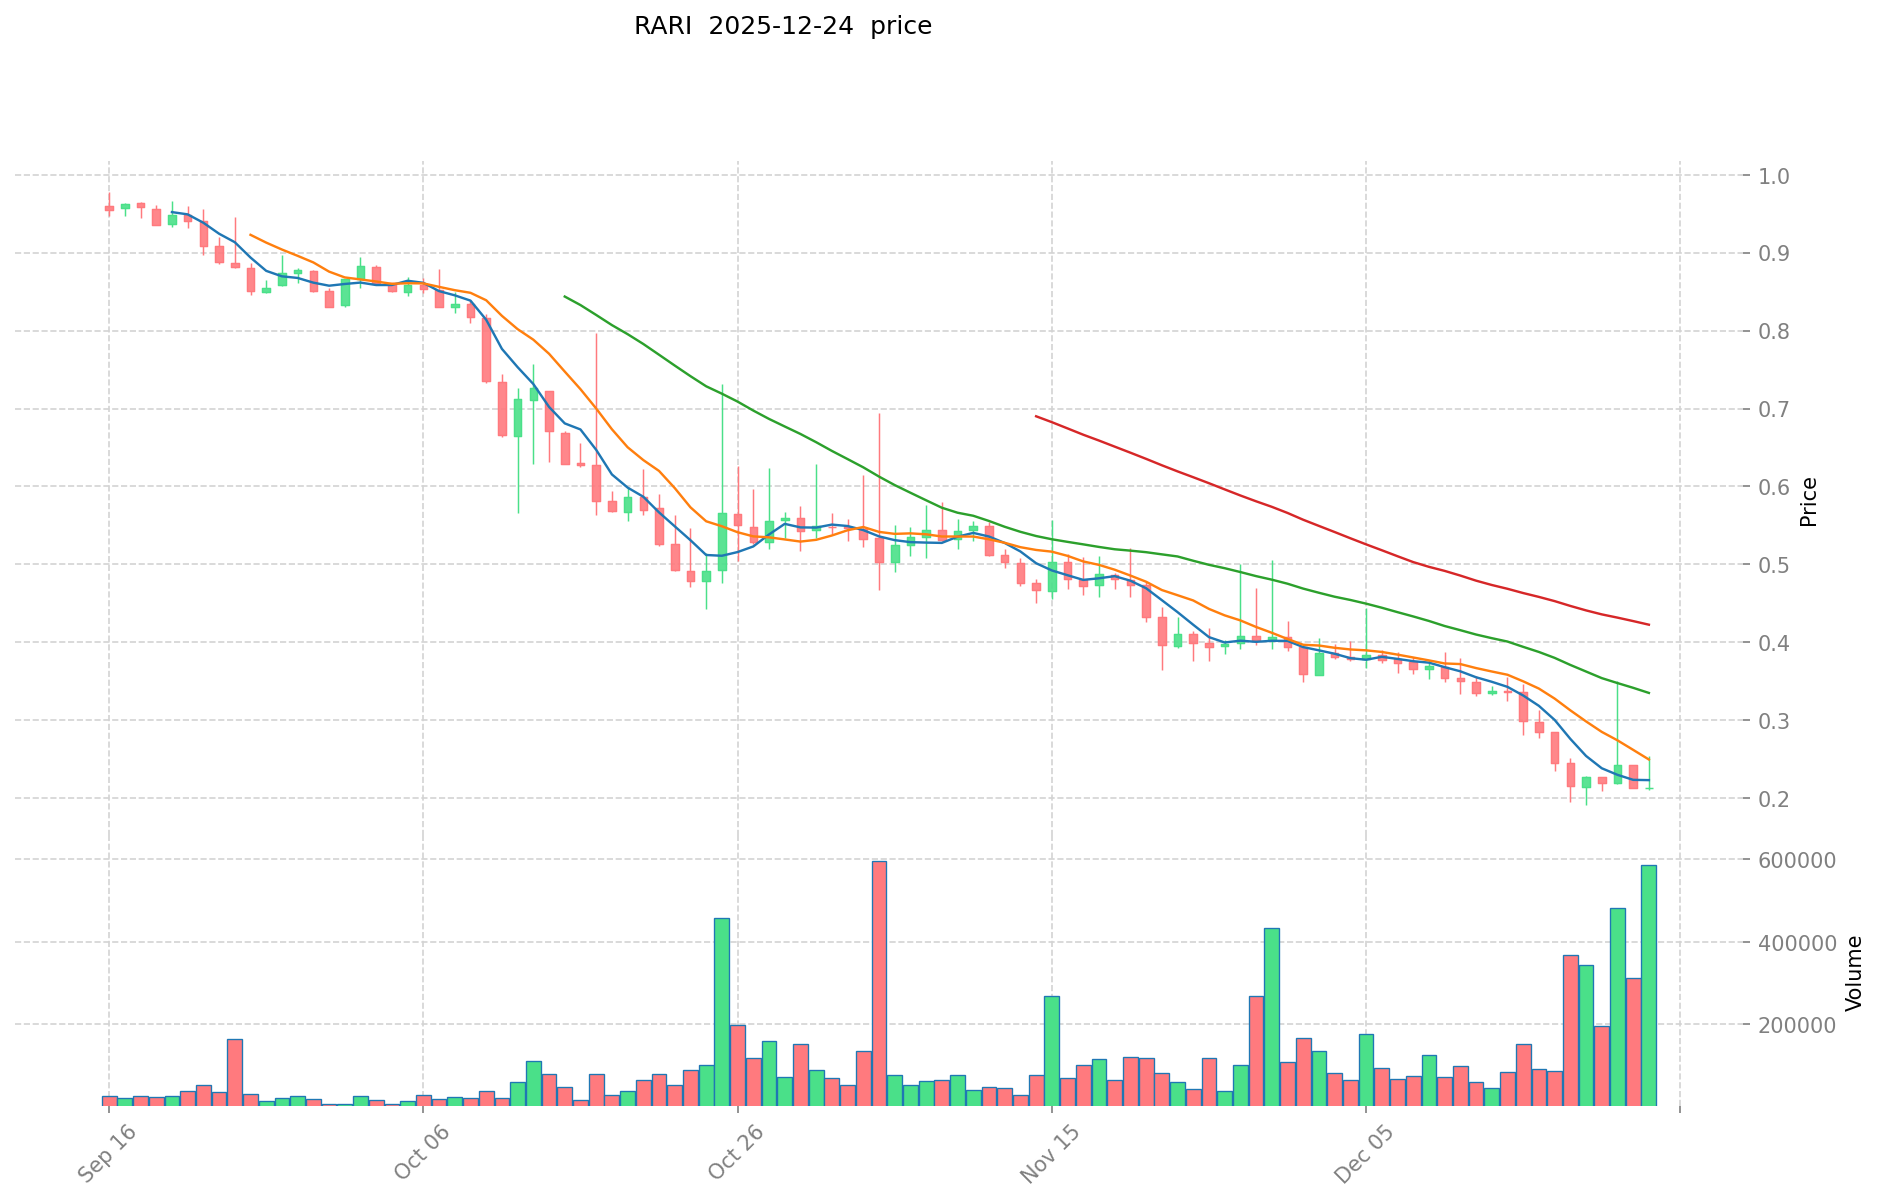
As of December 24, 2025, RARI maintains a market capitalization of approximately $5.34 million USD, with a circulating supply of approximately 18.12 million tokens out of a total supply of 25 million. The current token price stands at $0.2137, having experienced significant volatility since its inception. The token has recorded an all-time high of $46.7 (reached on March 30, 2021) and a recent all-time low of $0.191384 (recorded on December 19, 2025), reflecting the dynamic nature of the cryptocurrency market.
Positioned as "infrastructure for onchain commerce," RARI has garnered increasing attention from investors examining whether Rarible (RARI) represents a sound investment opportunity. The token's utility model is anchored in a fee-distribution mechanism where transaction fees generated on the Rarible.com NFT marketplace are collected and distributed to users in RARI tokens. Additionally, token holders can stake RARI to delegate voting power and earn annual percentage yields while participating in ecosystem governance.
This article provides a comprehensive analysis of RARI's investment value, historical price trends, future price forecasts, and associated investment risks, offering insights for potential investors evaluating this cryptocurrency asset.
Rarible (RARI) Crypto Asset Research Report
I. Price History Review and Current Investment Status of RARI
Historical Price Performance of RARI
Based on available data, Rarible (RARI) has experienced significant price volatility since its launch:
- March 30, 2021: All-time high (ATH) of $46.70 USD
- December 19, 2025: All-time low (ATL) of $0.191384 USD
- Current period (December 24, 2025): Trading at $0.2137 USD
The token has declined approximately 99.5% from its historical peak, representing a substantial loss for early investors who purchased near the ATH.
Current Market Status (December 24, 2025)
| Metric | Value |
|---|---|
| Current Price | $0.2137 USD |
| 24-Hour Change | +0.7% |
| 7-Day Change | -24.91% |
| 30-Day Change | -47.93% |
| 1-Year Change | -91.8% |
| Market Capitalization | $3,872,646.24 USD |
| Fully Diluted Valuation (FDV) | $5,342,500.00 USD |
| 24-Hour Trading Volume | $128,921.61 USD |
| Market Cap to FDV Ratio | 72.49% |
| Circulating Supply | 18,121,882.26 RARI |
| Total Supply | 25,000,000 RARI |
| Market Dominance | 0.00016% |
| Active Holders | 24,455 |
II. Project Overview and Tokenomics
Project Description
$RARI powers infrastructure for onchain commerce. It serves as the native governance token of the Rarible ecosystem, stewarded by the RARI Foundation on behalf of the community. The RARI Foundation facilitates a cross-chain rewards program on Rarible.com, designed to fuel long-term growth and deepen liquidity.
Key Revenue Mechanism: Every trade on the NFT marketplace generates fees that are collected by the Foundation and distributed to users in $RARI tokens.
Token Utility
Holders can stake $RARI to:
- Delegate voting power
- Earn Annual Percentage Yield (APY)
- Participate in ecosystem governance
- Share in long-term value created by the ecosystem
Token Distribution
- Total Supply: 25,000,000 RARI
- Circulating Supply: 18,121,882.26 RARI (72.49% of total)
- Distribution Breakdown (based on reference materials):
- Investors and Team: 30% (7,500,000 RARI)
- Airdrop: 10% (2,500,000 RARI)
- Marketplace Liquidity Mining Rewards: 60% (15,000,000 RARI, distributed at ~75,000 RARI per week)
III. Platform and Ecosystem
Rarible Marketplace Features
Users can:
- Create customized NFT assets on the Rarible platform
- Purchase and sell digital collectibles
- Participate in platform governance through RARI token voting
- Benefit from liquidity mining rewards on the platform
The platform distinguishes itself through NFT creation capabilities and liquidity incentive mechanisms, positioning it alongside other major NFT marketplaces like OpenSea.
Blockchain Infrastructure
- Primary Blockchain: Ethereum (ETH)
- Contract Address: 0xfca59cd816ab1ead66534d82bc21e7515ce441cf
- Cross-Chain Support: The RARI Foundation facilitates cross-chain rewards programs on Rarible.com
IV. Price Performance Analysis
Short-Term Price Trends
| Time Period | Price Change | Change Amount (USD) |
|---|---|---|
| 1 Hour | +1.13% | +0.00239 |
| 24 Hours | +0.7% | +0.00149 |
| 7 Days | -24.91% | -0.07089 |
| 30 Days | -47.93% | -0.19671 |
| 1 Year | -91.8% | -2.39240 |
24-Hour Price Range
- High (24H): $0.2543 USD
- Low (24H): $0.2104 USD
- Trading Range: $0.0439 USD spread
Market Metrics Summary
| Metric | Status |
|---|---|
| Market Rank | #1,701 |
| Exchange Coverage | 7 exchanges |
| Market Share | 0.00016% of total crypto market |
V. Reference Resources
- Official Website: https://app.rarible.com/rari
- Smart Contract Explorer: https://etherscan.io/token/0xfca59cd816ab1ead66534d82bc21e7515ce441cf
- Official Twitter: https://twitter.com/rariblecom
Report Generated: December 24, 2025
Disclaimer: This report is for informational purposes only and should not be construed as investment advice or recommendations. The cryptocurrency market is highly volatile and subject to regulatory changes. Investors should conduct their own research and consult with qualified financial advisors before making investment decisions.
Rarible (RARI) Investment Analysis Report
Report Date: December 24, 2025
Current Price: $0.2137
Market Cap: $3,872,646.24
I. Executive Summary
Rarible (RARI) is the native governance token of the Rarible ecosystem, functioning as infrastructure for onchain commerce. As of December 24, 2025, RARI trades at $0.2137, representing a significant decline from its all-time high of $46.7 reached in March 2021. The token demonstrates high volatility, with a 1-year loss of 91.8% and current market capitalization of approximately $3.87 million, ranking 1,701 among cryptocurrencies.
II. Core Factors Influencing RARI as an Investment
Supply Mechanism and Scarcity
RARI operates with a fixed maximum supply of 25,000,000 tokens, of which 18,121,882 are currently circulating (approximately 72.49% circulation ratio). This predetermined supply cap creates a defined scarcity model. However, the token's value proposition is not primarily dependent on supply constraints but rather on ecosystem utility and governance participation.
Ecosystem Fee Distribution Model
A significant development occurred in September 2025: 100% of Rarible marketplace fees now fund RARI buybacks, replacing previous short-lived token reward programs. This mechanism potentially creates sustained demand pressure through systematic token repurchases, differentiating RARI's value capture from traditional reward distributions.
Governance and Staking Mechanisms
Token holders can participate in ecosystem governance by staking RARI to delegate voting power while earning Annual Percentage Yield (APY). This dual incentive structure—combining governance rights with yield generation—provides utility beyond speculative trading, creating potential long-term holding incentives for participants seeking involvement in protocol decisions.
Cross-Chain Rewards Program
The RARI Foundation facilitates cross-chain reward programs on Rarible.com designed to promote long-term growth and deepen liquidity. Every transaction on the NFT marketplace generates fees distributed to users in RARI, creating a continuous mechanism for token distribution within the ecosystem.
III. Market Performance Analysis
Price Trends
| Timeframe | Change (%) | Current Impact |
|---|---|---|
| 1 Hour | +1.13% | Minor positive momentum |
| 24 Hours | +0.7% | Near-flat performance |
| 7 Days | -24.91% | Significant short-term decline |
| 30 Days | -47.93% | Substantial monthly losses |
| 1 Year | -91.8% | Severe long-term depreciation |
All-Time High: $46.7 (March 30, 2021)
All-Time Low: $0.191384 (December 19, 2025)
52-Week Range: $0.191384 - $46.7
Valuation Metrics
- Market Capitalization: $3,872,646.24
- Fully Diluted Valuation: $5,342,500.00
- Market Dominance: 0.00016%
- 24-Hour Trading Volume: $128,921.61
- Token Holders: 24,455
IV. Investment Considerations
Extreme Market Volatility
Cryptocurrency markets demonstrate inherent unpredictability, making precise price forecasting problematic. The disparity in price predictions reflects this uncertainty—analysts project 2025 RARI prices ranging from $0.21 to $30.85, indicating lack of consensus among market participants.
Risk Factors
- Severe Historical Depreciation: 91.8% loss over one year significantly exceeds typical asset class volatility
- Low Market Liquidity: Daily volume of $128,921 remains modest relative to market capitalization
- Concentrated Market Cap: Position at rank 1,701 indicates limited institutional recognition or adoption
- Recent All-Time Low: December 2025 ATL suggests potential continued downside pressure
Potential Positive Factors
- Sustainable Fee Capture: September 2025 transition to 100% buyback mechanism provides systematic token demand
- Governance Participation: Staking infrastructure creates utility beyond speculative trading
- Ecosystem Integration: Cross-chain rewards and marketplace integration provide operational value
- Fixed Supply: Maximum supply cap of 25,000,000 creates predetermined scarcity
V. Conclusion
Investment in RARI presents substantial risk given its 91.8% annual depreciation, rank 1,701 in market capitalization, and volatile price dynamics. While the September 2025 fee buyback mechanism and governance staking features provide some structural support, the token remains highly speculative. The wide divergence in price predictions reflects genuine uncertainty regarding future valuation.
Any investment decision requires independent research considering personal risk tolerance, portfolio allocation objectives, and thorough analysis of NFT market dynamics beyond RARI itself.
Data Sources: Gate, CoinMarketCap, market analysis platforms
Disclaimer: This analysis is informational only and does not constitute investment advice.
III. RARI Future Investment Predictions and Price Outlook
Short-term Investment Prediction (2025, Short-term RARI Investment Outlook)
- Conservative forecast: $0.1946 - $0.2203
- Neutral forecast: $0.2139 - $0.2278
- Optimistic forecast: $0.2278 - $0.2432
Mid-term Investment Outlook (2026-2028, Mid-term Rarible(RARI) Investment Forecast)
-
Market phase expectation: Consolidation and gradual recovery phase, with potential for infrastructure expansion and ecosystem development as NFT market stabilizes and cross-chain capabilities mature.
-
Investment return predictions:
- 2026: $0.1346 - $0.2779
- 2027: $0.1832 - $0.2871
-
Key catalysts: Ecosystem adoption improvements, NFT market recovery, institutional participation, cross-chain integration expansion, regulatory clarity for digital assets, and community governance initiatives.
Long-term Investment Outlook (Is RARI a good long-term investment?)
-
Base scenario: $0.2889 - $0.3939 USD (assuming steady ecosystem growth and moderate mainstream adoption)
-
Optimistic scenario: $0.4403 - $0.5500 USD (assuming accelerated NFT market expansion and increased institutional adoption)
-
Risk scenario: $0.1200 - $0.1800 USD (under market contraction, reduced NFT trading activity, or regulatory headwinds)
For detailed RARI long-term investment and price forecasts: Price Prediction
2025-12-31 Long-term Outlook
- Base scenario: $0.2889 - $0.3939 USD (corresponding to steady progress and mainstream application improvements)
- Optimistic scenario: $0.4403 - $0.5500 USD (corresponding to large-scale adoption and favorable market environment)
- Transformative scenario: $0.7600 USD and above (if ecosystem achieves breakthrough progress and mainstream adoption)
- 2030-12-31 predicted high: $0.4400 USD (based on optimistic development assumptions)
Disclaimer: This analysis is for informational purposes only and does not constitute investment advice. Past performance does not guarantee future results. All price predictions carry significant uncertainty and may not materialize. Investors should conduct independent research and consult financial advisors before making investment decisions. Cryptocurrency markets are highly volatile and speculative.
| 年份 | 预测最高价 | 预测平均价格 | 预测最低价 | 涨跌幅 |
|---|---|---|---|---|
| 2025 | 0.220317 | 0.2139 | 0.194649 | 0 |
| 2026 | 0.27789888 | 0.2171085 | 0.13460727 | 1 |
| 2027 | 0.2871042804 | 0.24750369 | 0.1831527306 | 15 |
| 2028 | 0.352841260464 | 0.2673039852 | 0.168401510676 | 25 |
| 2029 | 0.44030312442144 | 0.310072622832 | 0.23875591958064 | 45 |
| 2030 | 0.393947267308056 | 0.37518787362672 | 0.288894662692574 | 75 |
Rarible (RARI) Research Report
Executive Summary
Rarible (RARI) is the native governance token of the Rarible ecosystem, designed to power infrastructure for onchain commerce. As of December 24, 2025, RARI is trading at $0.2137, with a market capitalization of approximately $3.87 million and a fully diluted valuation of $5.34 million. The token has experienced significant depreciation, declining 91.8% over the past year.
I. Project Overview
Project Introduction
$RARI powers infrastructure for onchain commerce and serves as the native governance token of the Rarible ecosystem, stewarded by the RARI Foundation on behalf of the community. The RARI Foundation facilitates a cross-chain rewards program on Rarible.com, designed to fuel long-term growth and deepen liquidity.
Tokenomics
| Metric | Value |
|---|---|
| Current Price | $0.2137 |
| Circulating Supply | 18,121,882.26 RARI |
| Total Supply | 25,000,000 RARI |
| Max Supply | 25,000,000 RARI |
| Circulation Ratio | 72.49% |
| Market Capitalization | $3,872,646.24 |
| Fully Diluted Valuation | $5,342,500.00 |
| Total Holders | 24,455 |
Use Cases
-
Fee Distribution: Every trade on the NFT marketplace generates fees that are collected by the Foundation and distributed to users in $RARI.
-
Governance Participation: Holders can stake $RARI to delegate voting power and participate in ecosystem governance decisions.
-
Staking Rewards: Token holders can earn annual percentage yield (APY) through staking while maintaining governance rights.
II. Market Performance Analysis
Price Movement
| Time Period | Change | Absolute Change |
|---|---|---|
| 1 Hour | +1.13% | +$0.0024 |
| 24 Hours | +0.7% | +$0.0015 |
| 7 Days | -24.91% | -$0.0709 |
| 30 Days | -47.93% | -$0.1967 |
| 1 Year | -91.8% | -$2.3924 |
Price Extremes
| Metric | Value | Date |
|---|---|---|
| All-Time High | $46.7 | March 30, 2021 |
| All-Time Low | $0.191384 | December 19, 2025 |
| 24h High | $0.2543 | - |
| 24h Low | $0.2104 | - |
| Initial Launch Price | $0.515277 | - |
Trading Activity
| Metric | Value |
|---|---|
| 24h Trading Volume | $128,921.61 |
| Market Share | 0.00016% |
| Exchange Listings | 7 |
III. Competitive Position & Ecosystem
Market Positioning
RARI ranks #1,701 among cryptocurrencies by market capitalization, indicating a modest market position within the broader digital asset landscape. The token's dominance stands at 0.00016%, reflecting its minimal share of the total cryptocurrency market value.
Ecosystem Infrastructure
The Rarible ecosystem operates through:
- NFT Marketplace: Primary venue for trading digital assets
- Cross-Chain Rewards Program: Multi-chain incentive structure to promote ecosystem participation
- Community Governance: Decentralized decision-making through token holder voting
IV. Investment Strategy & Risk Management
Investment Methodologies
Long-Term Holding (HODL RARI)
- Suitable for investors with extended time horizons
- Aligned with staking opportunities and governance participation
- Benefits from potential protocol improvements and ecosystem expansion
Active Trading
- Requires technical analysis and market timing
- Dependent on monitoring trading volume and price volatility patterns
- Applicable for investors with higher risk tolerance
Risk Management Framework
Asset Allocation Considerations
- Conservative investors: 1-3% portfolio allocation maximum
- Moderate investors: 3-5% portfolio allocation
- Aggressive investors: 5-10% portfolio allocation
Risk Mitigation Strategies
- Diversification across multiple asset classes and sectors
- Dollar-cost averaging (DCA) approach for systematic entry
- Position sizing discipline aligned with individual risk tolerance
Security Best Practices
- Utilize hardware wallets for storing significant holdings
- Implement multi-signature security protocols for large amounts
- Maintain backup recovery phrases in secure locations
- Verify contract addresses before transactions
V. Investment Risks & Challenges
Market Risks
- Price Volatility: RARI exhibits extreme price fluctuations, declining 91.8% over the past year despite recent modest daily gains
- Limited Liquidity: $128,921.61 daily trading volume represents modest market depth
- Market Concentration: Only 7 exchange listings may constrain trading accessibility
Regulatory Risks
- Evolving regulatory frameworks across different jurisdictions may impact token utility and trading availability
- Classification uncertainty regarding governance tokens remains unresolved in many markets
Operational Risks
- Dependency on Rarible platform performance and user adoption
- Cross-chain functionality introduces technical complexity and potential security considerations
- Community governance mechanisms may face coordination challenges
VI. Conclusion: Is Rarible (RARI) a Good Investment?
Investment Value Summary
RARI represents a governance token tied to NFT marketplace infrastructure with participation incentives through staking and fee distribution. However, the token has experienced severe depreciation, declining from its $46.7 all-time high to current levels near all-time lows. Investors should carefully evaluate their risk tolerance and investment timeline before participation.
Investor Recommendations
✅ Newcomers: Consider dollar-cost averaging with small allocations; prioritize secure hardware wallet storage
✅ Experienced Investors: Implement technical analysis-based trading strategies; maintain disciplined position sizing within diversified portfolios
✅ Institutional Investors: Conduct comprehensive due diligence on protocol development roadmap and ecosystem adoption metrics before strategic allocation
⚠️ Important Disclaimer: Cryptocurrency investments carry substantial risk, including potential total loss of capital. This report is provided for informational purposes only and does not constitute investment advice. Conduct independent research and consult qualified financial advisors before making investment decisions.
Report Date: December 24, 2025 Data Last Updated: December 24, 2025, 08:17:36 UTC
Rarible (RARI) Frequently Asked Questions
I. What is Rarible (RARI) and what is its primary function?
Rarible (RARI) is the native governance token of the Rarible ecosystem, designed to power infrastructure for onchain commerce. The token is stewarded by the RARI Foundation on behalf of the community. Its primary functions include: (1) Fee distribution mechanism where transaction fees from the Rarible.com NFT marketplace are collected and distributed to users in RARI tokens, (2) Governance participation allowing token holders to delegate voting power, and (3) Staking rewards where holders can earn annual percentage yield (APY) while maintaining governance rights.
II. What is the current price and market status of RARI as of December 24, 2025?
As of December 24, 2025, RARI trades at $0.2137 USD with a market capitalization of approximately $3.87 million and a fully diluted valuation of $5.34 million. The token has a circulating supply of 18.12 million tokens out of a total supply of 25 million (72.49% circulation ratio). RARI ranks #1,701 among cryptocurrencies and represents 0.00016% of the total crypto market. The 24-hour trading volume stands at $128,921.61 across 7 exchange listings.
III. How has RARI performed historically, and what explains the significant price decline?
RARI reached an all-time high of $46.7 on March 30, 2021, but has since declined approximately 99.5%, trading near its all-time low of $0.191384 recorded on December 19, 2025. Over the past year, RARI has depreciated 91.8%, while the 30-day decline is 47.93%. This severe depreciation reflects broader NFT market weakness, limited institutional adoption, modest daily trading volume, and the speculative nature of governance tokens. However, the September 2025 transition to 100% fee buybacks and governance participation features provide some structural support.
IV. What are the key revenue mechanisms and utility of RARI tokens?
RARI tokens generate value through multiple mechanisms: (1) Fee distribution where every Rarible marketplace trade generates fees distributed to users in RARI, (2) Staking rewards allowing holders to earn APY while delegating voting power, (3) Governance participation enabling token holders to influence ecosystem decisions, and (4) Cross-chain rewards programs designed to promote long-term growth and deepen liquidity. The September 2025 implementation of 100% marketplace fee buybacks creates systematic token demand pressure through continuous repurchases.
V. What are the main investment risks associated with RARI?
Investment risks include: (1) Extreme price volatility with 91.8% annual depreciation, (2) Limited market liquidity with only $128,921.61 daily trading volume across 7 exchanges, (3) Modest market capitalization indicating limited institutional recognition or adoption, (4) Regulatory uncertainty regarding governance token classification across jurisdictions, (5) Operational dependency on Rarible platform performance and user adoption metrics, (6) Technical complexity associated with cross-chain functionality, and (7) Potential for further price deterioration given recent all-time lows.
VI. What are the price forecasts for RARI in the short, medium, and long term?
Short-term forecasts (2025): Conservative range of $0.1946–$0.2203; Neutral range of $0.2139–$0.2278; Optimistic range of $0.2278–$0.2432. Mid-term forecasts anticipate consolidation and gradual recovery through 2026–2028 with ranges of $0.1346–$0.2779 (2026) and $0.1832–$0.2871 (2027). Long-term scenarios for December 31, 2025 include: Base scenario of $0.2889–$0.3939 USD (steady ecosystem growth), Optimistic scenario of $0.4403–$0.5500 USD (accelerated NFT market expansion), and Risk scenario of $0.1200–$0.1800 USD (market contraction). By 2030, optimistic projections reach $0.4400 USD. Note: These forecasts carry significant uncertainty and may not materialize.
VII. What investment allocation strategy is recommended for RARI?
Conservative investors should limit RARI to 1–3% of portfolio allocation. Moderate investors may consider 3–5% allocation, while aggressive investors could allocate 5–10%. Recommended strategies include: (1) Dollar-cost averaging (DCA) for systematic entry, (2) Long-term holding aligned with staking opportunities and governance participation, (3) Active trading for investors with higher risk tolerance and technical analysis capabilities, and (4) Rigorous position sizing discipline aligned with individual risk tolerance. Diversification across multiple asset classes and thorough due diligence remain essential before investment decisions.
VIII. What security best practices should RARI token holders implement?
RARI token holders should implement comprehensive security measures including: (1) Utilizing hardware wallets for storing significant holdings rather than exchange-based wallets, (2) Implementing multi-signature security protocols for large amounts, (3) Maintaining backup recovery phrases in secure offline locations, (4) Verifying smart contract addresses before executing transactions to prevent phishing, (5) Enabling two-factor authentication on exchange accounts, and (6) Conducting regular security audits of holdings. For institutional investors, additional protocols including cold storage arrangements and custodial solutions are recommended.
Disclaimer: This FAQ is provided for informational purposes only and does not constitute investment advice or recommendations. Cryptocurrency markets are highly volatile and speculative. Past performance does not guarantee future results. All price predictions carry significant uncertainty. Investors must conduct independent research and consult qualified financial advisors before making investment decisions. The information provided reflects data as of December 24, 2025, and market conditions may change substantially.
Share
How to Buy Cryptocurrency


Trending Cryptocurrencies


Is ApeCoin (APE) a good investment?: Analyzing the potential and risks of the Bored Ape Yacht Club's cryptocurrency

Is ApeCoin (APE) a good investment?: Analyzing the potential and risks of the Bored Ape ecosystem token

BPT vs MANA: Comparing Two Leading Cryptocurrencies in the Metaverse Space
Is SpaceN (SN) a good investment?: A Comprehensive Analysis of Risk, Potential Returns, and Market Outlook for 2024

Is ARTEM Coin (ARTEM) a good investment?: Analyzing the Potential and Risks of This Emerging Cryptocurrency

2025 ARTEM Price Prediction: Bullish Trends and Key Factors Driving Growth
How does macroeconomic policy impact cryptocurrency prices in 2026: Fed policy, inflation data, and stock market correlation explained
What is FLOKI market overview: price, market cap ranking, trading volume and liquidity in 2026?
What Are the Key Derivatives Market Signals for Crypto: Open Interest, Funding Rates, and Liquidation Data Explained?
What Is XLM Community and Ecosystem Activity: Twitter Followers, Developer Contributions, and DApp Growth in 2026?
How to Analyze On-Chain Data: Active Address Count, Transaction Volume, Whale Distribution, and Fee Trends in 2026