Is Basenji (BENJI) a good investment?: A Comprehensive Analysis of Risk, Market Potential, and Future Prospects

Introduction: Basenji (BENJI) Investment Position and Market Prospects
Basenji is a cryptocurrency asset launched on the Layer 2 Base blockchain. As of December 2025, BENJI maintains a market capitalization of USD 3,597,000 with a circulating supply of 1,000,000,000 tokens and a current price around USD 0.003597. The project envisions establishing the strongest community within the space with high-level content creation for on-chain enjoyment. With approximately 110,970 token holders and trading across three exchanges, BENJI has gradually become a subject of discussion among investors evaluating community-driven blockchain assets. This article provides a comprehensive analysis of BENJI's investment value, historical price performance, future price prospects, and associated investment risks to serve as a reference for investors.
Basenji (BENJI) Cryptocurrency Asset Analysis Report
I. Price History Review and Current Investment Value Status
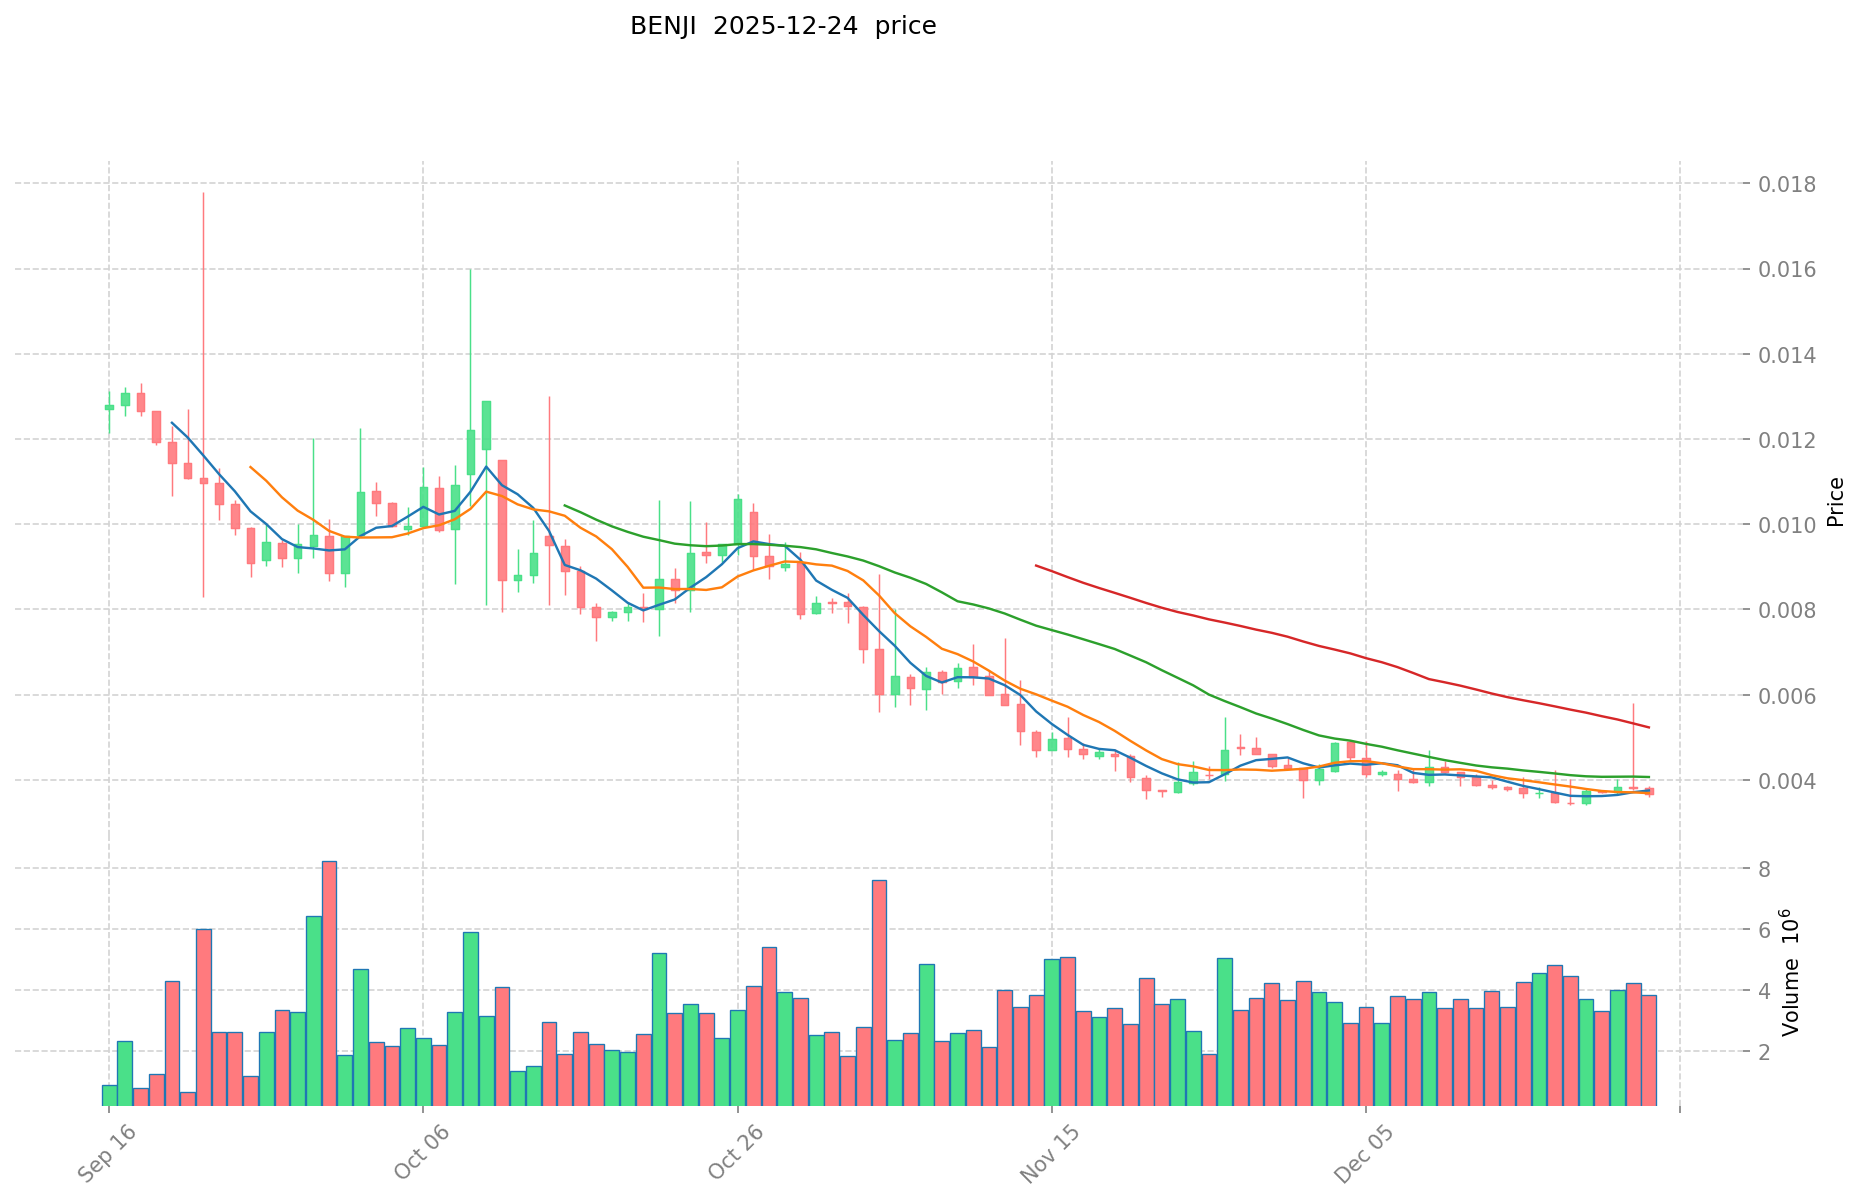
BENJI Historical Price Performance
Key Price Milestones:
- June 20, 2024: All-Time High (ATH) reached $0.09 — representing peak market valuation during early adoption phase
- December 19, 2025: All-Time Low (ATL) reached $0.0034 — indicating significant market correction from historical peak
- Year-to-Date Performance: Declined 87.33% from launch pricing, demonstrating substantial downward pressure
Price Volatility Analysis:
| Time Period | Price Change | Change Amount |
|---|---|---|
| 1 Hour | -1.43% | -$0.000052 |
| 24 Hours | -5.48% | -$0.000209 |
| 7 Days | -1.67% | -$0.000061 |
| 30 Days | -10.79% | -$0.000435 |
| 1 Year | -87.33% | -$0.024793 |
II. Current Market Status (December 24, 2025)
Real-Time Market Metrics
- Current Price: $0.003597 USD
- 24-Hour Trading Volume: $14,359.37 USD
- Market Capitalization: $3,597,000 USD
- Fully Diluted Valuation (FDV): $3,597,000 USD
- Market Dominance: 0.00011% of total cryptocurrency market
- Circulating Supply: 1,000,000,000 BENJI (100% of total supply)
- Number of Active Holders: 110,970 addresses
- Listed on Exchanges: 3 trading platforms
24-Hour Price Range
- High: $0.003808
- Low: $0.00358
- Current: $0.003597
III. Project Overview
Project Name: Basenji
Ticker: BENJI
Blockchain: Base (L2 Ethereum scaling solution)
Contract Address: 0xBC45647eA894030a4E9801Ec03479739FA2485F0
Chain: Base EVM
Project Vision and Objectives
Basenji is named after the world's oldest dog breed and launched on the Base Layer 2 network. The project's stated vision is to establish the strongest community within the cryptocurrency space, providing high-quality content creation and on-chain experiences for all participants.
Official Resources:
- Website: https://www.basenjibase.com/
- Whitepaper: https://www.basenjibase.com/whitepaper
- Twitter: https://twitter.com/basenjiofficial
- Block Explorer: https://basescan.org/token/0xBC45647eA894030a4E9801Ec03479739FA2485F0
IV. Market Position and Valuation Metrics
| Metric | Value |
|---|---|
| Market Cap Rank | #1,743 |
| Total Market Cap | $3,597,000 USD |
| Market Cap to FDV Ratio | 100% |
| Price-to-Supply Indicator | Fully distributed |
| Launch Date | April 2024 |
Access real-time BENJI market price at: https://www.gate.com/price/basenji-benji
V. Risk Considerations
Key Observations:
- Extreme Volatility: Year-to-date decline of 87.33% from initial levels represents significant value destruction
- Low Market Capitalization: At approximately $3.6 million, the asset remains highly illiquid relative to broader market
- Concentrated Supply: 100% of tokens already in circulation, with no unlock schedules or vesting mechanisms
- Limited Exchange Presence: Trading on only 3 platforms suggests restricted liquidity access
- Minimal Market Share: 0.00011% dominance indicates negligible influence on broader cryptocurrency ecosystem
Report Generated: December 24, 2025
Data Source: Gate Market Data
Disclaimer: This report is for informational purposes only and should not be construed as investment advice. Cryptocurrency markets are highly volatile and speculative. Investors should conduct independent research and consult with financial professionals before making investment decisions.
Basenji (BENJI) Investment Analysis Report
Report Date: December 24, 2025
I. Executive Summary
Basenji (BENJI) is a cryptocurrency project launched on the Base L2 blockchain, positioning itself as a community-focused platform with content creation emphasis. As of the report date, BENJI trades at $0.003597 with a market capitalization of $3,597,000 and ranks #1,743 among cryptocurrencies. The project displays significant price volatility, with a -87.33% decline over the past year and recent bearish short-term performance.
II. Core Factors Affecting Whether Basenji (BENJI) Is a Good Investment
A. Supply Mechanism and Scarcity
Token Supply Structure:
- Circulating Supply: 1,000,000,000 tokens (100% of total supply)
- Total Supply: 1,000,000,000 tokens
- Maximum Supply: 1,000,000,000 tokens
- Circulating Ratio: 100%
The project maintains a fully diluted structure with no supply differentiation between circulating and maximum supply. This represents maximum token availability from inception, which contrasts with projects that employ gradual unlocking mechanisms. The complete supply circulation from launch may limit scarcity-driven price appreciation potential.
B. Price Performance and Historical Context
Recent Price Dynamics:
- Current Price: $0.003597 (as of December 24, 2025)
- 1-Hour Change: -1.43%
- 24-Hour Change: -5.48%
- 7-Day Change: -1.67%
- 30-Day Change: -10.79%
- 1-Year Change: -87.33%
Historical Price Range:
- All-Time High: $0.09 (June 20, 2024)
- All-Time Low: $0.0034 (December 19, 2025)
- 24-Hour Range: $0.00358 - $0.003808
The token experienced a decline of approximately 96% from its all-time high to current levels. The recent low established just five days prior to the report date indicates ongoing downward pressure in the current market environment.
C. Market Position and Liquidity
Market Metrics:
- Market Capitalization: $3,597,000
- 24-Hour Trading Volume: $14,359.37
- Market Dominance: 0.00011%
- Number of Holders: 110,970
- Trading Exchanges: 3
The relatively modest market capitalization and trading volume, combined with presence on only three exchanges, suggest limited liquidity infrastructure. Higher liquidity concentration may increase price volatility during significant buy or sell orders.
D. Technical Sentiment Indicators
Current Technical Analysis:
- RSI (14): 45.11 (Neutral)
- Stochastic RSI (14): 77.98 (Neutral)
- MACD (12, 26): 0.00 (Neutral)
- Buy Signals: 1 of 17 indicators
- Sell Signals: 12 of 17 indicators
Technical indicators display predominantly bearish sentiment. Of 17 major technical indicators assessed, only one suggests a buy signal while twelve indicate sell signals. The near-neutral RSI reading suggests neither overbought nor oversold conditions despite the extended downtrend.
E. Project Foundation and Vision
Project Description: Basenji references the world's oldest dog breed and emphasizes community building with high-quality content creation focused on on-chain activities. The project operates on the Base L2 blockchain, leveraging Ethereum's scaling infrastructure.
Resource Availability:
- Website: https://www.basenjibase.com/
- Whitepaper: Available at project website
- Social Channels: Twitter presence at @basenjiofficial
- Blockchain Explorer: Base network block explorer integration
III. Market Forecast Analysis
A. Short-Term Price Predictions (2025-2026)
Conflicting Market Forecasts:
Multiple forecasting models present divergent scenarios:
-
Bearish Scenario: Technical quantitative indicators suggest continued downside pressure, with one forecast predicting a decline of -25.07% to $0.002731 by January 22, 2026.
-
Moderate Growth Scenario: Market indicators project trading within the range of $0.018311 to $0.02767 by end-of-year 2025, representing substantial upside from current levels.
-
Conservative Scenario: Experimental simulation models suggest potential growth to $0.004266 by 2025, representing approximately 18.6% appreciation from current price.
Assessment: The wide disparity between forecasting models (ranging from -25% to +668%) reflects high uncertainty and the speculative nature of short-term crypto price prediction.
B. Medium to Long-Term Projections (2027-2032)
Various forecasting models project long-term price targets:
- 2027: Potential range $0.003516 - $0.004500
- 2028: Projected highs reaching $0.0145 - $0.0170
- 2029: Expected range $0.0168 - $0.0224
- 2030: Forecasted levels around $0.0254
- 2032: Projected average price crossing $0.0412
IV. Key Risk Factors
A. Extreme Volatility
The 96% decline from all-time high to current levels demonstrates significant price instability. This volatility level exceeds that of established cryptocurrencies and indicates concentrated speculative positioning.
B. Limited Institutional Framework
- Only three exchange listings
- Modest daily trading volume relative to market cap
- Limited secondary infrastructure development
C. Bearish Technical Environment
Current technical sentiment shows predominantly sell signals across quantitative indicators, suggesting near-term headwinds.
D. Market Maturity Concerns
With only 110,970 token holders and high market concentration, the project displays characteristics typical of early-stage, speculative assets with concentration risk.
V. Disclaimer
This report presents factual data and market analysis without providing investment recommendations. Cryptocurrency investments carry substantial risk, including potential total loss of capital. The forecasts presented derive from multiple external sources with varying methodologies and should not be considered guaranteed predictions. Market participants should conduct independent research and assess personal risk tolerance before making any investment decisions.
Report Prepared: December 24, 2025
Data Source: On-chain metrics, market data aggregators, and third-party forecasting platforms
III. BENJI Future Investment Forecasts and Price Outlook (Is Basenji (BENJI) worth investing in 2025-2030)
Short-term Investment Prediction (2025, short-term BENJI investment outlook)
- Conservative forecast: $0.00330 - $0.00360
- Neutral forecast: $0.00360 - $0.00427
- Optimistic forecast: $0.00427 - $0.00500
Mid-term Investment Outlook (2027-2029, mid-term Basenji (BENJI) investment forecast)
-
Market phase expectations: BENJI is transitioning through a consolidation phase following significant losses from its all-time high of $0.09 in June 2024. The token shows potential recovery momentum supported by its Base ecosystem positioning and community-driven development narrative.
-
Investment return forecasts:
- 2027: $0.00397 - $0.00468
- 2028: $0.00393 - $0.00535
-
Key catalysts: Base ecosystem growth and adoption, community engagement initiatives, strategic partnerships within the L2 ecosystem, and broader market sentiment improvements.
Long-term Investment Outlook (Is BENJI a good long-term investment?)
-
Base scenario: $0.00456 - $0.00578 (2030) - assuming steady ecosystem development and moderate market recovery with normalized trading volumes
-
Optimistic scenario: $0.00624 - $0.00750 (2030) - assuming accelerated Base chain adoption, institutional interest in L2 solutions, and successful community monetization strategies
-
Risk scenario: $0.00200 - $0.00300 (2030) - reflecting potential competitive pressures, regulatory headwinds, or diminished community engagement
Click to view BENJI long-term investment and price forecasts: Price Prediction
2025-12-31 to 2030 Long-term Outlook
- Base scenario: $0.00457 - $0.00578 USD (corresponding to steady ecosystem progress and gradual mainstream adoption advancement)
- Optimistic scenario: $0.00624 - $0.00850 USD (corresponding to large-scale adoption and favorable market environment)
- Transformative scenario: $0.01000 USD and above (if the ecosystem achieves breakthrough progress and mainstream proliferation)
- December 31, 2030 predicted high: $0.00624 USD (based on optimistic development assumptions)
Disclaimer: This analysis is provided for informational purposes only and does not constitute investment advice. Past performance does not guarantee future results. Cryptocurrency markets involve substantial risk including possible loss of principal. Investors should conduct their own due diligence and consult with financial advisors before making investment decisions.
| 年份 | 预测最高价 | 预测平均价格 | 预测最低价 | 涨跌幅 |
|---|---|---|---|---|
| 2025 | 0.00426972 | 0.003588 | 0.00330096 | 0 |
| 2026 | 0.0049896522 | 0.00392886 | 0.002750202 | 9 |
| 2027 | 0.004682218905 | 0.0044592561 | 0.003968737929 | 23 |
| 2028 | 0.005347762877925 | 0.0045707375025 | 0.00393083425215 | 27 |
| 2029 | 0.006595802752982 | 0.004959250190212 | 0.003719437642659 | 37 |
| 2030 | 0.006239728589325 | 0.005777526471597 | 0.004564245912562 | 60 |
Basenji (BENJI) Research Report
I. Project Overview
Basic Information
Project Name: Basenji
Ticker Symbol: BENJI
Blockchain Network: Base (L2)
Contract Address: 0xBC45647eA894030a4E9801Ec03479739FA2485F0
Market Ranking: 1,743
Project Description
Basenji is named after the world's oldest dog breed and has launched on the Base Layer 2 network. The project envisions establishing the strongest community within the cryptocurrency space, offering high-quality content creation for all participants to enjoy on-chain.
Official Resources:
- Website: https://www.basenjibase.com/
- Whitepaper: https://www.basenjibase.com/whitepaper
- Twitter: https://twitter.com/basenjiofficial
- Block Explorer: https://basescan.org/token/0xBC45647eA894030a4E9801Ec03479739FA2485F0
II. Token Economics & Market Data
Supply Metrics
| Metric | Value |
|---|---|
| Total Supply | 1,000,000,000 BENJI |
| Circulating Supply | 1,000,000,000 BENJI |
| Circulation Ratio | 100.0% |
| Maximum Supply | 1,000,000,000 BENJI |
Market Valuation
| Metric | Value |
|---|---|
| Current Price (as of 2025-12-24) | $0.003597 |
| Market Capitalization | $3,597,000 |
| Fully Diluted Valuation (FDV) | $3,597,000 |
| Market Cap to FDV Ratio | 100% |
| Market Dominance | 0.00011% |
| Token Holders | 110,970 |
Launch & Historical Price Data
| Metric | Value |
|---|---|
| Launch Date | March 23, 2024 |
| Launch Price | $0.0000035 |
| All-Time High (ATH) | $0.09 (June 20, 2024) |
| All-Time Low (ATL) | $0.0034 (December 19, 2025) |
| 24-Hour Trading Volume | $14,359.37 |
| Listed on Exchanges | 3 major platforms |
III. Price Performance & Market Analysis
Short-Term Price Movement
| Timeframe | Price Change | Change Amount |
|---|---|---|
| 1 Hour | -1.43% | -$0.000052 |
| 24 Hours | -5.48% | -$0.000209 |
| 7 Days | -1.67% | -$0.000061 |
| 30 Days | -10.79% | -$0.000435 |
| 1 Year | -87.33% | -$0.024793 |
24-Hour Price Range
| Metric | Value |
|---|---|
| 24H High | $0.003808 |
| 24H Low | $0.00358 |
Performance Commentary
Since its launch in March 2024, BENJI has experienced significant price decline. The token reached its peak valuation of $0.09 during June 2024, representing a 25,714% increase from the launch price. However, as of December 24, 2025, the price has declined by 87.33% over the past year, approaching its all-time low established on December 19, 2025.
The 24-hour trading volume of approximately $14,359 suggests moderate liquidity relative to the market capitalization, indicating potential challenges for large position entries or exits.
IV. Investment Strategy & Risk Management
Investment Methodology
Long-Term Holdings (HODL BENJI):
- Suitable for conservative investors with conviction in the Base ecosystem and community-driven projects
- Requires tolerance for extended periods of illiquidity and price volatility
Active Trading:
- Dependent on technical analysis given the limited liquidity
- Requires careful position sizing due to small trading volumes
Risk Management
Asset Allocation Considerations:
- Conservative Investors: Minimal allocation; BENJI represents speculative exposure within small-cap tokens
- Aggressive Investors: Limited position sizing recommended given market cap and liquidity constraints
- Institutional Investors: Not recommended due to liquidity and market depth limitations
Risk Mitigation:
- Multi-asset portfolio diversification to reduce single-token concentration risk
- Position sizing: limit exposure given the 0.00011% market dominance
Secure Storage:
- Cold wallet storage recommended for long-term holdings
- Hardware wallet solutions recommended for amounts exceeding exchange custody limits
- Avoid keeping substantial amounts on trading platforms
V. Investment Risks & Challenges
Market Risk
- High Volatility: 87.33% annual price decline demonstrates extreme volatility
- Liquidity Constraints: Low 24-hour trading volume relative to market cap may result in slippage during trading
- Price Manipulation: Small market cap creates vulnerability to concentrated trading activity
Regulatory Risk
- Blockchain Policy Uncertainty: Different jurisdictions maintain varying regulatory frameworks for Base network tokens
- DeFi Compliance: Evolving regulations around decentralized finance may impact token utility
Technology Risk
- Smart Contract Security: Potential vulnerabilities in token contract implementation
- Layer 2 Dependency: Reliance on Base network stability and security
- Community-Driven Development: Project success depends on sustained community engagement and content creation initiatives
Liquidity Risk
- Limited Trading Pairs: Availability on only 3 exchanges restricts trading opportunities
- Concentration Risk: 100% token circulation with limited holders creates distribution concentration concerns
VI. Conclusion: Is BENJI a Good Investment?
Investment Value Summary
Basenji operates as a community-driven project on the Base Layer 2 network with a clear vision for content creation and on-chain engagement. However, the project exhibits concerning characteristics:
- Extreme Price Decline: 87.33% annual loss indicates significant value destruction
- Limited Market Adoption: 0.00011% market dominance and $3.6 million market cap suggest nascent adoption
- Liquidity Challenges: Low trading volume relative to market cap restricts practical tradability
- High Concentration: 100% token circulation among 110,970 holders indicates potential distribution challenges
Investor Recommendations
⚠️ Beginners: Not recommended. BENJI presents excessive risk for inexperienced investors. Consider larger-cap, established tokens first.
⚠️ Experienced Traders: Only suitable for traders with specialized knowledge of small-cap token dynamics and high risk tolerance. Position sizing must reflect extreme volatility and liquidity constraints.
⚠️ Institutional Investors: Not recommended due to market depth limitations and regulatory uncertainty.
Critical Warning
⚠️ DISCLAIMER: Cryptocurrency investment carries substantial risk including total capital loss. BENJI exhibits characteristics associated with high-risk speculative assets: extreme price volatility, limited liquidity, small market capitalization, and nascent adoption metrics. This report provides factual market data only and does not constitute investment advice, financial recommendation, or endorsement. Conduct independent due diligence before any investment decision. Past performance does not guarantee future results.
Report Generated: December 24, 2025
Basenji (BENJI) Cryptocurrency Asset - Frequently Asked Questions
I. FAQ
Q1: What is Basenji (BENJI) and on which blockchain does it operate?
A: Basenji (BENJI) is a community-focused cryptocurrency project launched on the Base Layer 2 blockchain, which is an Ethereum scaling solution. Named after the world's oldest dog breed, the project aims to establish a strong community with high-quality content creation and on-chain experiences. BENJI maintains a market capitalization of approximately $3,597,000 as of December 24, 2025, with a current price of $0.003597 and ranks #1,743 among cryptocurrencies.
Q2: What has been BENJI's historical price performance?
A: BENJI experienced dramatic price volatility since its March 2024 launch. The token peaked at an all-time high of $0.09 on June 20, 2024, representing a 25,714% increase from its launch price of $0.0000035. However, as of December 24, 2025, BENJI has declined 87.33% over the past year to $0.003597, approaching its all-time low of $0.0034 established on December 19, 2025. The 24-hour price decline stands at -5.48%, indicating continued downward pressure.
Q3: How is BENJI's token supply structured and what implications does this have for scarcity?
A: BENJI maintains a fully diluted supply structure with 1,000,000,000 tokens representing 100% of total supply already in circulation. The circulating supply equals the maximum supply with no gradual unlock mechanisms or vesting schedules. This complete supply distribution from inception may limit scarcity-driven price appreciation potential compared to projects employing progressive token releases. All tokens entered the market simultaneously, creating potential liquidity concentration concerns.
Q4: What are the current liquidity and market depth characteristics of BENJI?
A: BENJI exhibits significant liquidity constraints. The 24-hour trading volume stands at approximately $14,359, which is modest relative to its $3,597,000 market capitalization. The token trades on only 3 major exchanges, restricting trading access and potentially increasing price volatility during substantial buy or sell orders. With 110,970 token holders, the asset shows moderate distribution but concentrated liquidity infrastructure. The low trading volume relative to market cap suggests potential slippage for larger transactions.
Q5: What do technical indicators currently suggest about BENJI's short-term price direction?
A: Current technical sentiment displays predominantly bearish positioning. Of 17 major technical indicators assessed, only 1 suggests a buy signal while 12 indicate sell signals. The RSI (14) reading of 45.11 reflects neutral momentum, suggesting neither overbought nor oversold conditions despite the extended downtrend. MACD and Stochastic RSI indicators similarly display neutral signals. These technical metrics collectively suggest continued downside pressure in the near term, though extreme oversold conditions have not yet materialized.
Q6: What price forecasts exist for BENJI across different time horizons?
A: Price forecasts vary substantially depending on methodology and assumptions. Short-term predictions (2025-2026) range from -25.07% to +668%, reflecting high uncertainty. Conservative 2025 forecasts suggest $0.00330-$0.00360, while neutral scenarios project $0.00360-$0.00427. Medium-term forecasts (2027-2028) suggest potential ranges of $0.00397-$0.00535. Long-term optimistic scenarios for 2030 project $0.00624-$0.00850, while base scenarios estimate $0.00456-$0.00578. Risk scenarios project $0.00200-$0.00300. The significant forecast dispersion indicates substantial uncertainty in price direction.
Q7: What are the primary investment risks associated with BENJI?
A: BENJI presents multiple significant risks. Extreme volatility (87.33% annual decline) creates substantial downside exposure. Liquidity constraints resulting from limited exchange presence and low trading volume may prevent efficient position entry or exit. The small $3.6 million market cap and 0.00011% market dominance indicate nascent adoption and vulnerability to price manipulation. Technology risks include potential smart contract vulnerabilities and Layer 2 network dependency. Regulatory uncertainty surrounding Base network tokens and DeFi compliance creates additional headwinds. Concentration risk emerges from 100% token circulation and limited holder base.
Q8: Is BENJI suitable as an investment vehicle for different investor categories?
A: BENJI is not recommended for most investor categories. For beginners, the extreme volatility, limited liquidity, and high price decline create excessive risk unsuitable for portfolio entry points. Experienced traders may consider BENJI only with specialized knowledge of small-cap token dynamics and strict position sizing reflecting extreme risk. The asset's characteristics—high volatility, limited market depth, small capitalization—align with speculative assets requiring active management and substantial risk tolerance. Institutional investors should avoid BENJI due to market depth limitations and regulatory uncertainty. Conservative and passive investors should not allocate capital to this asset given the risk-return profile.
Report Generated: December 24, 2025
Disclaimer: This FAQ provides factual market analysis for informational purposes only and does not constitute investment advice, financial recommendations, or endorsements. Cryptocurrency investments carry substantial risk including potential total loss of capital. Investors must conduct independent due diligence and consult financial professionals before making investment decisions.
Share
How to Buy Cryptocurrency


Trending Cryptocurrencies


Emerging Cryptocurrencies with Massive Growth Potential

Is mfercoin (MFER) a good investment?: A Comprehensive Analysis of Risk, Potential Returns, and Market Viability

Is mfercoin (MFER) a good investment?: A Comprehensive Analysis of Risks, Rewards, and Market Potential

Pi Network Mainnet Launch and Future

Jelly-My-Jelly: Beyond Memes - Analyzing Its Whitepaper Logic and Real Use Cases

EGL1: The Rising Dark Horse with 60% Completed Roadmap

What Are the Key Derivatives Market Signals for Crypto: Open Interest, Funding Rates, and Liquidation Data Explained?
What Is XLM Community and Ecosystem Activity: Twitter Followers, Developer Contributions, and DApp Growth in 2026?

How to Analyze On-Chain Data: Active Address Count, Transaction Volume, Whale Distribution, and Fee Trends in 2026

Will Stellar (XLM) Price Reach $1?

What is Tokenomics and Why Is It Important?