2025 XFI Price Prediction: Expert Analysis and Market Outlook for the Coming Year
Introduction: Market Position and Investment Value of XFI
CrossFi (XFI) is a groundbreaking blockchain solution designed to bridge fiat and cryptocurrency seamlessly through innovative non-custodial payment technology. Since its launch in September 2024, CrossFi has established itself as a notable player in the blockchain ecosystem, currently ranked 1,747 by market capitalization. As of December 24, 2025, XFI's market capitalization stands at approximately $3.58 million, with a circulating supply of 42.25 million tokens and a price trading around $0.08464. This pioneering asset, recognized for enabling "true financial freedom and inclusivity," is increasingly playing a crucial role in connecting decentralized finance with traditional payment systems.
This article will comprehensively analyze XFI's price trajectory through 2025-2030, integrating historical performance patterns, market supply-demand dynamics, ecosystem development, and macroeconomic factors to provide investors with professional price forecasts and practical investment strategies. By examining both the project's foundational strengths and current market challenges, we aim to equip stakeholders with the insights necessary to navigate this emerging digital asset effectively.
CrossFi (XFI) Market Analysis Report
I. XFI Price History Review and Current Market Status
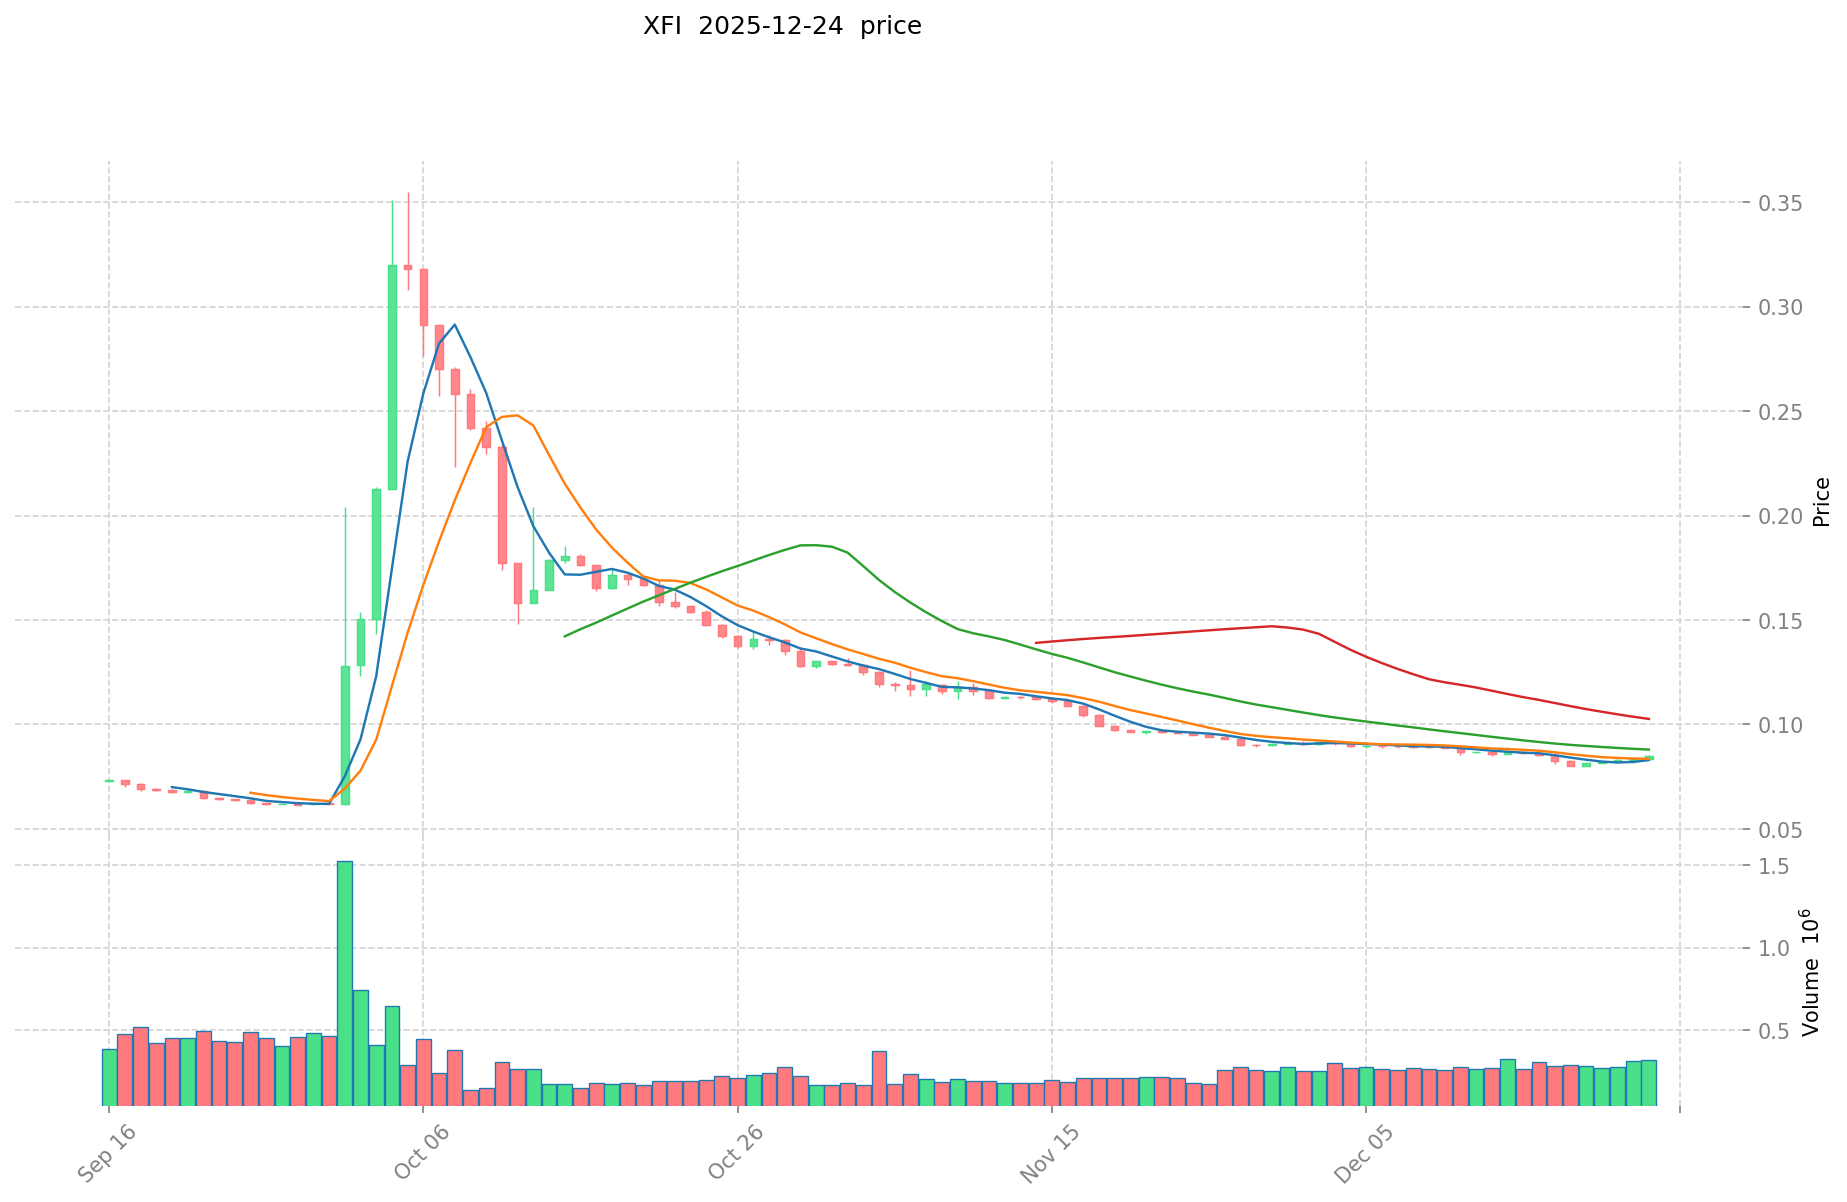
XFI Historical Price Trajectory
-
November 2024: XFI reached its all-time high of $1.12 on November 21, 2024, marking the peak of its market performance during this period.
-
August 2025: XFI declined to its all-time low of $0.04944 on August 31, 2025, representing a significant downturn from previous highs.
-
December 2024 - Present: XFI has recovered from its lows and is currently trading at $0.08464 as of December 24, 2025, showing a 70.9% decline from its all-time high.
XFI Current Market Status
XFI is currently ranked #1747 in market capitalization across all cryptocurrencies, with the following key metrics:
Price Performance:
- Current Price: $0.08464
- 24-Hour Change: +0.67%
- 7-Day Change: -0.61%
- 30-Day Change: -11.76%
- 1-Year Change: -86.7%
Market Capitalization Metrics:
- Market Cap: $3,576,345.55
- Fully Diluted Valuation (FDV): $32,030,484.48
- Market Cap/FDV Ratio: 11.17%
- Market Dominance: 0.0010%
Supply Information:
- Circulating Supply: 42,253,610 XFI (11.17% of total supply)
- Total Supply: 378,432,000 XFI
- Max Supply: 378,432,000 XFI
Trading Activity:
- 24-Hour Trading Volume: $26,612.34
- 24-Hour High: $0.0853
- 24-Hour Low: $0.08353
- Available on 5 exchanges
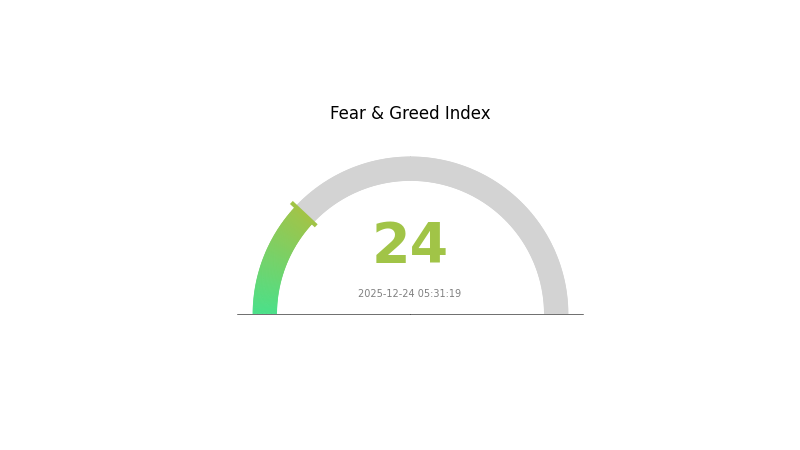
Market Sentiment: The current market sentiment indicates "Extreme Fear" with a VIX reading of 24, reflecting heightened market anxiety and pessimistic investor outlook.
Click to view current XFI market price
XFI Market Sentiment Index
2025-12-24 Fear and Greed Index: 24 (Extreme Fear)
Click to view current Fear & Greed Index
The crypto market is experiencing extreme fear as the Fear and Greed Index drops to 24. This level typically indicates severe market pessimism, with investors showing heightened anxiety and risk aversion. Such extreme fear periods often present contrarian opportunities for long-term investors, as assets are heavily discounted. Market participants should remain cautious and monitor key support levels. Risk management remains crucial during volatile periods. Consider diversifying your portfolio on Gate.com to navigate current market conditions effectively.
XFI Holdings Distribution
The holdings distribution chart represents the concentration of XFI tokens across different wallet addresses on the blockchain. This metric provides crucial insights into the token's decentralization level, market structure stability, and potential vulnerability to price manipulation. By analyzing the percentage of tokens held by top addresses, investors and analysts can assess whether token ownership is distributed among a diverse set of participants or concentrated within a small number of holders.
Click to view current XFI holdings distribution
Without specific data entries in the provided table, a comprehensive analysis of XFI's current concentration characteristics cannot be completed at this time. However, the absence of visible top holder information suggests either an exceptionally well-distributed token structure or a data collection limitation. To properly evaluate whether XFI exhibits excessive concentration, detailed information on the top 10-100 addresses and their respective holdings percentages would be required. Such data would reveal whether a small number of whale addresses control a disproportionate share of the token supply, which could indicate potential risks for retail investors through possible coordinated selling or price manipulation.
The on-chain holder distribution directly impacts market dynamics and price stability. A highly concentrated distribution typically increases volatility risk and creates conditions for potential market manipulation, while a more dispersed holder base generally indicates stronger decentralization and more resilient price action. The current XFI holder structure, once properly documented, will serve as a key indicator of the token's maturity and institutional adoption level, reflecting the overall health and trustworthiness of its blockchain-based ecosystem.

| Top | Address | Holding Qty | Holding (%) |
|---|
II. Core Factors Impacting XFI's Future Price
Macroeconomic Environment
-
Monetary Policy Impact: Interest rate policies represent a primary driver of XFI's price movements. As global central banks adjust their monetary stances, shifts in interest rate expectations directly influence cryptocurrency valuations and investor risk appetite.
-
Inflation Trends: Broader inflationary trends impact XFI's price trajectory as part of the wider cryptocurrency market landscape affected by macroeconomic conditions.
Regulatory Compliance and Market Positioning
- Global Regulatory Framework: As major global economies continue to establish regulatory frameworks for blockchain technology, CrossFi's proactive compliance approach positions it favorably relative to competitors, potentially supporting long-term price stability and institutional adoption.
Market Sentiment
- Investor Confidence: Market sentiment and investor confidence have direct impacts on XFI's price movements. Shifts in trader psychology and risk perception can trigger significant price reversals and market movements, as evidenced by candlestick pattern analysis indicating market hesitation and potential turning points.
Three, 2025-2030 XFI Price Forecast
2025 Outlook
- Conservative Prediction: $0.07958 - $0.08466
- Neutral Prediction: $0.08466 - $0.09651
- Optimistic Prediction: $0.09651 (requires sustained market momentum and positive ecosystem developments)
2026-2028 Medium-term Outlook
- Market Stage Expectation: Gradual recovery phase with consolidation patterns, characterized by incremental growth as the project gains traction and market adoption expands.
- Price Range Forecasts:
- 2026: $0.06522 - $0.09964 (7% projected increase)
- 2027: $0.07039 - $0.13316 (12% projected increase)
- 2028: $0.09131 - $0.13354 (34% projected increase)
- Key Catalysts: Protocol upgrades, increased institutional adoption, expansion of use cases within the ecosystem, and overall cryptocurrency market sentiment improvements.
2029-2030 Long-term Outlook
- Base Case: $0.1065 - $0.14489 (46% projected growth by 2029), evolving to $0.1169 - $0.19886 (58% projected growth by 2030) assuming steady ecosystem development and moderate market conditions.
- Optimistic Case: $0.15000 - $0.18000 (assuming successful major partnership announcements and significant mainstream adoption milestones).
- Transformative Case: $0.20000+ (contingent upon breakthrough technological innovations, widespread institutional integration, and favorable macroeconomic conditions).
Note: All price forecasts are subject to market volatility and should be monitored regularly through platforms like Gate.com. Investors should conduct independent research and consider their risk tolerance before making investment decisions.
| 年份 | 预测最高价 | 预测平均价格 | 预测最低价 | 涨跌幅 |
|---|---|---|---|---|
| 2025 | 0.09651 | 0.08466 | 0.07958 | 0 |
| 2026 | 0.09964 | 0.09059 | 0.06522 | 7 |
| 2027 | 0.13316 | 0.09512 | 0.07039 | 12 |
| 2028 | 0.13354 | 0.11414 | 0.09131 | 34 |
| 2029 | 0.14489 | 0.12384 | 0.1065 | 46 |
| 2030 | 0.19886 | 0.13437 | 0.1169 | 58 |
CrossFi (XFI) Professional Investment Strategy and Risk Management Report
I. XFI Market Overview
Current Market Status
As of December 24, 2025, CrossFi (XFI) demonstrates the following market characteristics:
- Current Price: $0.08464
- 24-Hour Change: +0.67%
- Market Capitalization: $3,576,345.55
- Fully Diluted Valuation: $32,030,484.48
- 24-Hour Trading Volume: $26,612.34
- Circulating Supply: 42,253,610 XFI (11.17% of total supply)
- Total/Maximum Supply: 378,432,000 XFI
- Market Ranking: #1747
- Market Dominance: 0.0010%
Price Performance Analysis
XFI exhibits mixed performance across different timeframes:
- 1-Hour Change: +0.08%
- 7-Day Change: -0.61%
- 30-Day Change: -11.76%
- 1-Year Change: -86.7%
- All-Time High: $1.12 (November 21, 2024)
- All-Time Low: $0.04944 (August 31, 2025)
- 24-Hour Range: $0.08353 - $0.0853
II. CrossFi Project Fundamentals
Project Overview
CrossFi Chain is a groundbreaking blockchain solution designed to bridge the gap between fiat and cryptocurrency seamlessly. The platform offers an inclusive, next-generation approach to financial services with emphasis on accessibility and transparency.
Core Technology Features
Non-Custodial Payment Technology: CrossFi implements innovative non-custodial payment mechanisms that enable users to maintain full control of their funds while accessing decentralized financial services.
Key Value Propositions:
- Full user control of digital assets
- Seamless fiat-crypto integration
- Enhanced transparency and accessibility
- Inclusive financial services for all users
- True financial freedom
Official Resources
- Website: https://crossfi.org/
- Explorer: https://xfiscan.com
- Twitter: https://x.com/crossfichain
- White Paper: https://crossfi.org/documents/
III. XFI Professional Investment Strategy and Risk Management
XFI Investment Methodology
(1) Long-Term Holding Strategy
Target Investors: Retail investors with moderate risk tolerance, institutional investors focused on blockchain infrastructure exposure, and those believing in CrossFi's fiat-crypto bridge vision.
Operational Recommendations:
- Accumulation Phase: Dollar-cost averaging (DCA) approach to build positions gradually and reduce timing risk. Consider purchasing during price pullbacks below previous support levels.
- Position Management: Establish clear entry and exit targets based on your risk tolerance. Recommended allocation: 1-5% of total crypto portfolio for retail investors.
- Storage Solution: Utilize Gate.com's Web3 wallet services for secure asset custody with institutional-grade security features.
(2) Active Trading Strategy
Technical Analysis Tools:
- Support and Resistance Levels: Monitor key price levels including $0.08 (current support) and $0.12+ (resistance). The $0.04944 all-time low provides psychological support, while $1.12 all-time high represents major resistance.
- Volume Analysis: Track 24-hour trading volume trends on Gate.com. Increasing volume during price rallies confirms bullish momentum, while declining volume during rallies suggests weakening strength.
Wave Trading Key Points:
- Entry Opportunities: Consider accumulation during negative sentiment periods when prices approach the all-time low. The -86.7% one-year decline may represent a capitulation phase.
- Exit Strategy: Take partial profits near technical resistance levels. Implement stop-loss orders below the $0.08 support level to manage downside risk.
XFI Risk Management Framework
(1) Asset Allocation Principles
- Conservative Investors: 0.5-1% allocation to XFI within overall crypto portfolio
- Aggressive Investors: 2-5% allocation to emerging blockchain infrastructure projects like XFI
- Professional Investors: 3-7% allocation with active rebalancing based on technical indicators and market sentiment
(2) Risk Hedging Solutions
- Portfolio Diversification: Balance XFI holdings with established cryptocurrencies and stablecoins to reduce concentration risk and volatility impact.
- Position Sizing: Never allocate more than your predetermined risk tolerance to a single asset. Use position sizing as primary risk control mechanism rather than relying solely on stop-losses.
(3) Secure Storage Solutions
- Hot Wallet Option: Gate.com's Web3 wallet provides convenient access for active traders with institutional-grade security protocols, two-factor authentication, and insurance coverage.
- Cold Storage Method: For long-term holdings, consider transferring XFI to hardware or offline storage solutions after acquisition, ensuring private key custody and security.
- Security Considerations: Never share private keys or seed phrases. Enable all available security features including two-factor authentication. Verify URLs before accessing wallets to avoid phishing attacks.
IV. XFI Potential Risks and Challenges
XFI Market Risks
- Extreme Price Volatility: XFI has experienced -86.7% decline over one year, with extreme price swings. The token trades significantly below its all-time high, presenting both recovery and further decline risks.
- Liquidity Constraints: With only $26,612 in 24-hour trading volume and market cap of $3.57 million, XFI faces potential liquidity challenges during large redemptions or market stress events.
- Low Market Capitalization: At #1747 market ranking with 0.0010% market dominance, XFI remains a micro-cap asset vulnerable to market manipulation and sentiment shifts.
XFI Regulatory Risks
- Evolving Regulatory Landscape: Blockchain projects offering payment and financial services face increasing regulatory scrutiny from global authorities regarding compliance with anti-money laundering (AML) and know-your-customer (KYC) requirements.
- Jurisdictional Uncertainty: Different countries maintain varying stances on cryptocurrency regulation. Changes in regulatory frameworks could impact XFI's operational capabilities and market access.
- Compliance Costs: Regulatory compliance requirements could impose significant operational and financial burdens on the CrossFi ecosystem.
XFI Technology Risks
- Early-Stage Development: As a blockchain project providing fiat-crypto bridge services, CrossFi faces technical risks inherent to emerging blockchain technologies, including smart contract vulnerabilities and protocol risks.
- Security Vulnerabilities: Non-custodial payment systems present unique security challenges. Any protocol vulnerabilities could expose user funds to exploitation.
- Adoption Challenges: Achieving meaningful adoption in the competitive blockchain payment space requires overcoming technical scalability, user experience, and network effects barriers.
V. Conclusions and Action Recommendations
XFI Investment Value Assessment
CrossFi Chain presents an interesting thesis as a fiat-cryptocurrency bridge solution addressing real market needs. However, the project faces significant headwinds evidenced by the -86.7% one-year decline and micro-cap status. The technology vision is compelling, but execution risks remain substantial. Investors should view XFI as a high-risk, speculative opportunity rather than a core portfolio holding.
XFI Investment Recommendations
✅ Beginners: Start with minimal allocations (0.1-0.5% of crypto portfolio) through Gate.com's trading platform. Use only funds you can afford to lose entirely. Focus on understanding the project before scaling investment.
✅ Experienced Investors: Consider tactical accumulation during extreme weakness if technical setup aligns with your risk framework. Implement strict position sizing and stop-loss disciplines. Monitor regulatory developments affecting fiat-crypto bridge protocols.
✅ Institutional Investors: Conduct thorough due diligence on CrossFi's technology, team, and regulatory compliance status. Consider exposure primarily through diversified blockchain infrastructure allocations rather than concentrated XFI positions.
XFI Trading Participation Methods
- Spot Trading: Trade XFI directly on Gate.com's spot market using BTC, ETH, or stablecoin pairs. Offers straightforward exposure with complete control of timing and allocation.
- Dollar-Cost Averaging: Implement systematic purchasing on fixed schedules (weekly, monthly) to reduce entry-price timing risk and volatility impact.
- Limit Order Strategy: Use Gate.com's advanced order types to accumulate at predetermined price levels during support zones, improving average purchase price discipline.
Cryptocurrency investment carries extreme risk. This report does not constitute investment advice. Investors must make decisions based on personal risk tolerance and financial circumstances. Consult professional financial advisors before making investment decisions. Never invest more capital than you can afford to lose completely.
FAQ
Will TokenFi go up?
Yes, TokenFi is expected to rise in value. Market analysis suggests upward momentum driven by growing adoption and ecosystem development. Long-term price predictions indicate potential gains through 2026 and beyond.
What is xfi crypto?
XFI is a token on CrossFi Chain, a Layer 1 blockchain that seamlessly integrates fiat and cryptocurrency. It enables unified financial transactions between traditional and digital currencies, creating an innovative bridge in the Web3 ecosystem.
What factors influence XFI token price movements?
XFI token price is influenced by market demand, trading volume, protocol updates, ecosystem developments, and broader cryptocurrency market trends. Supply dynamics and investor sentiment also significantly impact price movements.
What is the price prediction for XFI in 2025?
Based on market analysis, XFI price prediction for 2025 ranges from $27.75 to $189.70. The price is expected to fluctuate within this range depending on market conditions and adoption trends throughout the year.
Is XFI a good investment compared to other DeFi tokens?
XFI demonstrates strong competitive potential in the DeFi space. With robust fundamentals and growing adoption, it compares favorably to established tokens. Success depends on your investment timeline and portfolio strategy.
Share
Content
Introduction: Market Position and Investment Value of XFI
I. XFI Price History Review and Current Market Status
II. Core Factors Impacting XFI's Future Price
2025 Outlook
2026-2028 Medium-term Outlook
2029-2030 Long-term Outlook
I. XFI Market Overview
II. CrossFi Project Fundamentals
III. XFI Professional Investment Strategy and Risk Management
IV. XFI Potential Risks and Challenges
V. Conclusions and Action Recommendations
FAQ
How to Buy Cryptocurrency


Trending Cryptocurrencies


2025 PUNDIX Price Prediction: Will This Crypto Asset Reach New Heights in the DeFi Era?
Is Amp (AMP) a good investment?: Analyzing the potential and risks of this cryptocurrency token

2025 ACH Price Prediction: Expert Analysis and Market Outlook for Alchemy Pay Token
ALKIMI vs XLM: A Comprehensive Comparison of Two Blockchain Tokens and Their Market Position
Is Wirex (WXT) a good investment?: A Comprehensive Analysis of Token Utility, Market Potential, and Risk Factors for 2024

2025 BCCOIN Price Prediction: Expert Analysis and Market Forecast for the Coming Year

What Are the Key Derivatives Market Signals for Crypto: Open Interest, Funding Rates, and Liquidation Data Explained?
What Is XLM Community and Ecosystem Activity: Twitter Followers, Developer Contributions, and DApp Growth in 2026?

How to Analyze On-Chain Data: Active Address Count, Transaction Volume, Whale Distribution, and Fee Trends in 2026

Will Stellar (XLM) Price Reach $1?

What is Tokenomics and Why Is It Important?