2025 READY Price Prediction: Will This Token Reach $1 by Year-End?


Introduction: READY's Market Position and Investment Value
READY! (READY) is building the infrastructure for real-money gaming as an innovator in pay-to-spawn and win-to-earn gameplay mechanics. Since its launch in November 2024, the project has quickly established itself in the gaming and blockchain ecosystem. As of December 24, 2025, READY has achieved a market capitalization of approximately $3.93 million with a circulating supply of 212.7 million tokens, currently trading at $0.01846 per token. This emerging digital asset is gaining recognition for its unique approach to skill-based gaming and tokenized rewards systems.
This article will provide a comprehensive analysis of READY's price movements and market trends through 2025-2030, incorporating historical performance data, market dynamics, ecosystem development, and macroeconomic factors to deliver professional price forecasts and practical investment strategies for market participants.
READY! Market Analysis Report
I. READY! Price History Review and Current Market Status
READY! Historical Price Evolution Trajectory
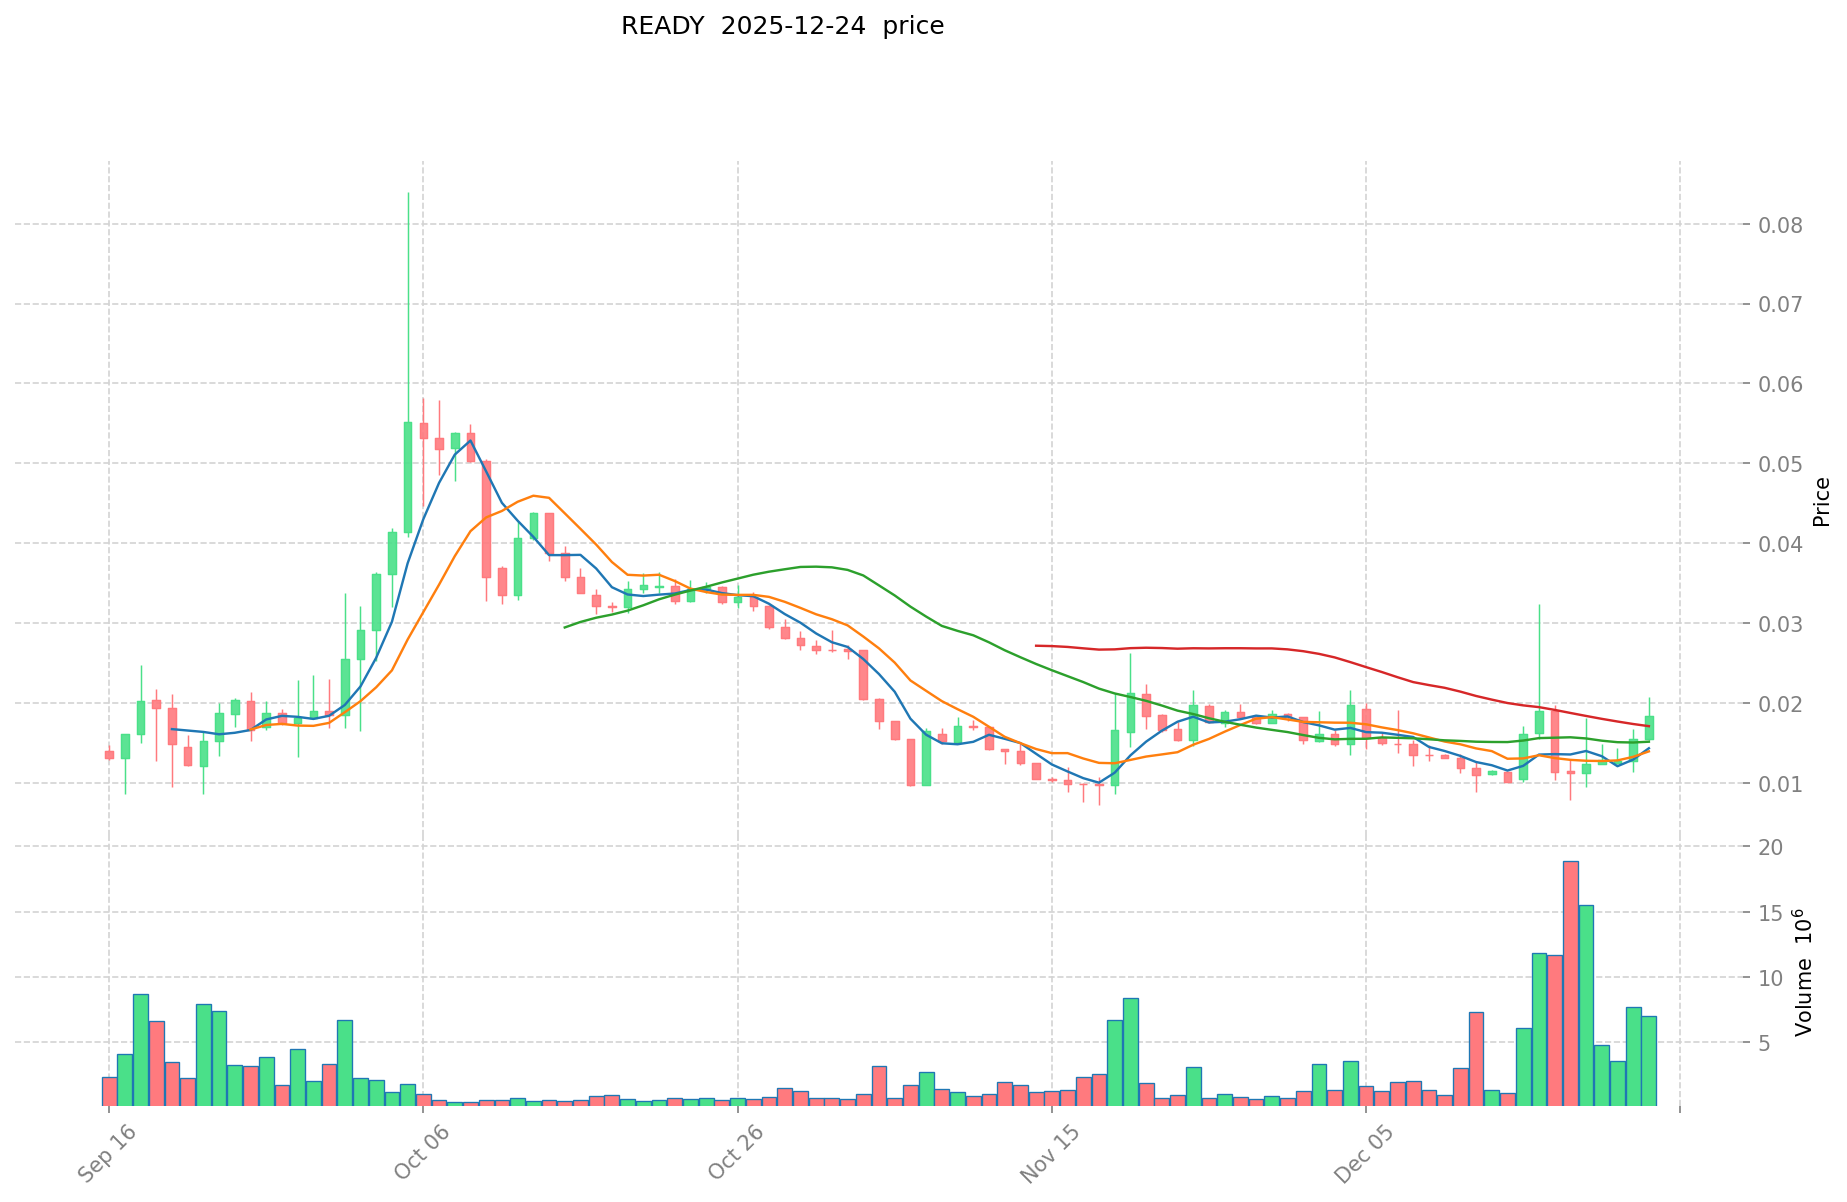
- June 18, 2025: All-time low recorded at $0.000031, marking the lowest point in READY!'s trading history
- October 5, 2025: All-time high reached at $0.084, representing a peak valuation period
- December 24, 2025: Current trading environment showing recovery momentum with price at $0.01846
READY! Current Market Situation
As of December 24, 2025, READY! is trading at $0.01846 with a 24-hour trading volume of $109,234.90. The token demonstrates strong short-term momentum, with a 10.32% gain over the past 24 hours and a 0.78% increase in the last hour, indicating bullish sentiment in the immediate trading period.
Over the extended timeframe, READY! shows substantial appreciation with a 130.47% yearly gain, reflecting growing investor interest since its launch. The 30-day performance of +20.68% further demonstrates sustained upward pressure, though the 7-day metric of -3.16% suggests some recent consolidation following stronger earlier gains.
Market Capitalization and Valuation Metrics:
- Current Market Cap: $3,926,442
- Fully Diluted Valuation (FDV): $18,460,000
- Circulating Supply: 212,700,000 READY! (21.27% of total supply)
- Total Supply: 1,000,000,000 tokens
- Market Dominance: 0.00058%
The token ranks 1,691st by market capitalization and maintains a circulating supply ratio of 21.27%, indicating significant room for supply expansion as the project scales. With 3,128 token holders, READY! continues to build its community base across 2 active exchange platforms, including Gate.com.
Price Range: The 24-hour price range spans from a low of $0.015462 to a high of $0.020779, representing normal intraday volatility. From its all-time high of $0.084, the current price reflects a 77.9% pullback, while from its all-time low of $0.000031**, it represents a 59,548% increase, underscoring the project's significant appreciation potential.
Click to view current READY! market price
READY Market Sentiment Index
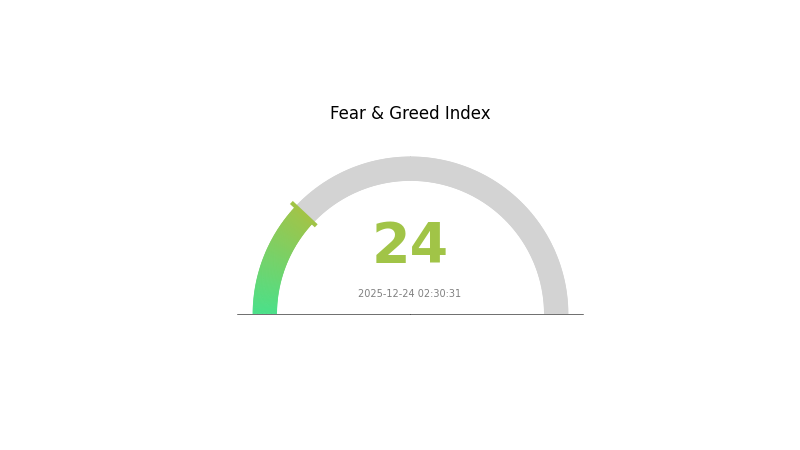
2025-12-24 Fear & Greed Index: 24 (Extreme Fear)
Click to view current Fear & Greed Index
The cryptocurrency market is experiencing extreme fear, with the Fear & Greed Index plummeting to 24. This indicates overwhelming bearish sentiment among investors, characterized by panic selling and widespread risk aversion. Such extreme conditions often present contrarian opportunities for long-term investors. Market participants should exercise caution, diversify portfolios, and avoid emotional decision-making. This fear phase typically precedes market reversals, making it crucial to monitor support levels and maintain disciplined investment strategies during volatile periods.
READY Holdings Distribution
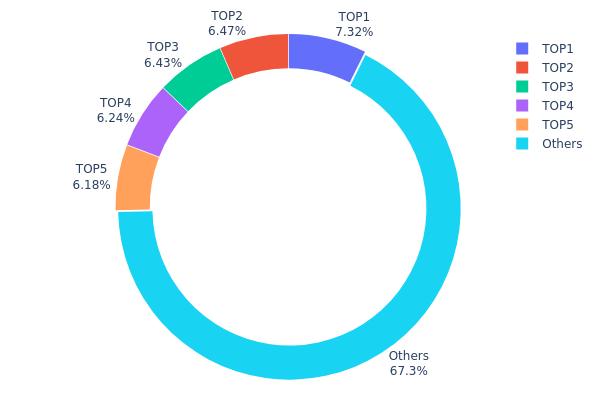
The address holdings distribution chart illustrates the concentration of READY tokens across the blockchain network by tracking the top wallet addresses and their respective token quantities. This metric serves as a critical indicator for assessing the degree of decentralization and potential concentration risks within the token ecosystem, revealing how evenly or unevenly READY holdings are distributed among network participants.
Analysis of the current distribution data demonstrates a moderately concentrated holder structure. The top five addresses collectively control approximately 32.63% of the total supply, with the largest holder (Em7Vy5...kvdazT) commanding 7.32% of all READY tokens. While this concentration is noteworthy, the distribution pattern does not exhibit extreme centralization, as the remaining holders account for 67.37% of the token supply. This suggests a relatively diverse holder base compared to highly concentrated tokens, though the presence of five addresses each holding over 6% of the total supply warrants monitoring for potential coordination risks.
The current address distribution structure carries important implications for market dynamics and price stability. With approximately two-thirds of tokens distributed among smaller holders, READY maintains a reasonably resilient decentralized foundation that could provide some resistance to unilateral price manipulation. However, the 32.63% aggregated holding among the top five addresses remains substantial enough to potentially influence market movements during periods of high volatility or low liquidity. This distribution pattern reflects a balanced but still risk-weighted market structure that combines elements of decentralization with concentrated ownership that requires continued surveillance for any consolidation trends.
Click to view current READY Holdings Distribution
| Top | Address | Holding Qty | Holding (%) |
|---|---|---|---|
| 1 | Em7Vy5...kvdazT | 73227.32K | 7.32% |
| 2 | FGKGhY...9yE4gz | 64728.87K | 6.47% |
| 3 | 4y6eCm...rWRMbw | 64342.48K | 6.43% |
| 4 | 3nzgQB...VDYmaU | 62428.92K | 6.24% |
| 5 | 55HfMK...AR7wZ8 | 61791.38K | 6.17% |
| - | Others | 673474.75K | 67.37% |
II. Core Factors Influencing READY's Future Price
Supply Mechanism
- Token Supply and Circulation: Total supply volume and circulating supply directly impact READY's price dynamics. Market demand interacts with the available token supply to determine price movements.
- Historical Patterns: Historical price fluctuations reflect the combined effects of market sentiment, application progress, and external environmental factors on token valuation.
- Current Impact: Supply changes continue to influence price expectations as the project develops.
Institutional and Whale Dynamics
- Institutional Adoption: Institutional participation and adoption rates significantly affect READY's market price through increased capital inflow and market confidence.
- Market Concentration and Liquidity Risks: Market concentration levels and liquidity conditions require close attention, as they may directly impact price volatility and trading conditions.
Macroeconomic Environment
- Market Demand Factors: Overall market demand for READY tokens, influenced by broader cryptocurrency market trends and investor sentiment, remains a primary driver of price movements.
Technology Development and Ecosystem Construction
- Ecosystem Application Progress: Continued technological advancement and expansion of the READY ecosystem's practical applications support long-term price sustainability and growth potential.
Three、2025-2030 READY Price Forecast
2025 Outlook
- Conservative Forecast: $0.01274 - $0.01847
- Neutral Forecast: $0.01847 - $0.02493
- Optimistic Forecast: $0.02493 (requires sustained market momentum and positive ecosystem developments)
2026-2028 Medium-term Outlook
- Market Stage Expectation: Gradual recovery and accumulation phase with increasing institutional interest and protocol upgrades driving adoption
- Price Range Forecast:
- 2026: $0.01714 - $0.02365 (17% potential upside)
- 2027: $0.01791 - $0.03106 (22% potential upside)
- 2028: $0.01988 - $0.03708 (45% potential upside)
- Key Catalysts: Protocol scalability improvements, increased DeFi integration, expanded partnership ecosystem, and growing tokenomics utility
2029-2030 Long-term Outlook
- Base Case Scenario: $0.02078 - $0.03549 (73% upside potential by 2029, assuming steady market conditions and moderate adoption growth)
- Optimistic Scenario: $0.03103 - $0.04554 (82% upside potential by 2030, assuming accelerated mainstream adoption and significant ecosystem expansion)
- Transformation Scenario: Extended beyond $0.04554 (achieving critical mass adoption, institutional backing, and breakthrough technical innovations)
- 2030-12-31: READY projects sustained growth trajectory with potential to establish stronger market position through community-driven development and strategic integrations on platforms like Gate.com
| 年份 | 预测最高价 | 预测平均价格 | 预测最低价 | 涨跌幅 |
|---|---|---|---|---|
| 2025 | 0.02493 | 0.01847 | 0.01274 | 0 |
| 2026 | 0.02365 | 0.0217 | 0.01714 | 17 |
| 2027 | 0.03106 | 0.02267 | 0.01791 | 22 |
| 2028 | 0.03708 | 0.02687 | 0.01988 | 45 |
| 2029 | 0.03549 | 0.03197 | 0.02078 | 73 |
| 2030 | 0.04554 | 0.03373 | 0.03103 | 82 |
READY! Investment Strategy and Risk Management Report
I. Project Overview
Basic Information
READY! is building the infrastructure for real-money gaming. As the inventor of "pay to spawn" and "win-to-earn" gameplay mechanics, READY! pushes the boundaries of gaming culture, creating a platform where skill-based wagering, fun, and rewards converge.
Key Metrics (As of December 24, 2025)
| Metric | Value |
|---|---|
| Current Price | $0.01846 |
| Market Cap | $3,926,442 |
| Fully Diluted Valuation | $18,460,000 |
| Circulating Supply | 212,700,000 READY |
| Total Supply | 1,000,000,000 READY |
| Market Ranking | 1,691 |
| 24h Trading Volume | $109,234.90 |
| Holders | 3,128 |
| Blockchain | Solana (SOL) |
Price Performance
| Time Period | Change | Status |
|---|---|---|
| 1H | +0.78% | Slight Recovery |
| 24H | +10.32% | Strong Uptrend |
| 7D | -3.16% | Minor Decline |
| 30D | +20.68% | Significant Gains |
| 1Y | +130.47% | Exceptional Growth |
| ATH | $0.084 (October 5, 2025) | -78% from Peak |
| ATL | $0.000031 (June 18, 2025) | +59,548% from Bottom |
II. READY! Professional Investment Strategy
(1) Long-Term Holding Strategy
Target Audience: Investors with 12+ month time horizon who believe in real-money gaming infrastructure development and are comfortable with higher volatility.
Operational Recommendations:
-
Accumulation Phase: Build positions gradually during market corrections, particularly when price tests support levels around $0.015-0.018. Avoid concentrated purchases during price peaks.
-
Position Sizing: Allocate only 2-5% of your crypto portfolio to READY!, given its market cap rank of 1,691 and early-stage development status. This prevents overexposure to emerging gaming infrastructure projects.
-
Storage Solution: Store READY! tokens on the Solana blockchain using Gate.com's platform for secure trading pairs, or maintain tokens in your Solana wallet for long-term holding. Ensure you backup your private keys securely and never share seed phrases.
(2) Active Trading Strategy
Technical Analysis Tools:
-
Moving Averages (MA): Monitor the 50-day and 200-day moving averages to identify long-term trends. Trading above the 200-day MA suggests bullish momentum, while trades below indicate bearish pressure.
-
Relative Strength Index (RSI): Use 14-period RSI to identify overbought (>70) and oversold (<30) conditions. Current market conditions suggest tracking RSI between 40-60 for optimal entry/exit opportunities.
Range Trading Key Points:
-
Resistance Levels: Track resistance at $0.020779 (24h high) and the all-time high of $0.084. Breaking above $0.020 could signal the beginning of a new rally phase.
-
Support Levels: Identify strong support at $0.015462 (24h low). Holding above this level indicates buyer interest; breaking below suggests potential deeper correction toward $0.012-0.014 range.
III. READY! Risk Management Framework
(1) Asset Allocation Principles
| Investor Type | READY! Allocation | Overall Crypto Allocation |
|---|---|---|
| Conservative | 1-2% | 5-10% of portfolio |
| Moderate | 3-5% | 15-25% of portfolio |
| Aggressive | 5-10% | 30-50% of portfolio |
(2) Risk Hedging Strategies
-
Portfolio Diversification: Balance READY! holdings with established cryptocurrencies (Bitcoin, Ethereum) and stablecoins. Given READY!'s 130% year-to-date return but current 78% drawdown from ATH, a diversified approach reduces volatility exposure.
-
Dollar-Cost Averaging (DCA): Instead of lump-sum investments, commit fixed amounts (e.g., $100-500) monthly regardless of price. This strategy reduces timing risk and averages entry costs, particularly beneficial given READY!'s price volatility.
(3) Secure Storage Solutions
-
Hot Wallet Storage: Use Gate.com's integrated wallet for active trading and frequent transactions. Gate.com provides security features suitable for regular trading activities while maintaining access to your assets.
-
Self-Custody Option: For larger holdings intended for long-term storage, transfer tokens to a personal Solana-compatible wallet. Ensure you maintain secure backups of recovery phrases in encrypted, offline storage.
-
Security Precautions: Enable two-factor authentication (2FA) on all exchange accounts; never share private keys or seed phrases; verify contract addresses before token transfers; regularly update security credentials and monitor account activity.
IV. READY! Potential Risks and Challenges
Market Risks
-
High Volatility: READY! has experienced extreme price swings, ranging from $0.000031 to $0.084. This 2,700x variation indicates extreme market sensitivity. Current 78% drawdown from ATH demonstrates the risk of rapid value depreciation.
-
Liquidity Risk: With only $109,234.89 in 24-hour trading volume and 3,128 holders, liquidity is limited. Large buy/sell orders could significantly impact price, making exit strategies unpredictable during market stress.
-
Early-Stage Project Risk: As an infrastructure project for real-money gaming still in development, READY! lacks proven revenue models or established user adoption metrics. Failure to achieve product-market fit poses existential risks.
Regulatory Risks
-
Gaming Regulation Uncertainty: Real-money gaming faces varying regulatory frameworks across jurisdictions. Changes in gambling regulations, particularly regarding blockchain-based wagering, could restrict READY!'s operations or token utility in key markets.
-
Cryptocurrency Classification Risk: Regulators may reclassify gaming tokens or introduce stricter staking/reward mechanisms oversight. This could affect READY!'s "win-to-earn" mechanics and impact token value.
-
Cross-Border Compliance: Operating across multiple jurisdictions requires complex compliance infrastructure. Regulatory crackdowns in major markets (US, EU, Asia) could severely limit READY!'s addressable market.
Technical Risks
-
Smart Contract Vulnerabilities: As a Solana-based project, READY! is exposed to potential smart contract bugs or security flaws. Exploits could result in token loss or loss of user confidence, similar to past incidents in DeFi projects.
-
Blockchain Dependency: READY!'s entire infrastructure relies on Solana network stability. Network outages, congestion, or consensus failures would directly impact platform functionality and user experience.
-
Adoption Risk: The success of READY!'s gaming platform depends on achieving meaningful user adoption and transaction volume. Failure to attract players or compete with established gaming platforms would undermine the entire project thesis.
V. Conclusion and Action Recommendations
READY! Investment Value Assessment
READY! represents a high-risk, potentially high-reward opportunity in the emerging real-money gaming infrastructure space. The project's 130% year-to-date return demonstrates market interest in the concept, but the current 78% drawdown from all-time high reflects significant uncertainty and volatility concerns.
Long-Term Value Thesis: If READY! successfully establishes itself as the leading infrastructure for decentralized gaming with pay-to-spawn and win-to-earn mechanics, it could capture substantial value from the global gaming market. However, regulatory hurdles and technical execution remain critical uncertainties.
Short-Term Risk Profile: The combination of low trading volume, limited holder base (3,128), and early project stage suggests high price volatility will persist. Position sizing must reflect this risk profile.
READY! Investment Recommendations
✅ For Beginners: Start with minimal exposure (0.5-1% of crypto portfolio) through Gate.com's trading platform. Use this as a learning opportunity in emerging gaming infrastructure projects. Implement strict stop-losses at 20% below entry price. Do not invest capital you cannot afford to lose.
✅ For Experienced Investors: Consider a 3-5% allocation with a 12+ month time horizon. Employ DCA strategy over 3-6 months to build a position at varying price points. Use technical analysis to time accumulation during oversold conditions (RSI <30) and scale out during euphoric rallies (RSI >70).
✅ For Institutional Investors: Conduct detailed due diligence on READY!'s technical roadmap, team credentials, and regulatory compliance strategy before allocation decisions. Position sizing should reflect comparable early-stage gaming infrastructure projects. Establish governance requirements for ongoing project monitoring.
READY! Trading Participation Methods
-
Direct Trading on Gate.com: Purchase READY tokens directly using USDT or other trading pairs available on Gate.com. This provides immediate access and straightforward onboarding for most investors.
-
Strategic Accumulation: Implement scheduled purchases at predetermined intervals (weekly/monthly) to reduce timing risk and benefit from DCA principles. This method suits long-term investors committed to the project thesis.
-
Market Making Opportunities: Advanced traders may participate in providing liquidity on Gate.com, earning trading fees while helping improve market depth. This advanced strategy requires careful risk management and capital allocation.
Cryptocurrency investment carries extreme risk. This report does not constitute investment advice. Investors should make decisions based on their individual risk tolerance and financial situation. Consultation with professional financial advisors is strongly recommended. Never invest more capital than you can afford to lose completely.
FAQ
Which coin will boom in 2025?
Solana and XRP are expected to boom in 2025 based on market trends and strong fundamentals. Both tokens show significant growth potential driven by increasing adoption and ecosystem development.
What is a 12 month price target for READY?
Based on analyst consensus, the 12-month price target for READY is approximately 2.92, with estimates ranging from 2.92 to 3.50. This projection reflects current market analysis and trader sentiment.
How much is crypto worth in 2025?
The total crypto market capitalization crossed $4 trillion for the first time in 2025, driven by increased institutional adoption, crypto-friendly regulations, and traditional finance integration. This represents significant growth from previous years.
What factors influence READY token price predictions?
READY token price predictions are influenced by market trends, technology advancements, regulatory changes, and technical analysis indicators. Trading volume, investor sentiment, and broader cryptocurrency market conditions also impact price movements significantly.
Is READY a good investment based on price forecasts?
READY shows strong growth potential with positive price forecasts. Market analysis indicates bullish momentum driven by increasing trading volume and adoption. Current trends suggest favorable investment opportunities for 2025.
Share
Content
Introduction: READY's Market Position and Investment Value
I. READY! Price History Review and Current Market Status
II. Core Factors Influencing READY's Future Price
Three、2025-2030 READY Price Forecast
I. Project Overview
II. READY! Professional Investment Strategy
III. READY! Risk Management Framework
IV. READY! Potential Risks and Challenges
V. Conclusion and Action Recommendations
FAQ
How to Buy Cryptocurrency


Trending Cryptocurrencies


2025 JUP Price Prediction: Analyzing Market Trends and Potential Growth Factors for Jupiter's Native Token

2025 SLERF Price Prediction: Analyzing Market Trends and Future Growth Potential in the Expanding Digital Asset Ecosystem

2025 E4C Price Prediction: Analyzing Market Trends and Future Prospects for Ethereum Classic
2025 AURASOL Price Prediction: Analyzing Market Trends and Potential Growth Factors

2025 DBR Price Prediction: Expert Analysis and Market Forecast for Digital Blockchain Reserve Token

2025 WET Price Prediction: Expert Analysis and Market Forecast for the Next Bull Run

How Does SUI Price Volatility Compare to Bitcoin and Ethereum in 2026?
What is Dogecoin (DOGE) market cap and trading volume in 2026?
What is SPO: A Comprehensive Guide to Subject-Predicate-Object in Knowledge Graphs and Semantic Web

How Does PEPE Price Volatility Impact Its Value in 2026?

Is the Platform Halal or Haram? Understanding Islamic Finance Principles
