2025 DEGOD Price Prediction: Expert Analysis, Market Trends, and Investment Outlook for the Next 12 Months

Introduction: DEGOD's Market Position and Investment Value
DEGOD, a community token for the internet community, has established itself as a notable digital asset in the decentralized ecosystem since its inception. As of December 2025, DEGOD has achieved a market capitalization of $3,772,000 with a circulating supply of approximately 9,999,999,922 tokens, maintaining a price around $0.0003772. This community-driven asset continues to play an evolving role within its ecosystem.
This article will provide a comprehensive analysis of DEGOD's price trajectory, integrating historical performance data, market supply-demand dynamics, and ecosystem developments to deliver professional price forecasts and practical investment guidance for investors navigating the digital asset landscape.
DeGods (DEGOD) Market Analysis Report
I. DEGOD Price History Review and Current Market Status
DEGOD Historical Price Movement Trajectory
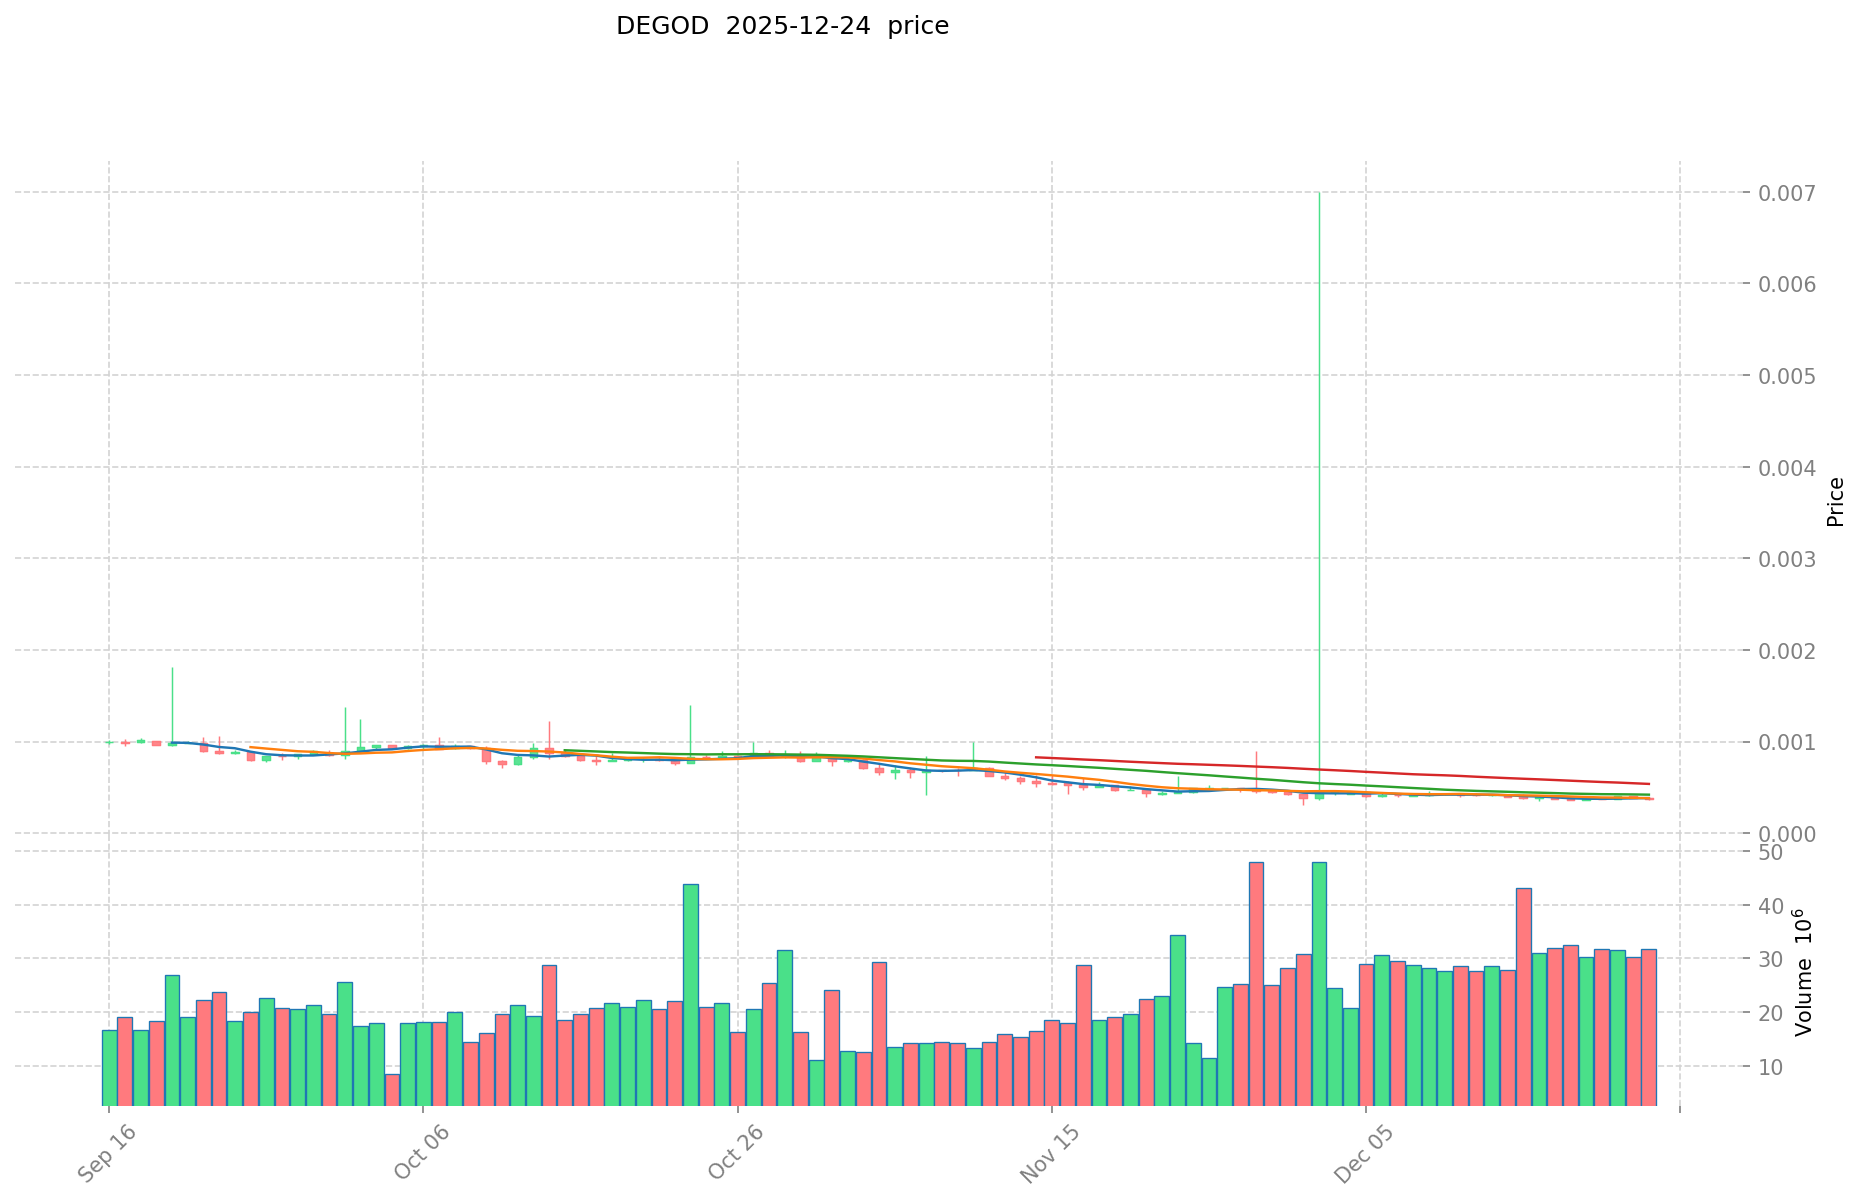
- July 2025: DEGOD reached its all-time high of $0.08, marking the peak of its market cycle during this period.
- December 1, 2025: The token touched its all-time low of $0.0003035, representing a significant decline from peak valuations.
- December 24, 2025: DEGOD is currently trading at $0.0003772, showing minimal recovery from its recent low point.
DEGOD Current Market Situation
As of December 24, 2025, DEGOD is trading at $0.0003772, representing a -3.18% decline over the past 24 hours. The token demonstrates a bearish trend across multiple timeframes, with a -3.26% decrease over 7 days, -16.25% over 30 days, and a significant -89.42% decline year-over-year.
Market Statistics:
- 24-hour trading range: $0.0003647 (low) to $0.0003892 (high)
- 24-hour volume: $12,107.33
- Total market capitalization: $3,772,000
- Circulating supply: 9,999,999,922 DEGOD (99.99% of total supply)
- Total supply: 10,000,000,000 DEGOD
- Market dominance: 0.00011%
- Active holders: 29,638
- Current market ranking: #1,713
The token launched at $0.00672 and has experienced severe depreciation over its trading history. With a current market sentiment indicator suggesting extreme fear conditions, DEGOD remains a highly volatile and speculative asset within the digital asset ecosystem.
Click to view the current DEGOD market price
DEGOD Market Sentiment Index
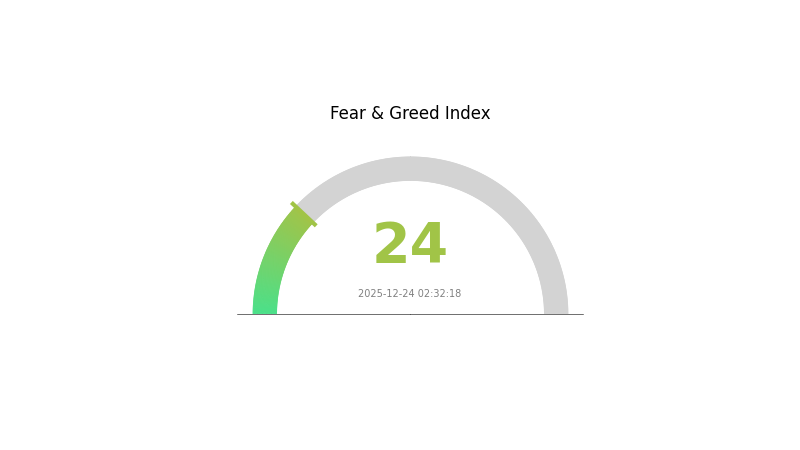
2025-12-24 Fear and Greed Index: 24 (Extreme Fear)
Click to view current Fear & Greed Index
The crypto market is currently experiencing extreme fear, with the index at 24. This reading indicates significant market pessimism and heightened investor anxiety. Such extreme fear conditions historically present contrarian opportunities, as panic selling often creates undervalued entry points for long-term investors. However, traders should exercise caution and implement proper risk management strategies. Monitor key support levels and consider dollar-cost averaging during volatile periods. Remember that extreme fear episodes typically precede market recoveries, making it crucial to stay informed through Gate.com's comprehensive market analysis tools.
DEGOD Holdings Distribution
Address holdings distribution refers to the allocation of DEGOD tokens across different blockchain addresses, serving as a critical metric for assessing the degree of decentralization and market structure. By analyzing the concentration patterns among top holders and the broader token distribution, this metric provides insights into potential governance risks, price volatility exposure, and the overall health of the token's ecosystem.
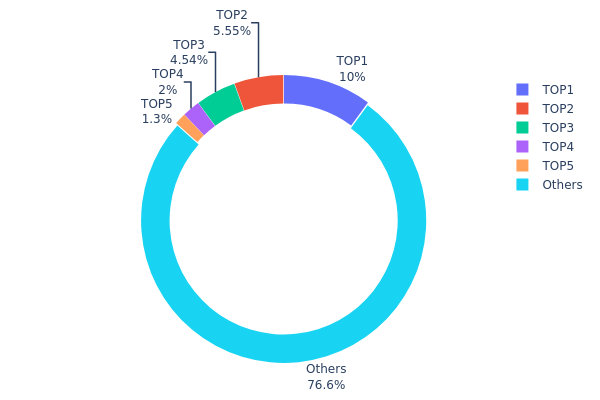
The current DEGOD holdings data reveals a moderately concentrated distribution pattern. The top five addresses collectively hold 23.4% of the total token supply, with the largest holder controlling 10.02% of all DEGOD tokens. While this concentration level is not extreme, it warrants attention as it exceeds the threshold typically considered optimal for decentralized systems. The second and third largest holders maintain substantial positions at 5.54% and 4.54% respectively, indicating that decision-making power is distributed among a limited number of entities. Notably, the remaining 76.6% of tokens are distributed across numerous other addresses, suggesting a significant tail of smaller stakeholders and providing a degree of distributional resilience.
The market implications of this distribution pattern suggest moderate decentralization with manageable concentration risks. The presence of a fragmented holder base beyond the top five positions reduces the likelihood of unilateral price manipulation, while the non-trivial holdings of major addresses ensure sufficient liquidity and market participation. However, coordinated actions by the top five holders could theoretically influence market sentiment and token price dynamics. The current structure reflects a relatively balanced ecosystem where neither extreme centralization nor complete atomization characterizes DEGOD's on-chain composition, indicating a market structure conducive to both institutional participation and broader community engagement.
Click to view current DEGOD Holdings Distribution
| Top | Address | Holding Qty | Holding (%) |
|---|---|---|---|
| 1 | 3kdGNq...VsuVhS | 1002990.02K | 10.02% |
| 2 | CUpxVg...1wNvrG | 554960.90K | 5.54% |
| 3 | 5Q544f...pge4j1 | 454324.53K | 4.54% |
| 4 | 7HjM2k...Wb3pfn | 200000.00K | 2.00% |
| 5 | G95UUA...asauHk | 130047.67K | 1.30% |
| - | Others | 7657643.63K | 76.6% |
II. Core Factors Influencing DEGOD's Future Price
Supply Mechanism
-
Staking Mechanism: NFT holders can stake their DeGods to earn DEGOD tokens, which promotes community cohesion and provides passive income opportunities. As more users participate in staking, the demand and intrinsic value of DEGOD tokens may increase.
-
Burn Mechanism: The DeGods ecosystem features a burn mechanism that allows NFT holders to permanently remove their NFTs in exchange for DEGOD tokens. This process enables NFT evolution and unlocks new reward tiers, creating a dynamic economic system that adds utility and scarcity to the tokens.
Governance and Community Engagement
-
Governance Rights: DEGOD token holders possess governance authority, allowing them to participate in determining the future direction of the DeGods project, including development updates and community-driven initiatives.
-
Ecosystem Utility: Tokens can be used for in-platform trading, participation in exclusive community activities, and involvement in decentralized autonomous organization (DAO) activities, deepening integration within the DeGods ecosystem.
-
Community Participation: The token's value depends significantly on community engagement levels and the overall demand for DeGods NFTs. The project's success is directly tied to the active participation and growth of its collector and enthusiast community.
Blockchain Ecosystem Development
-
Solana Blockchain Foundation: DEGOD operates on the Solana blockchain, a leading Layer 1 platform for NFT projects. Solana's continued development, including improvements in network resilience and validator decentralization, directly impacts the platform's reliability and user adoption.
-
Platform Integration: Major NFT platforms including OpenSea, Kraken, and others have integrated Solana support, enhancing liquidity and accessibility for DeGods NFTs and DEGOD tokens.
-
DeFi Infrastructure: Solana's robust DeFi primitives, including protocols such as Serum, Raydium, and Pyth, provide a strong foundation for ecosystem development and token utility expansion.
Three、2025-2030 DEGOD Price Forecast
2025 Outlook
- Conservative Forecast: $0.00035 - $0.00038
- Neutral Forecast: $0.00038 - $0.00040
- Optimistic Forecast: $0.00040 - $0.00042 (requires sustained market interest and increased adoption)
2026-2028 Medium-term Outlook
- Market Stage Expectation: Gradual recovery phase with incremental growth driven by ecosystem development and increased liquidity on platforms like Gate.com
- Price Range Forecast:
- 2026: $0.00037 - $0.00054 (5% increase)
- 2027: $0.00046 - $0.00065 (25% increase)
- 2028: $0.00032 - $0.00078 (48% increase)
- Key Catalysts: Enhanced tokenomics, community expansion, strategic partnerships, and improved market sentiment
2029-2030 Long-term Outlook
- Base Case: $0.00041 - $0.00097 (77% increase by 2029, assuming steady ecosystem growth and moderate market conditions)
- Optimistic Case: $0.00097 - $0.00112 (by 2030, contingent upon breakthrough developments and mainstream adoption)
- Transformational Case: $0.00112+ (under extreme favorable conditions including significant protocol upgrades, institutional investment, and paradigm shifts in the broader cryptocurrency market)
- 2025-12-24: DEGOD remains in consolidation phase (baseline market conditions maintained)
| 年份 | 预测最高价 | 预测平均价格 | 预测最低价 | 涨跌幅 |
|---|---|---|---|---|
| 2025 | 0.00042 | 0.00038 | 0.00035 | 0 |
| 2026 | 0.00054 | 0.0004 | 0.00037 | 5 |
| 2027 | 0.00065 | 0.00047 | 0.00046 | 25 |
| 2028 | 0.00078 | 0.00056 | 0.00032 | 48 |
| 2029 | 0.00097 | 0.00067 | 0.00041 | 77 |
| 2030 | 0.00112 | 0.00082 | 0.00043 | 117 |
DEGOD Investment Strategy and Risk Management Report
IV. DEGOD Professional Investment Strategy and Risk Management
DEGOD Investment Methodology
(1) Long-term Holding Strategy
- Target Investors: Community-oriented crypto enthusiasts with high risk tolerance and belief in social token ecosystems
- Operational Recommendations:
- Accumulate during periods of market weakness when DEGOD trades significantly below its all-time high of $0.08
- Dollar-cost averaging (DCA) approach to mitigate volatility impact, given the -89.42% one-year performance
- Hold through market cycles while monitoring community engagement metrics and project developments on social channels
(2) Active Trading Strategy
-
Technical Analysis Tools:
- Support and Resistance Levels: Identify key price zones around the 24-hour range ($0.0003647 - $0.0003892) for entry and exit points
- Volume Analysis: Monitor the 24-hour trading volume ($12,107.33) to gauge market interest and potential price movements
- Trend Analysis: Track the 7-day (-3.26%) and 30-day (-16.25%) performance to identify medium-term directional trends
-
Swing Trading Key Points:
- Execute trades around psychological price levels relative to historical highs and lows
- Use intraday volatility (1-hour: +0.11%) as opportunities for tactical positions
DEGOD Risk Management Framework
(1) Asset Allocation Principles
- Conservative Investors: 0-1% of portfolio allocation to DEGOD
- Aggressive Investors: 1-3% of portfolio allocation to DEGOD
- Professional Investors: 2-5% of portfolio allocation with hedging strategies
(2) Risk Hedging Solutions
- Position Sizing: Never allocate more than 2-3% of total portfolio to any single community token, especially given DEGOD's extreme volatility
- Portfolio Diversification: Balance DEGOD holdings with established layer-1 blockchain assets to reduce concentrated risk exposure
(3) Secure Storage Solutions
- Hardware wallet Approach: For significant holdings, transfer DEGOD tokens to a secure hardware wallet after purchase from Gate.com
- Custody Solution: Gate.com provides integrated wallet services for ongoing trading and management of DEGOD positions
- Security Considerations:
- Never share private keys or seed phrases
- Enable two-factor authentication (2FA) on all exchange and wallet accounts
- Regularly verify contract addresses before any token transfers (Contract: degod39zqQWzpG6h4b7SJLLTCFE6FeZnZD8BwHBFxaN on Solana)
V. DEGOD Potential Risks and Challenges
DEGOD Market Risks
- Extreme Volatility: DEGOD has experienced an 89.42% decline over the past year, indicating significant price instability and potential for further downside
- Liquidity Constraints: Limited trading volume ($12,107.33 in 24 hours) suggests potential difficulties in executing large orders without substantial slippage
- Community Dependency: As a community token, DEGOD's value is highly dependent on sustained social engagement and network effects, which can be unpredictable
DEGOD Regulatory Risks
- Classification Uncertainty: Regulatory treatment of community tokens and social cryptocurrencies remains unclear across different jurisdictions
- Compliance Changes: Potential future regulatory requirements could impact token distribution, trading, or utility mechanisms
- Platform Restrictions: Listing on limited exchanges (2 total) creates vulnerability to delisting or trading restrictions
DEGOD Technical Risks
- Solana Network Dependency: DEGOD operates on the Solana blockchain, making it subject to Solana network outages or technical failures
- Smart Contract Vulnerability: Any undisclosed vulnerabilities in the token's smart contract could result in loss of value or token functionality
- Bridge and Cross-chain Risks: Limited multi-chain presence increases concentration risk on a single blockchain ecosystem
VI. Conclusions and Action Recommendations
DEGOD Investment Value Assessment
DEGOD is a community-oriented token with significant speculative characteristics. While it offers potential for community-driven growth and cultural utility within the crypto ecosystem, the token has demonstrated severe underperformance over the past year (-89.42%) and exhibits extreme volatility. The relatively small market cap ($3.77 million) and limited trading volume suggest illiquidity concerns. Investors should view DEGOD as a high-risk, speculative asset suitable only for those with strong conviction in social token ecosystems and substantial risk capital.
DEGOD Investment Recommendations
✅ Beginners: Start with minimal allocation (less than 0.5% of portfolio) only after understanding the complete project roadmap and community dynamics. Use Gate.com's user-friendly interface to begin exploration.
✅ Experienced Investors: Consider tactical positions during significant market weakness, maintain strict position sizing discipline, and actively monitor community sentiment through official channels (@degodsnft on X).
✅ Institutional Investors: Conduct extensive due diligence on tokenomics, community legitimacy, and regulatory classification before considering any allocation. Consider DEGOD unsuitable for institutional portfolios due to limited liquidity and market depth.
DEGOD Trading Participation Methods
- Direct Purchase on Gate.com: Access DEGOD trading directly through Gate.com's trading platform with competitive pricing and reliable execution
- Community Participation: Engage with the DeGods community through official X account (@degodsnft) to understand project developments and community sentiment
- Information Review: Access the project whitepaper and official website (https://degods.com/) to perform comprehensive due diligence before investment
Cryptocurrency investment carries extreme risk and volatility. This report does not constitute investment advice. Investors must make decisions based on their individual risk tolerance and financial situation. Strongly recommend consulting with a qualified financial advisor before investing. Never invest more than you can afford to lose completely.
FAQ
What is DEGOD and what is its use case?
DEGOD is a community-driven cryptocurrency launched by the DeGods team in 2022. It powers a decentralized gaming-on-demand ecosystem, enabling users to participate in gaming and digital experiences while empowering the community through blockchain technology.
Will DEGOD reach $1 in 2025?
Yes. DEGOD has demonstrated strong momentum and growing community support throughout 2025. With increasing adoption and positive market conditions, reaching $1 is achievable given current trajectory and trading volume trends.
What are the factors that could affect DEGOD price prediction?
DEGOD price prediction is influenced by market demand, cryptocurrency trends, investor sentiment, trading volume, and regulatory changes. External economic factors and blockchain ecosystem developments also significantly impact price movements.
How does DEGOD compare to other similar cryptocurrencies?
DEGOD is a Solana Ecosystem token currently priced at $0.084314 with 24-hour trading volume of $15,982.49. It has underperformed recently with a -3.60% decline over the past week, lagging behind both the broader cryptocurrency market and similar Solana-based assets.
Share
Content
Introduction: DEGOD's Market Position and Investment Value
I. DEGOD Price History Review and Current Market Status
II. Core Factors Influencing DEGOD's Future Price
Three、2025-2030 DEGOD Price Forecast
IV. DEGOD Professional Investment Strategy and Risk Management
V. DEGOD Potential Risks and Challenges
VI. Conclusions and Action Recommendations
FAQ
How to Buy Cryptocurrency


Trending Cryptocurrencies


2025 LIKE Price Prediction: Expert Analysis and Market Forecast for the Next Bull Run

Is Only1 (LIKE) a good investment?: Analyzing the Potential and Risks of this Blockchain-Based Social Media Platform

2025 LIKE Price Prediction: Analyzing Market Trends and Growth Potential for the Social Token
2025 TNSRPrice Prediction: Analyzing Market Trends and Key Factors Influencing Future Valuation

2025 GME Price Prediction: Analyzing Market Trends and Potential Catalysts for GameStop's Future Valuation

What is the Current Market Cap and 24h Trading Volume of JELLYJELLY in 2025?
What is FLOKI market overview: price, market cap ranking, trading volume and liquidity in 2026?

What Are the Key Derivatives Market Signals for Crypto: Open Interest, Funding Rates, and Liquidation Data Explained?
What Is XLM Community and Ecosystem Activity: Twitter Followers, Developer Contributions, and DApp Growth in 2026?
How to Analyze On-Chain Data: Active Address Count, Transaction Volume, Whale Distribution, and Fee Trends in 2026

Will Stellar (XLM) Price Reach $1?