2025 AMS Price Prediction: Expert Analysis and Market Forecast for the Coming Year


Introduction: Market Position and Investment Value of AMS
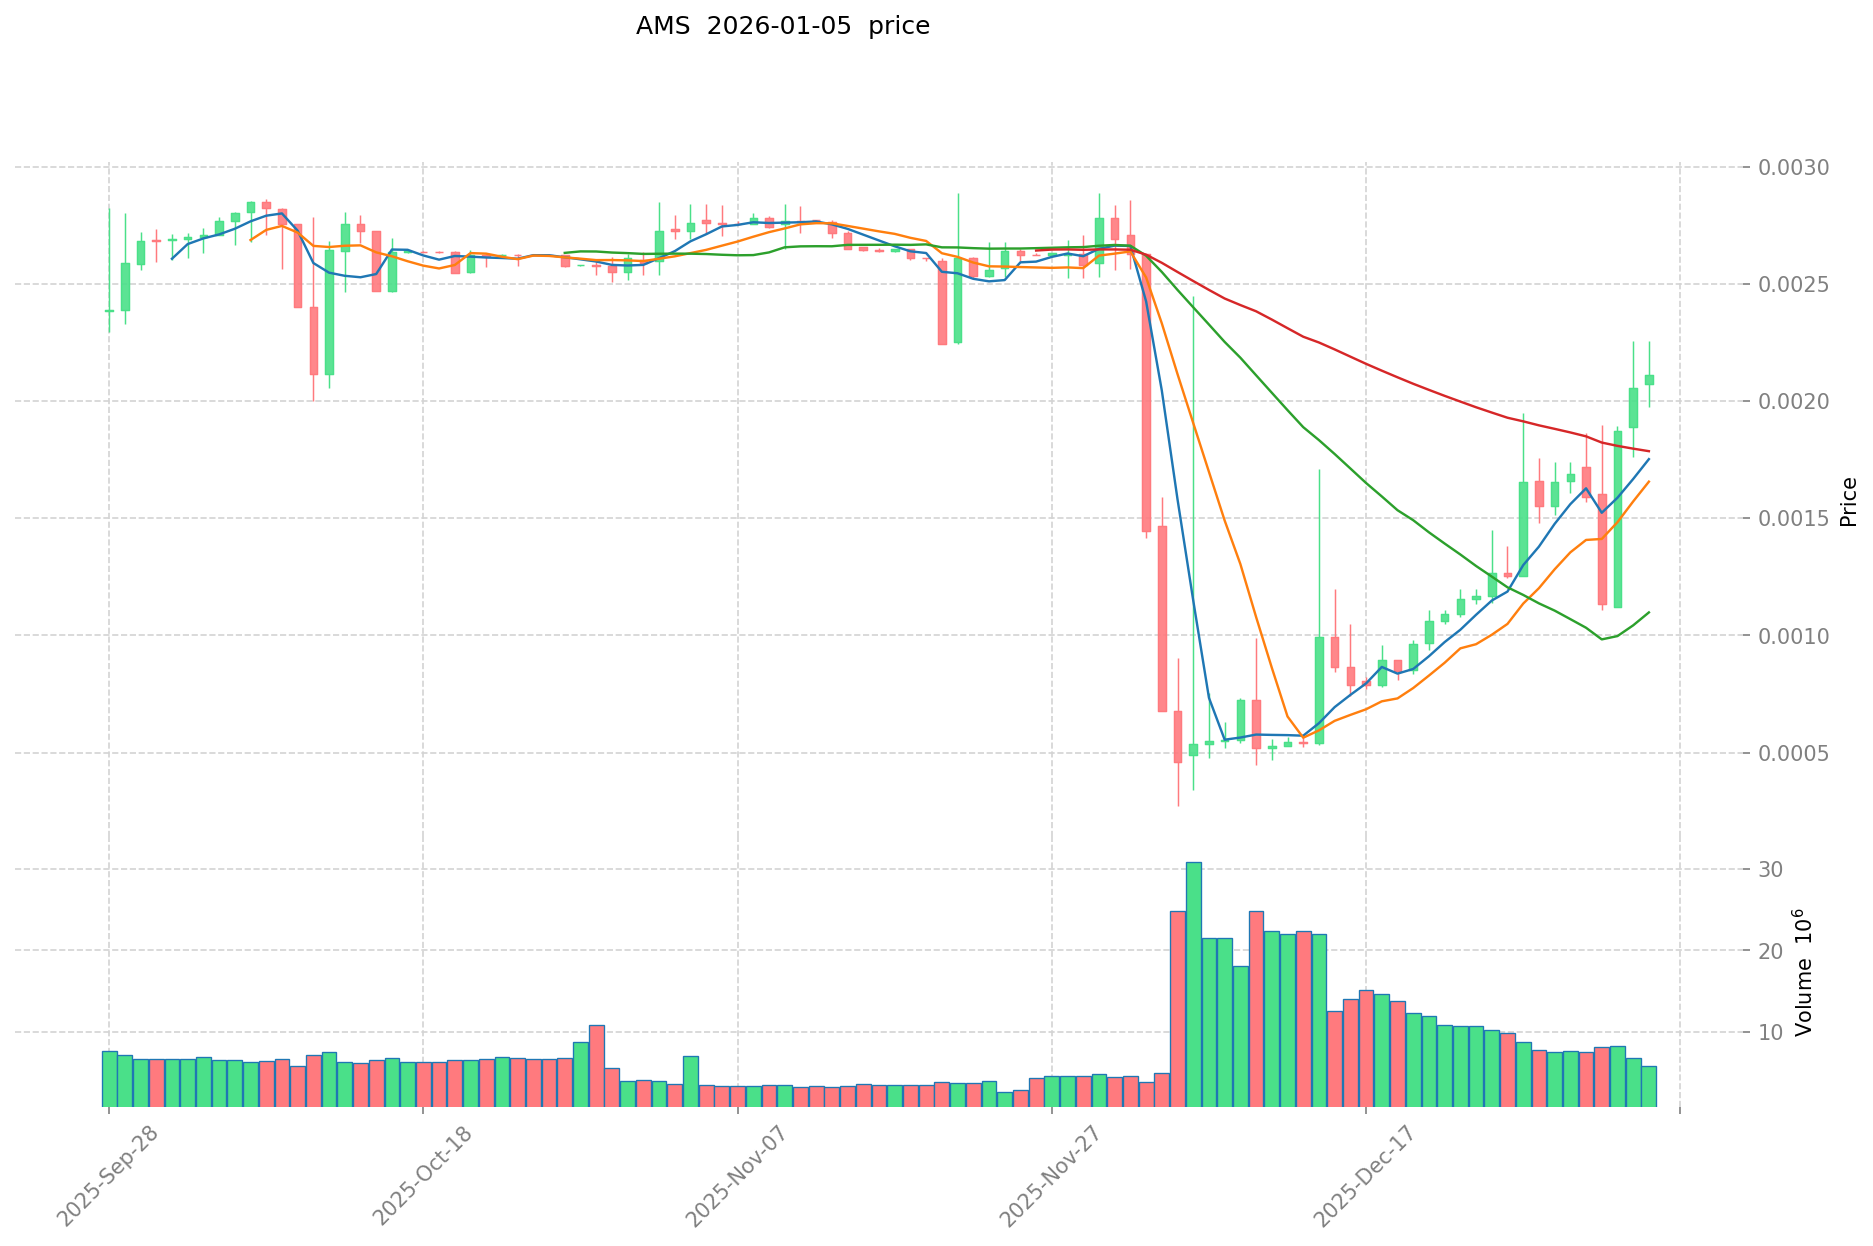
Antmons (AMS), a blockchain-based play-to-earn MOBA game, has emerged as a unique gaming asset in the Web3 ecosystem. As of January 2026, AMS maintains a market capitalization of $50,500.44 with approximately 23.91 million tokens in circulation out of a total supply of 100 million. The token is currently trading at $0.0021117, reflecting market dynamics across a 24-hour period marked by notable volatility.
This innovative gaming token, positioning itself as a "play-to-earn gaming asset," is gaining traction in the gaming and blockchain intersection sector. The Antmons platform offers users the opportunity to earn income through daily battles and competitive token pool events within a blockchain-powered gaming environment, thereby establishing its relevance in the broader Web3 gaming economy.
This article will comprehensively analyze AMS price trends and market dynamics, combining historical price patterns, market supply and demand factors, and ecosystem developments to provide investors with professional price forecasts and actionable investment strategies for the period ahead.
Antmons (AMS) Market Analysis Report
I. AMS Price History Review and Current Market Status
AMS Historical Price Evolution
-
September 19, 2023: AMS reached its all-time high (ATH) of $0.394, marking a significant peak in the token's price history.
-
December 5, 2025: AMS hit its all-time low (ATL) of $0.0002711, representing a substantial decline from historical peaks.
AMS Current Market Position
As of January 5, 2026, AMS is trading at $0.0021117, reflecting a -5.36% decline over the past 24 hours. The token has experienced significant volatility across different timeframes:
- 1-hour change: -0.0071%
- 7-day change: +32.81%
- 30-day change: +428.72%
- 1-year change: -14.75%
The 24-hour trading range spans from a low of $0.0020907 to a high of $0.0022553. With a 24-hour trading volume of approximately $12,309.95, the token demonstrates relatively modest liquidity metrics.
Market Capitalization Metrics:
- Current market cap: $50,500.44
- Fully diluted valuation: $211,170.00
- Market cap to FDV ratio: 23.91%
- Market dominance: 0.0000063%
The token currently ranks #5,734 in the broader cryptocurrency market. AMS has a circulating supply of 23,914,589 tokens out of a total supply of 100,000,000, representing 23.91% circulation. Token holders number approximately 48 addresses.
Check the current AMS market price on Gate.com
AMS Market Sentiment Index
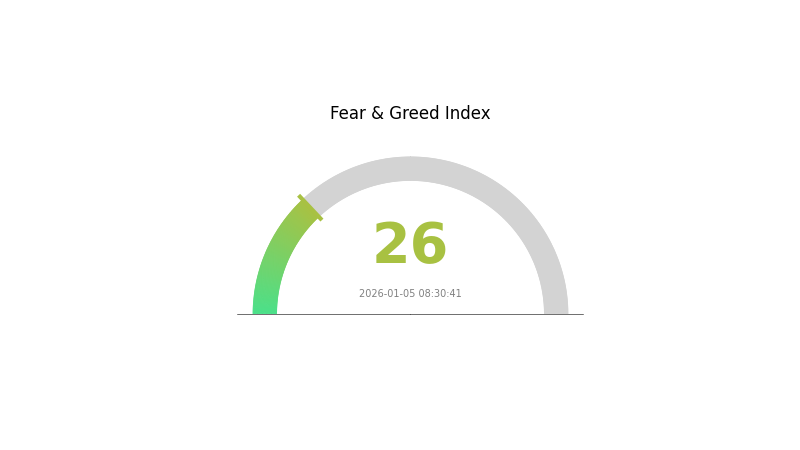
2026-01-05 Fear and Greed Index: 26 (Fear)
Click to view the current Fear & Greed Index
Today's cryptocurrency market is experiencing a fear sentiment with an index reading of 26, indicating heightened risk aversion among investors. This lower reading suggests market participants are cautious and concerned about potential downside risks. During periods of fear, prices tend to experience selling pressure as investors prioritize capital preservation. Such market conditions often create opportunities for long-term investors to accumulate assets at potentially lower valuations. Traders should remain vigilant, manage risk carefully, and avoid emotional decision-making during this sentiment phase.
AMS Holdings Distribution
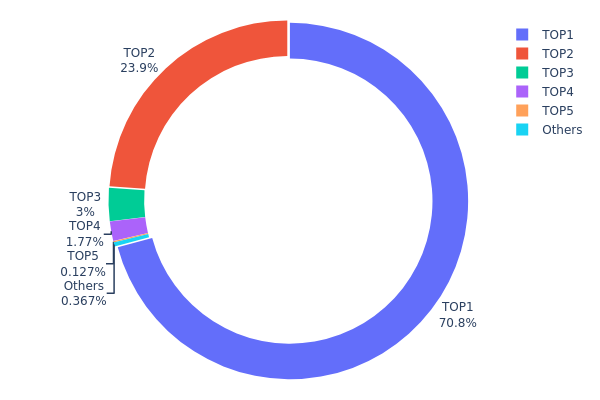
The address holdings distribution chart illustrates the concentration of token ownership across the top holders on the blockchain. This metric serves as a critical indicator for assessing the decentralization level of a project, revealing potential risks related to wealth concentration and market manipulation vulnerability.
AMS currently exhibits pronounced concentration characteristics, with the top two addresses commanding 94.72% of total holdings. The largest holder (0x388c...6a94bb) alone controls 70.83% of the circulating supply, while the second-largest address (0x0d07...b492fe) accounts for 23.89%. This extreme concentration in the hands of just two entities presents a significant structural vulnerability. The remaining top three addresses contribute only 4.88% collectively, with the fifth-largest holder and other addresses representing negligible portions at 0.52% combined. Such skewed distribution patterns indicate that AMS operates in a highly centralized state, where decision-making power and market influence are disproportionately concentrated among a small number of stakeholders.
The current address distribution structure poses material implications for market stability and price dynamics. With over 94% of tokens held by just two addresses, the token faces elevated risks of potential supply shocks, coordinated selling pressure, or market manipulation. The substantial gap between the top two holders and remaining addresses suggests limited liquidity outside these major positions, which could result in heightened price volatility during market movements. This concentration profile underscores that AMS remains largely dependent on the actions and intentions of a few key holders, significantly constraining the project's progress toward meaningful decentralization and elevating counterparty risk for smaller investors.
View the current AMS Holdings Distribution
| Top | Address | Holding Qty | Holding (%) |
|---|---|---|---|
| 1 | 0x388c...6a94bb | 70837.30K | 70.83% |
| 2 | 0x0d07...b492fe | 23898.60K | 23.89% |
| 3 | 0xa119...0284e2 | 3000.00K | 3.00% |
| 4 | 0x41e7...2d12f8 | 1769.91K | 1.76% |
| 5 | 0x64d7...eb8168 | 127.20K | 0.12% |
| - | Others | 366.99K | 0.39999999999999% |
II. Core Factors Influencing AMS Future Price
Macroeconomic Environment
-
Monetary Policy Impact: Interest rate fluctuations directly affect investment attractiveness of AMS tokens. Central bank policy expectations influence market sentiment and capital allocation decisions.
-
Inflation Hedge Characteristics: In inflationary environments, AMS demonstrates potential positioning as a "digital gold" alternative, potentially enhancing investment demand during periods of currency devaluation concerns.
-
Geopolitical Factors: International geopolitical uncertainty may increase demand for AMS as investors seek portfolio diversification and risk hedging instruments.
Technology Development and Ecosystem Building
-
5G and IoT Technology Expansion: With the development of 5G and Internet of Things technologies, AMS application domains will continue to expand, driving sustained market demand growth for related services and solutions.
-
Performance Improvement: Continuous technological progress will enhance AMS performance capabilities while potentially driving gradual price optimization over time.
III. 2026-2031 AMS Price Forecast
2026 Outlook
- Conservative Forecast: $0.00149 - $0.00213
- Base Case Forecast: $0.00213
- Optimistic Forecast: $0.00297 (requires sustained market recovery and increased adoption)
2027-2029 Medium-term Outlook
- Market Stage Expectation: Consolidation phase with gradual recovery trajectory, characterized by volatility stabilization and incremental utility expansion
- Price Range Forecast:
- 2027: $0.00201 - $0.00334
- 2028: $0.00283 - $0.00306
- 2029: $0.00279 - $0.00339
- Key Catalysts: Enhanced ecosystem development, increased institutional participation, technological upgrades, and broader market sentiment improvement
2030-2031 Long-term Outlook
- Base Scenario: $0.00297 - $0.00384 (assumes steady market maturation and moderate adoption growth)
- Optimistic Scenario: $0.00352 - $0.00384 (assumes accelerated protocol upgrades and significant mainstream integration)
- Transformational Scenario: $0.00384+ (extreme favorable conditions including breakthrough partnership announcements, major regulatory clarity, and exponential user adoption)
- 2031-12-31: AMS achieves average trading price of $0.00352 (consolidation within mid-range valuation zone)
| 年份 | 预测最高价 | 预测平均价格 | 预测最低价 | 涨跌幅 |
|---|---|---|---|---|
| 2026 | 0.00297 | 0.00213 | 0.00149 | 1 |
| 2027 | 0.00334 | 0.00255 | 0.00201 | 20 |
| 2028 | 0.00306 | 0.00294 | 0.00283 | 39 |
| 2029 | 0.00339 | 0.003 | 0.00279 | 42 |
| 2030 | 0.00384 | 0.0032 | 0.00297 | 51 |
| 2031 | 0.00366 | 0.00352 | 0.00285 | 66 |
Antmons (AMS) Professional Investment Strategy and Risk Management Report
IV. AMS Professional Investment Strategy and Risk Management
AMS Investment Methodology
(1) Long-Term Holding Strategy
- Suitable Investors: Community-oriented gamers and blockchain enthusiasts with high risk tolerance
- Operational Recommendations:
- Accumulate AMS tokens during market downturns to build long-term positions aligned with game ecosystem development
- Monitor hero upgrades and gameplay improvements as indicators of platform maturation and potential token utility expansion
- Participate in guild formations and community events to maximize in-game earnings while holding tokens
(2) Active Trading Strategy
- Technical Analysis Tools:
- Price Action Analysis: Monitor the 7-day uptrend (+32.81%) and 30-day surge (+428.72%) to identify momentum reversal points and support/resistance levels
- Volume Analysis: Track 24-hour volume trends ($12,309.95) to confirm breakout validity and entry/exit signals
- Wave Trading Key Points:
- Capitalize on short-term volatility with the current 24-hour decline (-5.36%) as a potential entry opportunity
- Set profit-taking targets at previous resistance levels near the historical high of $0.394
AMS Risk Management Framework
(1) Asset Allocation Principles
- Conservative Investors: 1-2% portfolio allocation
- Active Investors: 3-5% portfolio allocation
- Professional Investors: 5-10% portfolio allocation
(2) Risk Hedging Solutions
- Position Diversification: Limit AMS holdings to a small percentage of total crypto portfolio given its micro-cap status (market cap $50,500.44)
- Dollar-Cost Averaging (DCA): Implement gradual accumulation over time to reduce the impact of price volatility
(3) Secure Storage Solutions
- Exchange Custody: Store trading positions on Gate.com for active trading and immediate liquidity access
- Self-Custody Approach: Use Gate Web3 wallet for secure long-term holdings with private key control
- Security Precautions: Enable two-factor authentication on all accounts, maintain backup recovery phrases offline, and never share private keys
V. AMS Potential Risks and Challenges
AMS Market Risk
- Extreme Volatility: The token has experienced a 99.31% decline from its all-time high ($0.394 on 2023-09-19) to current prices, indicating substantial price instability
- Low Liquidity: Daily trading volume of $12,309.95 against a market cap of $50,500.44 presents limited exit opportunities during adverse market conditions
- Micro-Cap Status: With only 48 token holders and a market cap ranking of 5,734, AMS faces significant concentration risk and potential manipulation vulnerabilities
AMS Regulatory Risk
- Gaming Regulation Uncertainty: Play-to-earn game models face evolving regulatory scrutiny across different jurisdictions regarding token utility and rewards classification
- Blockchain Compliance: Operation on Arbitrum chain subjects the project to changing regulatory frameworks governing decentralized applications and token issuance
- Market Access Restrictions: Regulatory changes could limit accessibility or trading availability in key markets
AMS Technical Risk
- Smart Contract Vulnerabilities: As a blockchain-based gaming token, potential code exploits or vulnerabilities could jeopardize token value and user funds
- Network Dependency: Reliance on Arbitrum blockchain infrastructure means AMS performance is subject to network congestion and operational issues
- Game Development Risk: Delays in gameplay updates, hero balance issues, or failure to maintain community engagement could devalue the token's utility
VI. Conclusions and Action Recommendations
AMS Investment Value Assessment
Antmons (AMS) represents a speculative micro-cap investment opportunity centered on a play-to-earn MOBA gaming ecosystem. The token has demonstrated significant volatility with a 428.72% monthly gain but maintains extreme downside risk given its 99.31% decline from historical highs. The project's value proposition depends entirely on successful game development, community adoption, and continued player engagement. With only 48 holders and limited trading volume, investors should view this as a high-risk, early-stage opportunity suitable only for experienced traders with substantial risk tolerance.
AMS Investment Recommendations
✅ Beginners: Avoid direct exposure; instead, research blockchain gaming fundamentals and monitor the project's development milestones before considering any allocation
✅ Experienced Investors: Consider 2-3% portfolio allocations only if you can afford total loss, with strict stop-losses at 30-40% below entry prices and profit-taking targets at previous resistance levels
✅ Institutional Investors: Conduct comprehensive due diligence on development team qualifications, game mechanics sustainability, and tokenomics before any institutional participation
AMS Trading Participation Methods
- On-Chain Trading: Purchase AMS directly on Gate.com against BTC, USDT, or other trading pairs with immediate blockchain settlement
- Gaming Ecosystem Participation: Earn AMS tokens through daily battles and token pool PK competitions within the game platform
- Community Guild Participation: Join or establish guilds to access cooperative gameplay and enhanced reward distribution mechanisms
Cryptocurrency investments carry extreme risk. This report does not constitute investment advice. Investors must make decisions according to their individual risk tolerance and are strongly advised to consult professional financial advisors. Never invest funds you cannot afford to lose completely.
FAQ
What is AMS? What are its basic functions and uses?
AMS is a management backend material system framework for rapidly building admin interfaces using JSON configuration. Its basic functions include providing modular UI components and page templates. Main uses are helping developers quickly construct backend applications and management platforms efficiently.
What is the historical price trend of AMS? What are the main factors affecting its price?
AMS has experienced significant price volatility, influenced by market sentiment, trading volume, project developments, and broader cryptocurrency market trends. Key factors include ecosystem adoption, regulatory environment, and macroeconomic conditions affecting digital asset valuations.
How to conduct AMS price prediction? What are the common analysis methods?
AMS price prediction uses technical analysis(chart patterns, moving averages), fundamental analysis(market data, trading volume), and on-chain metrics. Monitor price trends, trading amount, market sentiment, and network activity. Combine multiple indicators for better accuracy in forecasting price movements.
What is the 2024 AMS price prediction?How do experts view it?
Experts predict AMS reaching $0.001704 by 2025. The token shows potential for steady growth driven by ecosystem development and increased adoption. Long-term forecasts suggest continued upside through 2030s based on fundamental improvements.
Which is more important in AMS price prediction, technical analysis or fundamental analysis?
Both matter, but fundamental analysis is more critical for long-term AMS price predictions. It evaluates project strength, adoption, and market conditions. Technical analysis helps identify entry points. Combined, they provide the most accurate prediction framework for AMS price movements.
How does AMS price competitiveness compare to similar assets?
AMS demonstrates strong price competitiveness with lower volatility and higher trading volume than comparable assets. Its market positioning reflects solid fundamentals and growing ecosystem adoption, making it an attractive entry point in the crypto market.
What are the policy, market, and technical risks affecting AMS price?
AMS price is influenced by regulatory changes, market demand fluctuations, and technological advancements. Policy adjustments and intensified market competition cause price volatility. Technical innovations reshape market dynamics and AMS market share. Illiquidity and fierce blockchain competition pose additional risks.
How to assess the accuracy and reliability of AMS price predictions?
Evaluate AMS price predictions through backtesting and key metrics like MAE and RMSE. More historical data improves accuracy. Analyze prediction performance across different market conditions and timeframes to determine reliability.
Share
Content
Introduction: Market Position and Investment Value of AMS
I. AMS Price History Review and Current Market Status
II. Core Factors Influencing AMS Future Price
III. 2026-2031 AMS Price Forecast
IV. AMS Professional Investment Strategy and Risk Management
V. AMS Potential Risks and Challenges
VI. Conclusions and Action Recommendations
FAQ
How to Buy Cryptocurrency


2025 AXS Price Prediction: Analyzing Market Trends and Potential Growth Factors for Axie Infinity's Token

2025 STARHEROES Price Prediction: Analyzing Market Trends and Growth Potential for the Rising Crypto Asset

2025 XTER Price Prediction: Expert Analysis and Market Outlook for the Next Generation of Blockchain Technology

2025 APRS Price Prediction: Expert Analysis and Market Forecast for the Coming Year

2025 VOXEL Price Prediction: Expert Analysis and Market Forecast for the Next 12 Months

2025 APRS Price Prediction: Analyzing Market Trends and Future Outlook for Aspires Token

Bitcoin Minetrix

Is Cryptocurrency Legal in Moldova?

Texas Buys Bitcoin for Strategic Reserve

Thanh Luu: Co-Founder and Architect of Cryptocurrency Exchange Standards

Popular English-Language Telegram Groups and Channels for Finance and Cryptocurrency