Pump.fun (PUMP) ยังคงเผชิญกับแรงกดดันในการปรับตัวลง โดยลดลงประมาณ 2% ในช่วงเวลาที่เขียนบทความในวันอังคาร ซึ่งต่อเนื่องจากการร่วงลง 4% ในช่วงการซื้อขายก่อนหน้านี้ โทเคนของแพลตฟอร์ม launchpad นี้ยังคงอยู่ในความเสี่ยงที่จะลดลงอย่างลึกซึ้งมากขึ้น เนื่องจากคาดว่าจะมีการเปิดล็อก 10 พันล้าน PUMP ในวันนี้ ซึ่งจะเพิ่มแรงกดดันด้านอุปทาน ในขณะที่ความสนใจของนักลงทุนรายย่อยกำลังลดลงอย่างต่อเนื่อง ในด้านเทคนิค แนวโน้มของ PUMP ยังคงเอียงไปในทางลบ โดยมีแรงขายเป็นฝ่ายครองตลาดอย่างชัดเจนและโมเมนตัมการลดลงยังคงครองตลาดอยู่
การเปิดล็อกโทเคนรายเดือนและแรงซื้อที่อ่อนแอเพิ่มความเสี่ยงในการลดลง
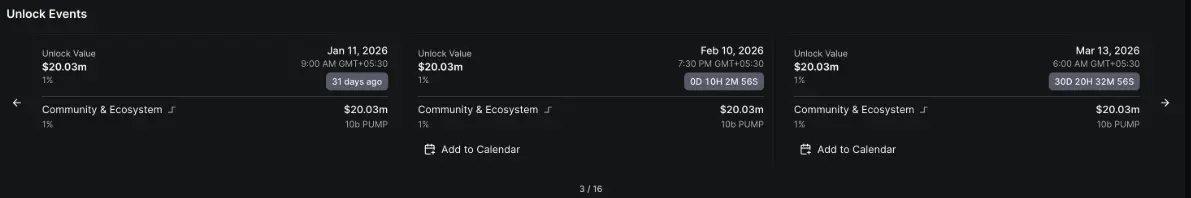
ข้อมูลจาก DeFiLlama ระบุว่า ประมาณ 10 พันล้านโทเคน PUMP จะถูกเปิดล็อกในคืนวันอังคาร และจัดสรรให้กับกองทุนชุมชนและระบบนิเวศ ด้วยมูลค่ารวมกว่า 20 ล้านดอลลาร์สหรัฐ โทเคนเหล่านี้ โดยเฉพาะส่วนที่จัดสรรให้กับชุมชน อาจเพิ่มแรงกดดันด้านการขาย ในบริบทที่นักลงทุนยังคงไม่ฟื้นตัวหลังจากการเทขายอย่างรุนแรงของตลาดในสัปดาห์ที่ผ่านมา
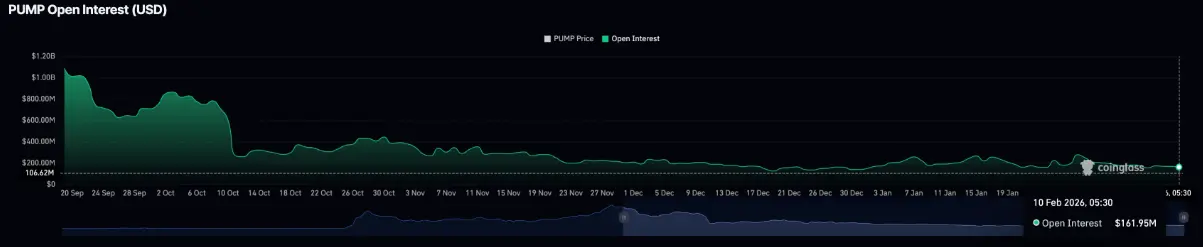
 ข้อมูลการเปิดล็อก PUMP | แหล่งที่มา: DeFiLlamaในทางตรงกันข้าม ข้อมูลจาก CoinGlass แสดงให้เห็นว่าข้อตกลงเปิด (Open Interest) ของสัญญาฟิวเจอร์ส PUMP กำลังลดลงอย่างต่อเนื่อง ลดลงเหลือ 161.95 ล้านดอลลาร์สหรัฐในวันอังคาร การเปลี่ยนแปลงนี้สะท้อนให้เห็นถึงความระมัดระวังที่เพิ่มขึ้นและระดับการมีส่วนร่วมของนักลงทุนรายย่อยที่ลดลง
 ข้อตกลงเปิด (OI) ของสัญญาฟิวเจอร์ส PUMP | แหล่งที่มา: CoinGlass ## วิเคราะห์ทางเทคนิค: PUMP ยังคงลดลงอย่างต่อเนื่องหรือไม่?
PUMP หลุดแนวรับสำคัญที่ 0.002000 ดอลลาร์สหรัฐ หลังจากลดลง 4% ในวันจันทร์ แนวโน้มการขายยังไม่มีสัญญาณหยุดลง ขณะที่เขียนบทความ ราคายังคงลดลงอีกเกือบ 2% ในวันอังคาร ซึ่งเป็นวันที่สี่ติดต่อกันของการลดลง ตั้งแต่จุดสูงสุดวันที่ 6 กุมภาพันธ์ ที่ 0.002201 ดอลลาร์สหรัฐ
แนวโน้มอ่อนแรงในปัจจุบันทำให้ PUMP เข้าใกล้แนวรับที่ 0.001886 ดอลลาร์สหรัฐ ซึ่งเป็นจุดต่ำสุดของแท่งเทียน 4 ชั่วโมงที่เกิดขึ้นเมื่อวันที่ 5 กุมภาพันธ์ หากราคาปิดต่ำกว่าระดับนี้อย่างชัดเจนบนกรอบเวลา 4 ชั่วโมง แนวโน้มการลดลงจะมีแนวโน้มขยายตัวต่อไป โดยเป้าหมายถัดไปคือจุดต่ำสุดของวันที่ 29 ธันวาคม ที่ประมาณ 0.001775 ดอลลาร์สหรัฐ
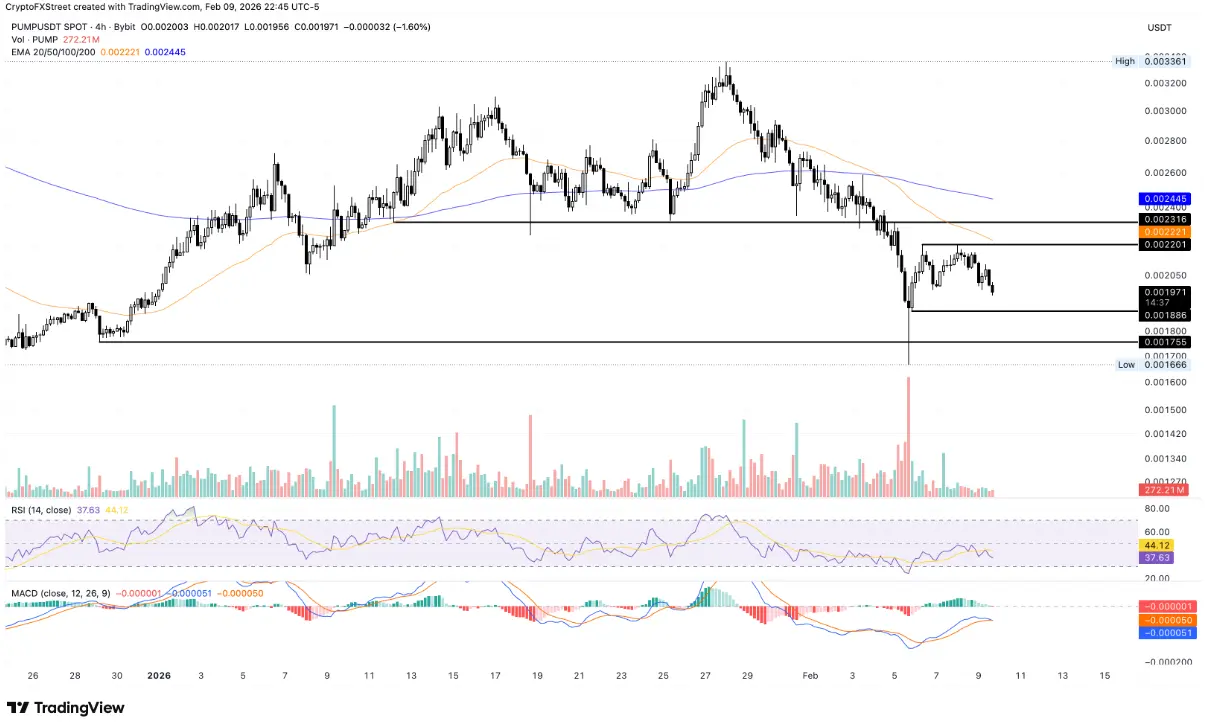 กราฟ PUMP/USDT กรอบ 4 ชั่วโมง | แหล่งที่มา: TradingViewในด้านเทคนิค ตัวบ่งชี้โมเมนตัมบนกราฟ 4 ชั่วโมง กำลังเอียงไปในทางลบ โดยดัชนี RSI ลดลงมาที่ประมาณ 40 และเริ่มลดลงจากโซนกลาง แสดงให้เห็นว่ายังมีพื้นที่ปรับตัวลงอีกก่อนที่จะเข้าสู่ภาวะ oversold ในขณะเดียวกัน เส้น MACD กำลังเข้าใกล้เส้นสัญญาณ ซึ่งเพิ่มความเสี่ยงของการเกิดการตัดกันในแนวขาลง (bearish cross)
ในทางตรงกันข้าม หากฝ่ายซื้อสามารถช่วยให้ PUMP กลับขึ้นไปเหนือระดับ 0.002000 ดอลลาร์สหรัฐได้อย่างรวดเร็ว ราคามีโอกาสฟื้นตัวขึ้นไปทดสอบเส้น EMA 50 ที่ระดับ 0.002213 ดอลลาร์สหรัฐ ซึ่งใกล้กับจุดสูงสุดระยะสั้นเมื่อวันที่ 6 กุมภาพันธ์ ที่ 0.002201 ดอลลาร์สหรัฐ
btc.bar.articles
Billionaire Investor Stanley Druckenmiller Bullish on Stablecoin Growth
Billionaire investor Stanley Druckenmiller believes stablecoins will become the backbone of the financial system in 10-15 years, citing their efficiency. However, he views much of the wider crypto market as unnecessary, describing it as “a solution looking for a problem.”
Decrypt11 นาที ที่แล้ว
Bitcoin Cash Battles $459 Resistance as Massive Sell Walls Stack Toward $650
BCH is trading at $455.86 close to the resistance range of $459.20 with the support level of $447.44.
The chart data indicates that the chart has strong resistance levels at around $520, $580 and $650 which restricts the momentum on short term upside.
Following a sharp fall, price
CryptoNewsLand51 นาที ที่แล้ว
PEPE Consolidates Above $0.05324 Support as Momentum Strengthens and Resistance Near $0.05336 Holds
PEPE has a tight intraday price compression with a support level of $0.053243 and resistance level of $0.053363.
A RSI of 64.13 represents the moderate bullish momentum whereas MACD history is slightly positive, which indicates the gradual buying momentum.
The price is at $0.053364
CryptoNewsLand1 ชั่วโมง ที่แล้ว
HYPE Hits $35.53 After 2.4% Jump — Will Momentum Hold as Price Tests $35.59 Resistance?
Hyperliquid’s HYPE trades at $35.53, approaching the $35.59 resistance after a 2.4% daily gain.
The chart shows the $33.67 zone acting as support after price moved above a previously contested level.
Price now trades between $33.67 support and $35.59 resistance, shaping the immediate
CryptoNewsLand1 ชั่วโมง ที่แล้ว
Cardano áp sát mốc 0,28 USD khi lực mua nhỏ lẻ tăng mạnh – Đà bứt phá đã cận kề?
The current price of Cardano (ADA) is around $0.270, having risen from a support level of $0.254-$0.260. It underwent a dip to $0.2194 before buyers returned, leading to a structure indicating accumulation. The price tests resistance at $0.287, while whale activity raises market uncertainty. Despite a reduction in ADA holdings among large wallets, the supply remains concentrated in their hands, suggesting strategic liquidity reallocation rather than widespread selling. Meanwhile, retail investors continue accumulating ADA.
TapChiBitcoin4 ชั่วโมง ที่แล้ว
Bitcoin MVRV Z-Score Drops Below 1 Again
The MVRV Z-Score is a key on-chain indicator for assessing Bitcoin's value by comparing market and realized capitalizations. Historical data shows that when the score drops below 1, it often signals significant market recovery. However, changing market dynamics and institutional influences may alter future patterns.
Coinfomania4 ชั่วโมง ที่แล้ว