M谋ngYueZen

vip
Peak Tier 0
Airdrop Hunter
Market Analyst
Match is match
#TradeCFDWinGold
#XIAOMI 📱📈
XIAOMI is currently entering one of the most important structural phases in its broader market cycle as global technology sentiment, consumer electronics demand, AI integration narratives, and EV sector expansion continue attracting institutional attention toward the company. Over recent months, XIAOMI has transformed from being viewed only as a smartphone manufacturer into a much broader technology ecosystem player, and this shift is heavily influencing trader sentiment across TradFi CFD markets.
From a macro perspective, XIAOMI is benefiting from several strong
XIAOMI-2.27%
Vortex_King
#TradeCFDWinGold
#XIAOMI 📱📈
XIAOMI is currently entering one of the most important structural phases in its broader market cycle as global technology sentiment, consumer electronics demand, AI integration narratives, and EV sector expansion continue attracting institutional attention toward the company. Over recent months, XIAOMI has transformed from being viewed only as a smartphone manufacturer into a much broader technology ecosystem player, and this shift is heavily influencing trader sentiment across TradFi CFD markets.
From a macro perspective, XIAOMI is benefiting from several strong growth narratives simultaneously. The company continues expanding its smartphone ecosystem, smart home infrastructure, AI-driven products, wearable technology presence, and electric vehicle ambitions. This diversification is strengthening long-term investor confidence because market participants increasingly value companies capable of building interconnected ecosystems rather than relying on a single revenue stream.
Current Market Structure
Technically, XIAOMI remains inside a bullish medium-to-long-term structure despite periodic consolidations. The overall market trend continues showing higher highs and higher lows on larger timeframes, which usually reflects sustained institutional accumulation behavior rather than temporary retail speculation.
The price structure currently suggests that buyers remain active during pullback phases, especially around major support zones where liquidity historically enters the market aggressively. Momentum traders are watching closely for continuation breakouts because the stock has repeatedly shown strong recovery behavior after corrective phases.
Trend Direction
Short-Term Trend: Bullish Consolidation
Mid-Term Trend: Strong Bullish Structure
Long-Term Trend: Expansion Phase
The broader structure indicates that XIAOMI is still trading inside a growth-focused narrative cycle. As long as major support levels continue holding, market participants are likely to maintain a positive directional bias.
Support Levels
Primary Support Zone:
18.20 – 18.80 HKD
This area represents a strong demand region where buyers previously defended price aggressively. Institutional liquidity historically becomes more active inside this range.
Secondary Support Zone:
16.90 – 17.40 HKD
If broader market weakness appears, this level could become a deeper retracement area where swing traders search for long re-entry opportunities.
Psychological Support:
15.00 HKD
This level remains psychologically important because markets often react strongly around round-number zones.
Resistance Levels
Immediate Resistance:
20.50 – 21.20 HKD
This area represents the first major breakout zone traders are monitoring closely.
Major Resistance:
22.80 – 24.00 HKD
A confirmed breakout above this structure could trigger accelerated momentum expansion.
Long-Term Expansion Target:
26.00 – 28.00 HKD
If bullish momentum strengthens further through institutional participation and broader tech-sector recovery, this zone may become the next major upside target.
Market Momentum
Momentum structure remains positive overall. Recent price behavior suggests that buyers continue controlling broader directional flow despite temporary corrections. Momentum indicators on higher timeframes still favor continuation rather than full structural reversal.
The strongest momentum periods often appear during:
Positive technology-sector sentiment
Strong earnings expectations
AI-related market optimism
EV ecosystem developments
Chinese tech-sector recovery phases
Volume Behavior
Volume activity around XIAOMI has shown increasing institutional participation during major breakout attempts. Rising volume during bullish continuation phases usually indicates stronger market confidence and broader participation from larger financial players.
Healthy volume expansion during upward movement is generally considered constructive because it confirms stronger buying conviction behind the trend.
Technical Formation
Current structure resembles a bullish continuation framework with accumulation behavior developing after previous expansion phases. Traders are monitoring whether price can build enough momentum for another breakout cycle.
Important formations being observed:
Bullish Flag Structure
Ascending Support Trendline
Higher Low Formation
Breakout Compression Range
These formations typically favor continuation when confirmed with strong volume participation.
Liquidity Structure
Liquidity currently appears concentrated near:
18.50 HKD support region
20.50 HKD breakout zone
22.00 HKD expansion trigger
Institutional traders often target liquidity pools before major directional movements occur. This means volatility may temporarily increase around these levels before stronger trends develop.
Intraday Trading Bias
Bullish Scenario:
If XIAOMI holds above 18.80 HKD and breaks 20.50 HKD with strong momentum, intraday traders may target:
21.20 HKD
22.00 HKD
22.80 HKD
Bearish Pullback Scenario:
If broader market weakness appears:
18.20 HKD becomes key support
Below that, 17.40 HKD may attract buyers again
Swing Trading Strategy
Conservative Entry Zone:
18.50 – 19.00 HKD
Aggressive Breakout Entry:
Above 20.50 HKD confirmation
Swing Targets:
TP1: 21.20 HKD
TP2: 22.80 HKD
TP3: 24.00 HKD
Risk Management Area:
SL below 17.40 HKD depending on volatility tolerance
Institutional Perspective
Large investors are increasingly focusing on ecosystem-driven technology companies with scalable long-term narratives. XIAOMI’s combination of hardware expansion, AI integration, smart ecosystem development, and EV ambitions creates a multi-sector growth profile that many growth-focused traders find attractive.
The EV narrative especially continues strengthening broader market attention because investors are evaluating whether XIAOMI can evolve into a serious participant inside the expanding intelligent mobility sector.
Macro Factors Influencing XIAOMI
Several macro elements continue affecting price behavior:
Chinese technology policy sentiment
Consumer electronics demand
AI sector momentum
Semiconductor supply conditions
Global equity risk appetite
EV market expansion
Institutional tech-sector rotation
Positive developments across these areas generally support stronger bullish continuation.
Psychological Structure
Psychological price levels matter heavily inside XIAOMI’s market structure:
20 HKD = breakout confidence level
25 HKD = expansion psychology zone
30 HKD = long-term speculative target
Markets often accelerate when psychological resistance zones break with strong momentum.
Overall Market Outlook
XIAOMI currently remains one of the more structurally interesting technology-focused TradFi CFD opportunities because it combines:
Strong ecosystem growth
Expanding product diversification
Positive technical structure
Institutional interest
AI narrative exposure
EV sector expansion potential
As long as broader market conditions remain supportive and major support levels continue holding, bullish continuation remains the dominant market structure scenario. Traders will likely continue monitoring breakout confirmation zones closely because strong momentum above resistance could trigger another major expansion phase in the coming cycle.

repost-content-media
  • Reward
  • Comment
  • 2
  • Share
#Nikkei225RecordHigh
#JapanEquitySupercycle | Macro Momentum & Structural Breakout Analysis
Nikkei 225
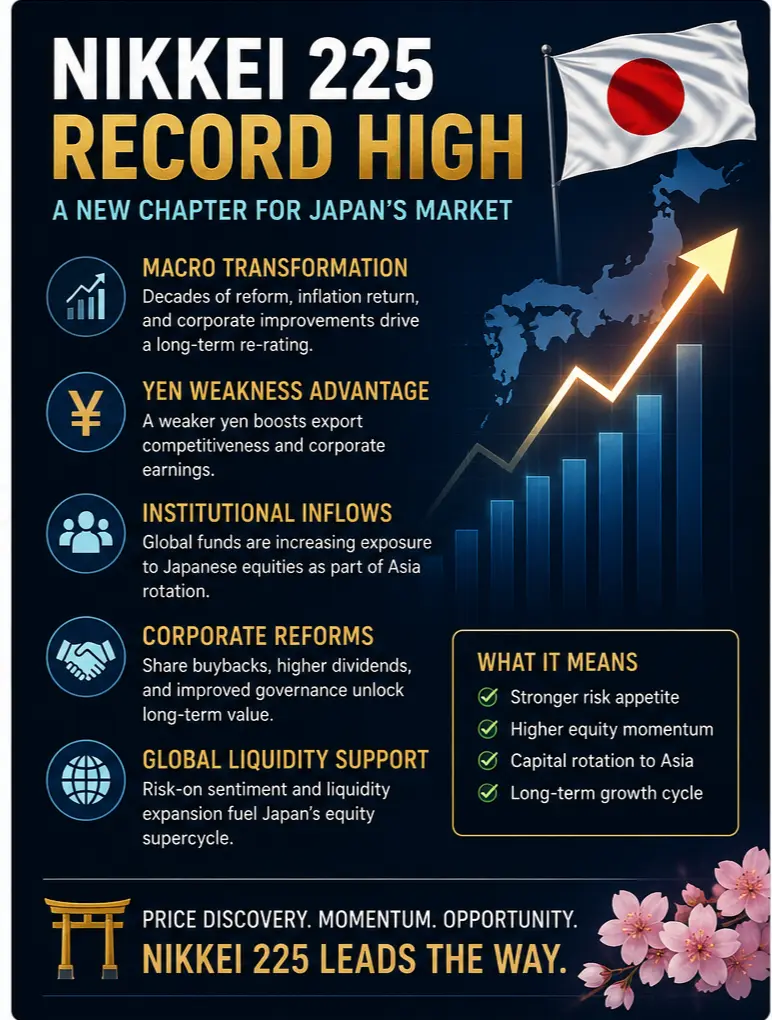
The Nikkei 225 reaching a record high marks a major structural milestone in global equity markets, signaling a long-term shift in Japan’s economic and corporate valuation cycle. This breakout is not just a technical event — it reflects decades of structural reform, corporate governance improvement, inflation return after long deflationary pressure, and global capital reallocation into Japanese equities as part of a broader Asia-Pacific growth rotation.
In global macro terms, new highs in the
JPN225-0.57%
Vortex_King
#Nikkei225RecordHigh
#JapanEquitySupercycle | Macro Momentum & Structural Breakout Analysis
Nikkei 225
The Nikkei 225 reaching a record high marks a major structural milestone in global equity markets, signaling a long-term shift in Japan’s economic and corporate valuation cycle. This breakout is not just a technical event — it reflects decades of structural reform, corporate governance improvement, inflation return after long deflationary pressure, and global capital reallocation into Japanese equities as part of a broader Asia-Pacific growth rotation.
In global macro terms, new highs in the Nikkei often indicate rising risk appetite, stronger global liquidity conditions, and renewed institutional confidence in export-driven economies.
🧭 1. Macro Meaning of Record High Breakout
A record high in Nikkei 225 typically signals:
• Structural end of long-term deflationary discounting in Japan
• Strong foreign institutional inflows into Japanese equities
• Weak Yen boosting export competitiveness
• Global risk-on capital rotation into Asia equities
• Corporate earnings re-rating phase
This environment often reflects a multi-year bullish supercycle, not just a short-term rally.
📈 2. Structural Market Breakout Analysis
When an index breaks all-time highs, technical structure shifts from range-bound accumulation into expansion mode. Key implications include:
• No overhead resistance (price discovery phase begins)
• Momentum-driven trend continuation
• Increased volatility expansion in both directions
• Strong trend-following institutional participation
This phase often attracts systematic funds and global macro allocators.
💴 3. Yen Weakness Amplification Effect
One of the strongest drivers behind Nikkei record highs is persistent Yen weakness, which creates:
• Higher overseas revenue value for Japanese exporters
• Strong earnings translation gains for multinational firms
• Increased foreign investor inflows due to FX advantage
• Competitive pricing advantage for Japanese goods globally
A weak currency acts as a hidden earnings multiplier for the index.
🏦 4. Institutional Flow Dynamics
Global funds interpret Nikkei record highs as:
• Confirmation of Japan’s structural economic normalization
• Attractive valuation compared to US mega-cap concentration
• Diversification opportunity away from saturated US equity markets
• Long-term allocation shift into Asia-Pacific equities
This leads to sustained passive and active inflows.
⚙️ 5. Corporate Governance & Reform Impact
Japan’s equity re-rating is strongly driven by structural reforms:
• Improved shareholder return policies
• Increased share buybacks
• Higher dividend payouts
• Reduced capital inefficiency
• Pressure to improve ROE metrics
These reforms have fundamentally changed investor perception of Japanese equities.
📊 6. Earnings Cycle Expansion
Nikkei strength is also supported by:
• Strong corporate earnings from exporters
• Semiconductor and technology supply chain exposure
• Industrial production recovery
• Global demand for Japanese manufacturing precision
Earnings resilience strengthens the breakout sustainability.
🌍 7. Global Macro Environment Support
Record highs in Nikkei often align with:
• Global liquidity expansion phases
• Stable or easing interest rate expectations
• Weak USD or stable FX conditions
• Strong global trade cycle recovery
• Risk-on sentiment across equity markets
Japan becomes a key beneficiary in global rotation cycles.
🧠 8. Market Psychology Shift
All-time highs change investor psychology from:
• “Recovery trade” → “Momentum continuation trade”
• “Cheap valuation” → “Re-rating expansion”
• “Mean reversion” → “Price discovery phase”
This leads to stronger trend-following behavior and reduced short-selling interest.
💧 9. Liquidity & Volatility Structure
At record highs:
• Liquidity increases due to global attention
• Volatility becomes trend-driven rather than range-bound
• Breakout trading strategies dominate
• Pullbacks attract aggressive dip buying
This creates a self-reinforcing bullish structure.
📌 10. Overall Market Outlook
The Nikkei 225 hitting record highs reflects a structural macro transformation in Japanese equities, driven by currency weakness, corporate reform, global liquidity flows, and institutional reallocation. As long as earnings remain stable and global risk sentiment supports equities, the index can remain in a sustained expansion phase with continued price discovery.
🚀 Final Conclusion
A Nikkei 225 record high is not just a technical breakout — it represents a long-term revaluation of Japan’s equity market within global portfolios. Supported by yen weakness, corporate reforms, and global liquidity rotation, this move signals a potential continuation of a multi-year Japanese equity supercycle where momentum, inflows, and earnings expansion collectively drive further upside potential.
repost-content-media
  • Reward
  • Comment
  • Repost
  • Share
#TradFi交易分享挑战
#UPS
United Parcel Service is one of the world’s largest logistics and package delivery corporations, founded in 1907 and headquartered in Atlanta, Georgia. The company operates through three major divisions: U.S. Domestic Package, International Package, and Supply Chain Solutions. UPS serves businesses and consumers across more than 200 countries with ground delivery, air cargo operations, freight forwarding, healthcare logistics, and e-commerce shipping solutions.
UPS currently employs nearly 500,000 people globally and remains one of the most important companies in the trans
UPS0.96%
HighAmbition
#TradFi交易分享挑战
#UPS
United Parcel Service is one of the world’s largest logistics and package delivery corporations, founded in 1907 and headquartered in Atlanta, Georgia. The company operates through three major divisions: U.S. Domestic Package, International Package, and Supply Chain Solutions. UPS serves businesses and consumers across more than 200 countries with ground delivery, air cargo operations, freight forwarding, healthcare logistics, and e-commerce shipping solutions.
UPS currently employs nearly 500,000 people globally and remains one of the most important companies in the transportation sector. Its massive delivery infrastructure, aircraft fleet, automated sorting facilities, and global logistics network give the company a dominant long-term position in worldwide supply chains.
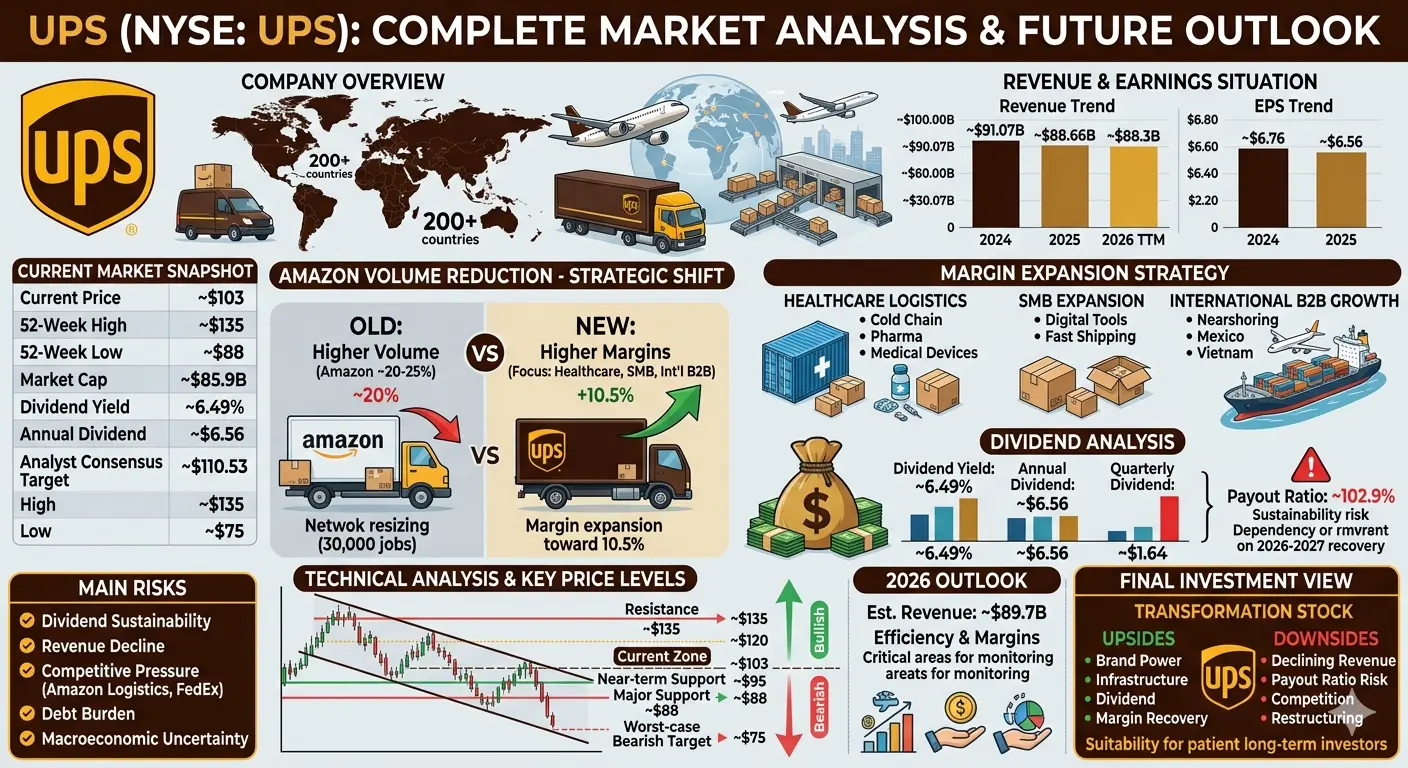
Current Market Snapshot
Metric
Value
Current Price
~$103
52-Week High
~$135
52-Week Low
~$88
Market Cap
~$85.9B
Dividend Yield
~6.49%
Annual Dividend
~$6.56
Analyst Consensus Target
~$110.53
Analyst High Target
~$135
Analyst Low Target
~$75
UPS stock is trading near the middle of its yearly range. The stock remains under long-term pressure after falling from the ~$135 region, but recent stabilization above the ~$100 zone suggests investors are cautiously watching the company’s restructuring strategy.
Revenue & Earnings Situation
UPS revenue growth has slowed significantly during the past two years. Revenue pressure mainly comes from weaker e-commerce demand normalization and the gradual reduction of Amazon shipping volumes inside the UPS network.
Year
Revenue
2024
~$91.07B
2025
~$88.66B
2026 TTM
~$88.3B
EPS performance also weakened:
Year
EPS
2024
~$6.76
2025
~$6.56
Although earnings declined, UPS delivered stronger-than-expected Q4 2025 results with operating margins improving toward 10.5%, showing that profitability improvements are slowly starting to appear.
Amazon Volume Reduction — Major Strategic Shift
The biggest story surrounding UPS is the company’s decision to reduce Amazon shipping exposure by more than 50% by late 2026. Amazon previously represented roughly 20–25% of UPS U.S. package volume.
Management intentionally chose to remove lower-margin Amazon shipments in order to focus on higher-margin business categories such as:
Healthcare logistics
SMB shipping services
International B2B logistics
Automotive and industrial supply chains
This transformation hurts short-term revenue but may improve long-term profitability and operational efficiency.
UPS is also resizing its network and cutting around 30,000 operational jobs as part of the restructuring process.
Margin Expansion Strategy
UPS is now prioritizing “quality of revenue” rather than pure shipping volume growth.
Healthcare Logistics
Healthcare delivery is becoming one of UPS’s strongest future growth engines. Pharmaceutical shipments, cold-chain transportation, medical equipment logistics, and clinical trial delivery services generate significantly higher margins compared to normal e-commerce parcels.
SMB Expansion
Small and medium-sized businesses generally pay higher shipping rates than giant enterprise clients. UPS continues expanding digital tools and logistics solutions for SMB customers to improve long-term profitability.
International B2B Growth
Global supply chains are shifting due to nearshoring and diversification trends. Companies are increasingly moving production toward Mexico, Vietnam, and other markets outside China. UPS’s international logistics infrastructure positions the company to benefit from these trade shifts.
Dividend Analysis
UPS remains highly attractive for income-focused investors because of its massive dividend yield.
Metric
Value
Dividend Yield
~6.49%
Annual Dividend
~$6.56
Quarterly Dividend
~$1.64
Payout Ratio
~102.9%
The biggest concern is the payout ratio above 100%, meaning UPS currently pays more in dividends than it earns in profits. While management still appears committed to maintaining the dividend, long-term sustainability depends heavily on earnings recovery during 2026–2027.
A future dividend reduction cannot be completely ruled out if revenue weakness continues longer than expected.
Technical Analysis & Key Price Levels
UPS currently trades inside a broader descending channel structure.
Level
Importance
~$135
Major resistance
~$120
Breakout resistance
~$110
Analyst consensus target
~$103
Current trading zone
~$95
Near-term support
~$88
Major support
~$75
Worst-case bearish target
Bullish Scenario
If UPS successfully breaks above the $120 resistance area with strong earnings improvement and margin expansion, the stock could revisit the ~$135 region over time.
Bearish Scenario
If revenue deterioration continues and dividend fears increase, the stock could retest the ~$88 support zone, with extreme downside risk toward ~$75.
Main Risks
Dividend Sustainability Risk
The high payout ratio creates pressure on cash flow and financial flexibility.
Revenue Decline
UPS revenue has already been declining for multiple years, and replacing lost Amazon volume will take time.
Competitive Pressure
Amazon is rapidly expanding its own logistics operations, while FedEx continues aggressive network optimization.
Debt Burden
UPS carries a significant debt load while simultaneously funding restructuring costs, automation investments, and dividends.
Macroeconomic Uncertainty
Global trade slowdowns, tariffs, and weaker consumer demand could negatively impact shipping volumes.
2026 Outlook
UPS management expects approximately ~$89.7B revenue during 2026 while focusing heavily on operational efficiency and margin recovery.
The next 12–18 months are extremely important because investors will closely monitor:
Margin expansion progress
Healthcare logistics growth
SMB customer growth
Revenue stabilization
Dividend safety
If the transformation strategy succeeds, UPS could emerge as a leaner and more profitable logistics company despite lower total shipment volumes.
UPS is currently a classic transformation stock. The company is sacrificing short-term revenue growth in order to build a higher-margin and more efficient business model.
The stock offers:
Strong global brand power
Massive logistics infrastructure
Attractive dividend income
Potential long-term margin recovery
However, investors must also consider:
Declining revenue trends
High payout ratio risks
Competitive pressure from Amazon
Heavy restructuring challenges
At around ~$103, UPS appears more suitable for patient long-term investors willing to tolerate volatility while the company completes its transition toward a margin-focused logistics model.
If the transformation succeeds, upside toward ~$120–$135 becomes realistic. If execution fails, downside toward ~$88 or lower remains possible.@Gate_Square @Gate广场_Official
#StockTradingChallengeUpTo17000U #USIranDraftDeal #TradeCFDWinGold
repost-content-media
  • Reward
  • Comment
  • 3
  • Share
#TradFi交易分享挑战
#xpt
May 25, 2026
Current Spot Price: $1,964.50/oz
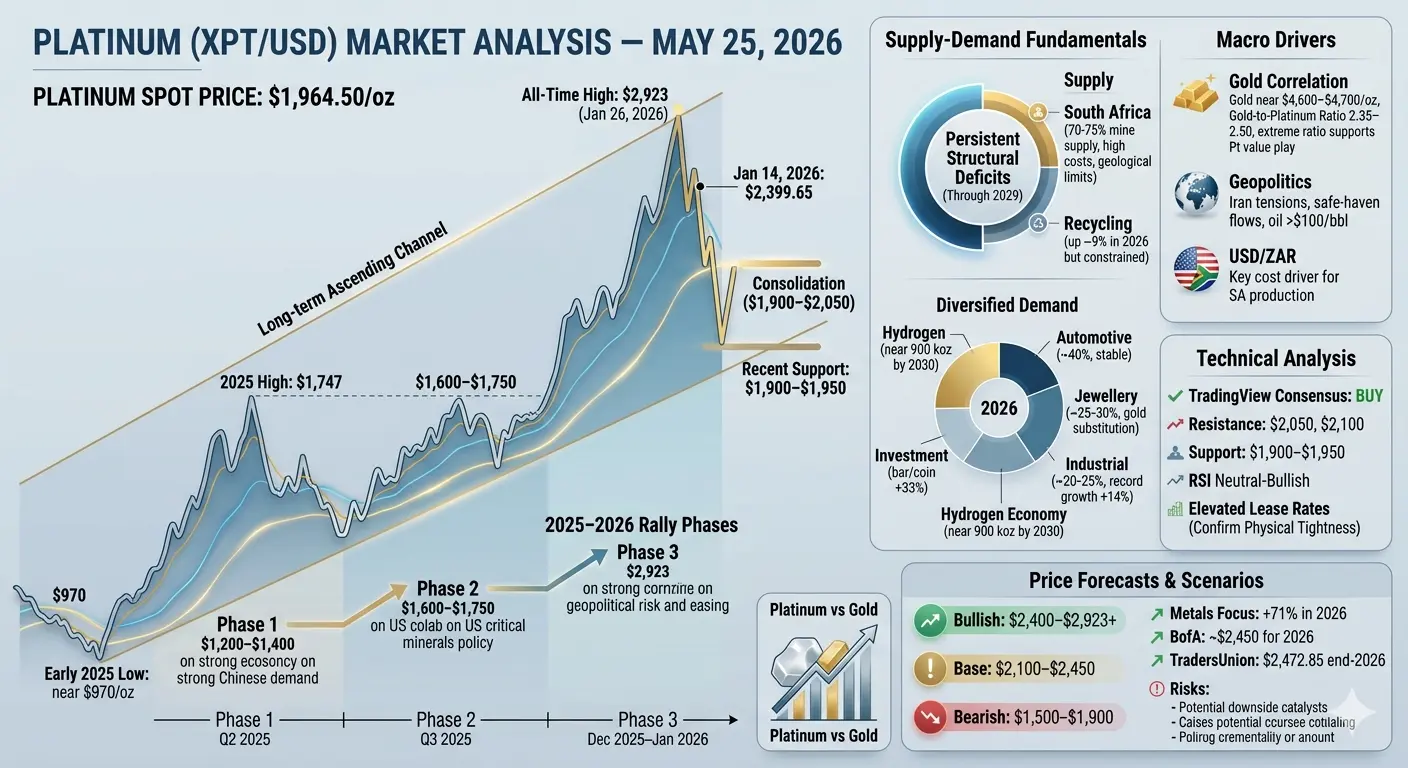
Platinum is trading at $1,964.50 per ounce on May 25, 2026. This level sits 33% below the all-time high of $2,923/oz hit on January 26, 2026, but still reflects a massive 220%+ rally from early 2025 lows near $970/oz.
Recent Price History
The 2025-2026 rally occurred in three phases:
Phase 1 (Q2 2025): Rose from $970/oz to $1,200–$1,400/oz on strong Chinese jewellery demand.
Phase 2 (Q3 2025): Climbed to $1,600–$1,750/oz amid US critical minerals policy.
Phase 3 (Dec 2025–Jan 2026): Final surge to $2,923/oz on geopolitical ris
XPT-1.14%
HighAmbition
#TradFi交易分享挑战
#xpt
May 25, 2026
Current Spot Price: $1,964.50/oz
Platinum is trading at $1,964.50 per ounce on May 25, 2026. This level sits 33% below the all-time high of $2,923/oz hit on January 26, 2026, but still reflects a massive 220%+ rally from early 2025 lows near $970/oz.
Recent Price History
The 2025-2026 rally occurred in three phases:
Phase 1 (Q2 2025): Rose from $970/oz to $1,200–$1,400/oz on strong Chinese jewellery demand.
Phase 2 (Q3 2025): Climbed to $1,600–$1,750/oz amid US critical minerals policy.
Phase 3 (Dec 2025–Jan 2026): Final surge to $2,923/oz on geopolitical risk and monetary easing.
After the sharp correction in late January (from $2,923 to near $1,900), platinum has consolidated between $1,900–$2,050. It recently found support at $1,900–$1,950 and is rebuilding momentum at current $1,964.50.
Key Milestones:
All-Time High: $2,923 (Jan 26, 2026)
Jan 14, 2026: $2,399.65
2025 High: $1,747
52-Week Range: $971.60 – $2,923.66
Current: $1,964.50
Supply-Demand Fundamentals
Persistent structural deficits remain the core bull driver. WPIC projects deficits continuing through 2029 with above-ground stocks at critically low levels (under 3 months of demand).
Supply:
South Africa (70-75% of mine supply) faces high costs and geological limits.
Recycling up ~9% in 2026 but constrained by credit and scrappage delays.
Demand (diversified):
Automotive (~40%): Stable despite minor 2% decline forecast.
Jewellery (~25-30%): Strong substitution due to gold-to-platinum ratio at 2.35–2.50 (vs historical 1.0–1.5).
Industrial (~20-25%): Record high expected in 2026, +14% growth, boosted by AI and refining.
Investment: Bar/coin demand +33% in 2026.
Hydrogen economy could add nearly 900 koz demand by 2030.
Macro Drivers
Gold Correlation: Gold near $4,600–$4,700/oz. Extreme ratio supports platinum as value play.
Rates: Easing expectations supportive; higher rates remain a risk.
Geopolitics: Iran tensions keep safe-haven flows alive and oil above $100/bbl.
USD/ZAR: Key cost driver for South African production.
Technical Analysis
Platinum stays in a long-term ascending channel. TradingView consensus: BUY.
Resistance: $2,050 (immediate), $2,100, $2,299 (2008 high), $2,400–$2,500, $2,923.
Support: $1,900–$1,950, $1,575, $1,500, $1,250–$1,300.
RSI neutral-bullish. Price above key moving averages with elevated lease rates confirming physical tightness.
CFD Trading Considerations (XPT/USD)
Contract size: 1 oz
Typical spread: $4–$5
Leverage: 1:10 to 1:50
At $1,964.50: 1 lot (100 oz) = $196,450 notional.
$1 move = $100 P/L per lot.
Long Strategy: Break above $2,050 targets $2,100 then $2,299. Stop below $1,900.
Risk Management: Max 2% account risk, hard stops, max 1:20 leverage.
Price Forecasts
Metals Focus: +71% in 2026 (implies well above $3,000 potential).
Bank of America: ~$2,450 for 2026.
TradersUnion: $2,472.85 end-2026, $2,594.79 by 2029.
WPIC: Robust investment demand, deficits through 2029.
Scenario Targets:
Bullish: $2,400 – $2,923+
Base: $2,100 – $2,450
Bearish: $1,500 – $1,900
Risks
Iran resolution (major downside catalyst)
Sharp rate hikes
Faster EV shift
Stronger recycling supply
Platinum vs Gold
At ratio 2.35–2.50, platinum offers relative value. Reversion to 2.0 could push platinum to $2,350–$2,600 even if gold stays near $4,700.
At $1,964.50, platinum offers a compelling setup with strong structural deficits, diversified demand, and attractive valuation versus gold. Traders should watch $2,050 breakout for bullish continuation while maintaining strict risk controls given volatility (52-week swing of over 200%).@Gate_Square @Gate广场_Official #TradeCFDWinGold #StockTradingChallengeUpTo17000U #DailyPolymarketHotspot
repost-content-media
  • Reward
  • Comment
  • Repost
  • Share
🔥 Gate Contract Points Airdrop, Phase 121: One person can claim 25 $DOGE3L airdrop
Gate Contract Points will soon launch the 25 $DOGE3L airdrop rewards
All users can click the link below to participate and claim the airdrop benefits
👉 Airdrop claim portal: https://www.gate.com/futures/points
⏰ Airdrop claim start time: 2026 年 5 月 27 日 18:00 (UTC+8)
Learn more about the event details, and earn points with no threshold to receive the airdrop:
https://www.gate.com/announcements/article/51345
DOGE3L-6.71%
discovery
🔥 Gate Contract Points Airdrop, Phase 121: One person can claim 25 $DOGE3L airdrop
Gate Contract Points will soon launch the 25 $DOGE3L airdrop rewards
All users can click the link below to participate and claim the airdrop benefits
👉 Airdrop claim portal: https://www.gate.com/futures/points
⏰ Airdrop claim start time: 2026 年 5 月 27 日 18:00 (UTC+8)
Learn more about the event details, and earn points with no threshold to receive the airdrop:
https://www.gate.com/announcements/article/51345
repost-content-media
  • Reward
  • Comment
  • 2
  • Share
#DailyPolymarketHotspot
The US-Iran nuclear negotiations ahead of the May 31, 2026 deadline have become a major geopolitical risk catalyst for global financial markets. According to prediction markets such as Polymarket, the probability of a nuclear deal stands near 15%, while 85% of participants expect no agreement.
Bitcoin is currently trading around $77,300, after fluctuating between $74,000 and $80,000 in recent sessions. This positioning reflects uncertainty across risk markets as traders price in two very different macro outcomes: geopolitical escalation versus diplomatic de-escalation.
BTC-2.1%
discovery
#DailyPolymarketHotspot
The US-Iran nuclear negotiations ahead of the May 31, 2026 deadline have become a major geopolitical risk catalyst for global financial markets. According to prediction markets such as Polymarket, the probability of a nuclear deal stands near 15%, while 85% of participants expect no agreement.
Bitcoin is currently trading around $77,300, after fluctuating between $74,000 and $80,000 in recent sessions. This positioning reflects uncertainty across risk markets as traders price in two very different macro outcomes: geopolitical escalation versus diplomatic de-escalation.
Part I: US-Iran Nuclear Negotiations — Current Status
The current round of negotiations is part of a long-standing geopolitical dispute between the United States and Iran over nuclear enrichment capabilities and sanctions relief. Since the US withdrawal from the JCPOA framework in 2018, tensions have remained elevated, with intermittent diplomatic efforts failing to produce a lasting agreement.
In 2025–2026, renewed negotiations have taken place in multiple locations, including indirect mediation channels. The key pressure point is the May 31 deadline, which markets now treat as a binary risk event.
Core Disputes
Uranium Enrichment Limits: US demands strict caps or dismantlement, while Iran insists on sovereign enrichment rights
Stockpile Reduction: Approximately 440 kg of enriched uranium remains a key negotiation point
Sanctions Relief: Iran seeks removal of oil export restrictions and frozen asset releases
Verification Systems: Disagreement over inspection intensity and access protocols
The negotiation structure remains fragile, with limited time for convergence on core issues.
Part II: Market Probability and Sentiment Structure
Prediction markets currently price the outcome as heavily skewed toward failure:
No Deal: ~85% probability
Deal Reached: ~15% probability
Earlier in May, expectations briefly reached as high as 70% probability of a deal, but sentiment reversed as negotiations slowed and unresolved structural issues became more visible.
This shift indicates that markets now expect either:
Continued stalemate
Or delayed agreement beyond the deadline
Part III: Bitcoin Market Position and Current Structure
Bitcoin is currently trading near $77,300, consolidating after recent volatility. The price structure reflects a balance between geopolitical uncertainty and sustained institutional demand.
Key Price Levels
Immediate Support: $76,000 – $76,500
Strong Support: $74,000 – $75,000
Critical Support: $72,000 – $73,000
Immediate Resistance: $78,000 – $78,500
Major Resistance: $80,000 – $82,000
Extended Resistance: $85,000 – $90,000
Bitcoin remains in a compression phase where breakout direction will likely depend on macro catalysts, especially geopolitical developments.
Part IV: Scenario Analysis — No Nuclear Deal (85%)
A failure to reach agreement by May 31 would likely increase geopolitical tension in the Middle East, particularly around the Strait of Hormuz, through which nearly 20% of global oil supply passes.
Short-Term Market Reaction
Bitcoin could initially react with volatility:
Possible drop toward $72,000 – $75,000
Increased liquidations in leveraged derivatives markets
Temporary risk-off sentiment across equities and crypto
However, Bitcoin may also attract defensive capital flows as a non-sovereign asset.
Medium-Term Outlook
If tensions escalate:
Oil prices may rise above $90 – $110 per barrel
Inflation expectations could increase globally
Central banks may delay rate cuts
Bitcoin range in this scenario:
$68,000 – $82,000
Long-Term Impact
Despite short-term volatility, structural demand remains supported by:
Spot ETF inflows
Institutional accumulation
Post-2024 halving supply reduction
Long-term projection remains:
$120,000+ potential in 2025 cycle continuation
Part V: Scenario Analysis — Nuclear Deal Reached (15%)
A successful agreement would represent a major geopolitical de-escalation event, significantly reducing global risk premiums.
Immediate Market Reaction
Bitcoin breakout above $80,000 – $82,000
Potential rally toward $85,000 – $90,000
Strong risk-on sentiment across global markets
Medium-Term Effects
A deal would likely:
Ease oil supply constraints
Reduce inflation pressure
Increase probability of Fed rate cuts
Improve global liquidity conditions
Bitcoin price range:
$85,000 – $110,000
Extended Bullish Case
If macro liquidity expands:
$120,000 – $150,000 (late 2025 potential range)
Institutional inflows accelerate via ETFs
Corporate adoption increases
Part VI: Technical Market Structure
Bitcoin remains in a strong macro uptrend despite short-term consolidation.
Support Zones
$76,000–$76,500: short-term defense
$74,000–$75,000: accumulation zone
$72,000–$73,000: breakdown threshold
Resistance Zones
$78,000–$78,500: immediate ceiling
$80,000–$82,000: breakout trigger
$85,000–$90,000: major expansion zone
A sustained break above $82,000 could trigger accelerated momentum toward psychological levels above $90,000.
Part VII: Macro Drivers Beyond Geopolitics
Bitcoin pricing is also influenced by broader macroeconomic conditions:
Federal Reserve Policy: Rate cuts would support risk assets
ETF Demand: Continuous inflows create structural buying pressure
Liquidity Cycles: Global M2 expansion supports crypto valuations
Post-Halving Supply Shock: Reduced issuance increases scarcity pressure
Institutional forecasts remain highly optimistic:
Some models project $120,000–$150,000 in 2025
Long-term projections extend beyond $200,000 under bullish liquidity cycles
Part VIII: Risk Factors
Downside Risks
Military escalation in Middle East
Oil shock above $110 per barrel
Global liquidity tightening
Regulatory pressure on crypto markets
Breakdown below $72,000 support zone
In extreme scenarios, Bitcoin could temporarily retrace toward $65,000–$68,000.
Volatility Conditions
Implied volatility remains elevated due to:
Options market uncertainty
Geopolitical binary event risk
Leveraged derivatives exposure
Part IX: Market Psychology and Positioning
Market participants are currently positioned cautiously:
Neutral funding rates in derivatives
Balanced long/short exposure
Increased hedging activity
Elevated demand for downside protection
This suggests that traders are not aggressively directional, but rather waiting for the May 31 resolution before committing to larger positions.
The US-Iran nuclear negotiations represent a high-impact geopolitical catalyst that could significantly influence Bitcoin’s short-term trajectory while reinforcing its longer-term macro narrative.
No Deal (85%) scenario: Bitcoin likely trades between $68,000 and $82,000 with volatility spikes
Deal (15%) scenario: Bitcoin could rally toward $85,000–$110,000 with potential extension toward $120,000+
At approximately $77,300, Bitcoin is positioned at a critical equilibrium point, where macro clarity will determine the next directional expansion phase.
Regardless of outcome, structural drivers such as ETF adoption, halving supply reduction, and institutional accumulation continue to support a long-term bullish framework.@Gate_Square @Gate广场_Official #TradfiTradingChallenge #
💙💙Thank you for the amazing information! 💙💙
  • Reward
  • Comment
  • Repost
  • Share
#TradFiTradingSharingChallenge
#XPT ⚪ Is Platinum Preparing for a Major Move?
Platinum is the precious metal most overlook but in 2026, it's quietly building one of the most compelling breakout setups in commodities. Structural deficits, industrial demand growth, and macro tailwinds suggest XPT could be preparing for something significant.
🔥 Precious Metals Momentum: PGM Breakout
The platinum group metals basket broke from its long-term trading range in 2025, lifting producer margins after three years of compression. In January 2026, platinum surged to a new all-time high of ~$2,923.70/oz, b
XPT-1.14%
XPD-1.1%
XAU-1.47%
discovery
#TradFiTradingSharingChallenge
#XPT ⚪ Is Platinum Preparing for a Major Move?
Platinum is the precious metal most overlook but in 2026, it's quietly building one of the most compelling breakout setups in commodities. Structural deficits, industrial demand growth, and macro tailwinds suggest XPT could be preparing for something significant.
🔥 Precious Metals Momentum: PGM Breakout
The platinum group metals basket broke from its long-term trading range in 2025, lifting producer margins after three years of compression. In January 2026, platinum surged to a new all-time high of ~$2,923.70/oz, breaking above its 2008 record. Current pricing ~$1,973.85/oz represents a healthy pullback the structural drivers remain intact. Platinum is up 130%+ since last year. Metals Focus forecasts an additional 71% price gain for 2026 as supply deficits persist. Rhodium +62%, palladium +37%. The entire PGM complex is in structural undersupply not speculative spike, fundamentals-driven repricing.
📉 Dollar Index: The Weakening USD Catalyst
DXY broke below 99, hitting a 4-year low of 95.5 in January 2026. Weaker dollar directly benefits dollar-denominated commodities including platinum. Each DXY decline point amplifies non-US buyer purchasing power, increasing global precious metals demand. Fed policy pivot toward rate cuts, accelerating de-dollarization, and geopolitical uncertainty all point to continued dollar weakness a persistent platinum tailwind. The DXY-XPT inverse correlation is one of commodities' cleanest macro relationships.
🏭 Industrial Demand Growth: Beyond Jewelry
Platinum sits at the intersection of precious metal and industrial commodity uniquely sensitive to real-economy trends. 2026 demand drivers: hydrogen fuel cell technology adoption accelerating, automotive catalytic converter requirements persisting (hybrids still need PGMs), Chinese industrial demand surging under new contracts. Heraeus notes BEV adoption reduces automotive PGM demand long-term, but the transition period creates volatile, elevated demand as hybrid production peaks before full EV conversion. The market "remains tight" supply still falls short, just by a smaller margin.
🛡️ Inflation Hedge: Gold's Shadow Lifts Platinum
Gold hit $4,713/oz in 2026, creating massive precious metals spillover. Investors discover platinum offers similar monetary properties at a historically discounted ratio. The gold-platinum ratio is compressing as platinum catches up this relative value dynamic attracts institutional flows. When gold becomes expensive, capital rotates into platinum as "the cheaper precious metal with industrial upside." The inflation hedge narrative isn't just gold anymore.
🚀 Bullish Breakout Possibility: The Setup
After January's all-time high, platinum consolidated to $1,970s healthy pullback within larger uptrend. Catalysts align: analysts target $2,800/oz for 2026, Metals Focus forecasts 71% gains, dollar weakness continues, industrial demand grows, gold rally creates rotation. If platinum reclaims $2,200 with volume, the path to $2,800+ opens. The breakout isn't wishfulness it's structural deficits meeting macro tailwinds.
Platinum spent decades as gold's understated sibling. In 2026, fundamentals suggest it might finally take center stage.
#Platinum #PreciousMetals #PGM
💙💙Thank you for the amazing information and for sharing! 💙💙
  • Reward
  • Comment
  • Repost
  • Share
#TradFi交易分享挑战 XPT recent market trends show the following characteristics:
1 Price Movement
As of May 23, 2026, the spot platinum XPT price is approximately $1,921.75 per ounce, down 2.31% from the previous trading day.
Recently, prices have fluctuated between $1,900 and $2,000, not breaking through the key resistance level of $2,000 nor falling below the support level of $1,800.
2 Technical Analysis
The price is below the 20-day and 50-day moving averages, indicating short-term and medium-term momentum are weak, but it remains above the 200-day moving average (about $1,841), maintaini
XPTUSD-0.78%
discovery
#TradFi交易分享挑战 XPT recent market trends show the following characteristics:
1 Price Movement
As of May 23, 2026, the spot platinum XPT price is approximately $1,921.75 per ounce, down 2.31% from the previous trading day.
Recently, prices have fluctuated between $1,900 and $2,000, not breaking through the key resistance level of $2,000 nor falling below the support level of $1,800.
2 Technical Analysis
The price is below the 20-day and 50-day moving averages, indicating short-term and medium-term momentum are weak, but it remains above the 200-day moving average (about $1,841), maintaining long-term support.
Momentum indicators such as MACD and ADX signal a “sell,” with RSI at 46.11, approaching oversold territory, suggesting the market is dominated by sellers but no clear reversal signals have appeared yet.
3 Macro Factors
Oil prices have rebounded (Brent crude surpassing $102), and interest rates remain high (U.S. 10-year Treasury yield around 4.4%), which suppresses platinum’s appeal as a non-yielding asset and weakens buying interest.
Geopolitical tensions (such as conflicts in the Middle East) continue to impact energy prices and inflation expectations, indirectly affecting market sentiment for platinum.
4 Supply and Demand Fundamentals
On the supply side, mining output from South Africa and Russia remains constrained by aging infrastructure and sanctions, with an estimated supply gap of about 317k ounces in 2026.
On the demand side, demand in sectors like automotive catalysts and hydrogen energy continues to grow, but the slowdown in electric vehicle growth has somewhat impacted the demand growth rate for platinum.
Overall assessment: Recently, platinum XPT is in a consolidation phase, likely to continue fluctuating between $1,800 and $2,000 in the short term. If it can hold above $1,800 and break through the $2,000 resistance, an upward trend may begin; if it falls below $1,800, it could further decline toward the $1,600 region. Investors should pay attention to macro policy changes, geopolitical developments, and supply-demand data, and operate cautiously.
Future Trend Analysis
Based on current market information and technical analysis, the subsequent trend of XPT may exhibit the following characteristics:
1. Short-term trend (1-3 months)
Mainly consolidating: Currently, platinum prices fluctuate between $1,900 and $2,000, with technical indicators showing short-term moving averages (such as 5-day, 10-day) intertwined with long-term averages (such as 30-day, 200-day), indicating cautious market sentiment.
If it can stay above $1,900, it may continue to oscillate between $1,900 and $2,050; if it drops below $1,900, support may be at $1,850.
Technical indicator signals: RSI (14-day) at about 46.11, in neutral territory, with no obvious overbought or oversold signals; MACD shows the fast and slow lines hovering near zero, with no clear crossovers or divergence, so short-term fluctuations may be influenced by market sentiment and capital flows.
2. Medium-term trend (3-6 months)
Supply and demand fundamentals support: Global platinum supply remains constrained, with major producing regions like South Africa and Russia affected by power crises and equipment limitations, prolonging the supply shortage.
Demand in sectors like automotive catalysts and hydrogen energy remains strong, especially with significant growth in platinum jewelry demand in China, providing price support.
If the supply-demand gap continues to widen, platinum prices could break through $2,000 and move toward the $2,100–$2,200 range.
Macro factors influence: The Federal Reserve’s rate cut expectations persist; if real interest rates decline, the opportunity cost of holding non-yielding assets like platinum decreases, increasing its attractiveness.
Additionally, geopolitical tensions (such as conflicts in the Middle East) may continue to impact energy prices and inflation expectations, indirectly affecting market sentiment for platinum.
3 Long-term trend (beyond 6 months)
Industrial demand growth: As global hydrogen infrastructure construction accelerates, platinum demand in the hydrogen sector is expected to continue increasing, becoming a core growth area.
Meanwhile, demand in automotive catalysts, electronics, and medical fields remains steady, pushing platinum’s industrial attribute from a traditional “cyclical commodity” toward a “strategic metal.”
Investment demand potential: As a scarce precious metal, platinum’s reserve asset status is being reassessed by global central banks. In 2025, the global central bank platinum reserves increased by 8 tons year-over-year, making it an important choice for reserve diversification.
If investment demand continues to rise, it could further push up platinum prices.
Risk warning: Platinum prices are influenced by macroeconomic, geopolitical, and supply-demand factors, leading to high volatility. Investors should closely monitor Federal Reserve monetary policy, South Africa’s power supply, and hydrogen industry developments, manage positions prudently, and avoid chasing rallies or panic selling. $XPTUSD
💙💙非常感謝您提供如此寶貴的信息,您真是太棒了! 💙💙
  • Reward
  • Comment
  • Repost
  • Share
#Polymarket每日热点
Loracle's aggressive short position in $HYPE is one of the prime examples of how whale activity can disrupt prediction markets and token sentiment.
Whale Effect in $HYPE
The shift from long to short in April signals a belief that HYPE is overvalued.
The $140 million short position is not only directional but also a liquidity event. Other investors will react to this imbalance.
The large short positions at $64 are creating a psychological ceiling. Investors may hesitate to break above this level.
Smaller players often reinforce the movement, mirroring whale sentiment.
If HYPE
HYPE-1.35%
discovery
#Polymarket每日热点
Loracle's aggressive short position in $HYPE is one of the prime examples of how whale activity can disrupt prediction markets and token sentiment.
Whale Effect in $HYPE
The shift from long to short in April signals a belief that HYPE is overvalued.
The $140 million short position is not only directional but also a liquidity event. Other investors will react to this imbalance.
The large short positions at $64 are creating a psychological ceiling. Investors may hesitate to break above this level.
Smaller players often reinforce the movement, mirroring whale sentiment.
If HYPE unexpectedly rises, Loracle's excessively large short position could cause a serious squeeze.
Resistance Zone: The $64-$68 range is currently heavily defended by whale short positions.
Support Levels: $55-$58 remains a key liquidity band where buyers are entering.
Investors should expect sharp fluctuations as they test whale belief.
Any unexpected bullish event (partnership, IPO, meme-driven excitement) could lead to positions being closed.
Trading Strategy
Consider short-term volatility: Trade within the ranges defined by the whale, with short-term movements.
Don't blindly follow Loracle – whales may hedge elsewhere.
Use tight stop-loss orders; whale-driven movements can quickly reverse.
If a squeeze risk arises, small long positions around $55-58 could yield profits.
Polymarket Daily – $HYPE Outlook (May 25)
Whale took a $75 million short position on Loracle at $64, total short position > $140 million.
Resistance: $64-68 | Support: $55-58.
Fluctuations may occur in the twilight, watch out for the risk of a squeeze. The market is trending downwards, but this trend could be fragile if the momentum changes.
Bearish Scenario
Loracle's $140 million short position is creating a high ceiling at the $64-68 level.
Smaller long positions may surrender, reinforcing downward momentum.
Investors are hesitant to challenge the whale's belief, leading to self-fulfilling downward pressure.
If sales increase and liquidity decreases, the price could fall to $50-55.
If HYPE rises with unexpected catalysts (partnerships, listings, meme-driven excitement), Loracle's massive short position could backfire.
Retail investors may deliberately oppose whale positions, triggering volatility.
A break above $68 could trigger panic closing and quickly send the price towards $75-80.
If a squeeze occurs, the price could fall to $75-80.
Trade volatility within the ranges set by the whale ($55–$68).
Open small contractual long positions around $55–$58 with tight stop losses.
Watch for catalysts that could shift market sentiment — meme virality, stock market listings, or whale hedging signals.
Whale short positions are dominant, targeting $50–$55.
Risk of short squeeze, breakout towards $75–$80.
Scalp on volatility, hedge with contractual long positions, and watch for catalysts.
‍$HYPE
💙💙Thank you for the amazing information and for sharing! ,💙💙
  • Reward
  • Comment
  • Repost
  • Share
🥇 Gate TradFi Gold Lucky Bag Phase 5 is back in full force
High winning chances! Premium gold rewards!
The Gold Lucky Bag series has already given away over 5KG of gold
This phase brings a total of 2,304g of gold rewards
Every 10 minutes, 2g of gold will be drawn: 1 winner gets 1g of gold, and 10 additional winners share 1g of gold
Complete a single trade ≥ 1,000 USDT to unlock 5 consecutive lucky draw chances.
You can win repeatedly. Keep trading, keep drawing!
⏰ Event Period: May 25, 2026, 07:40 – June 9, 2026, 08:20 (UTC)
👉 Join Now: https://www.gate.com/campaigns/gold-lucky-draws-s5
‍#Ga
XAUUSD-1.49%
Gate_Square
🥇 Gate TradFi Gold Lucky Bag Phase 5 is back in full force
High winning chances! Premium gold rewards!
The Gold Lucky Bag series has already given away over 5KG of gold
This phase brings a total of 2,304g of gold rewards
Every 10 minutes, 2g of gold will be drawn: 1 winner gets 1g of gold, and 10 additional winners share 1g of gold
Complete a single trade ≥ 1,000 USDT to unlock 5 consecutive lucky draw chances.
You can win repeatedly. Keep trading, keep drawing!
⏰ Event Period: May 25, 2026, 07:40 – June 9, 2026, 08:20 (UTC)
👉 Join Now: https://www.gate.com/campaigns/gold-lucky-draws-s5
#Gate #TradFi #Gold #TradeCFDWinGold
repost-content-media
  • Reward
  • Comment
  • Repost
  • Share
Crypto scams are everywhere. One image helps you quickly spot the common tricks.
Remember these tips. Don‘t let your hard-earned assets fall into the wrong hands.
Stay vigilant. Trade safely.
#LearnWithGateSquare
Gate_Square
Crypto scams are everywhere. One image helps you quickly spot the common tricks.
Remember these tips. Don‘t let your hard-earned assets fall into the wrong hands.
Stay vigilant. Trade safely.
#LearnWithGateSquare
repost-content-media
  • Reward
  • Comment
  • Repost
  • Share
🚨 Community Buzz Today: $UB surges over 25% in 24h — is the meme coin madness back?
📈 $UB up over 25% in 24h
📈 More than 240% gains in the past 30 days
📈 Price keeps climbing while volume lags behind
📈 Traders are starting to worry about bearish divergence
Everyone’s discussing:
🔥 Can UB keep pumping higher?
🔥 Chase now or wait for a pullback?
🔥 Will weak volume trigger a sudden dump?
🔥 Which low-cap coin could explode next?
🎁 Join the discussion
Join daily discussions for a chance to win 250U futures bonus!
👉 Join Gate Hot Chat👇
https://gate.onelink.me/Hls0/group?chatroom=
UB11.44%
Gate_Square
🚨 Community Buzz Today: $UB surges over 25% in 24h — is the meme coin madness back?
📈 $UB up over 25% in 24h
📈 More than 240% gains in the past 30 days
📈 Price keeps climbing while volume lags behind
📈 Traders are starting to worry about bearish divergence
Everyone’s discussing:
🔥 Can UB keep pumping higher?
🔥 Chase now or wait for a pullback?
🔥 Will weak volume trigger a sudden dump?
🔥 Which low-cap coin could explode next?
🎁 Join the discussion
Join daily discussions for a chance to win 250U futures bonus!
👉 Join Gate Hot Chat👇
https://gate.onelink.me/Hls0/group?chatroom=group&ref=VVhBVA9a&ref_type=105
repost-content-media
  • Reward
  • Comment
  • Repost
  • Share
Home Loans Meet Crypto
Bitcoin is no longer just an investment vehicle; it's becoming the key to home ownership. In the US, the Trump administration has officially given the green light for Fannie Mae and Freddie Mac to accept cryptocurrencies as mortgage collateral.
🔹 The Federal Housing Finance Agency (FHFA), in a directive issued on June 25, 2025, ordered Fannie Mae and Freddie Mac to consider crypto assets in mortgage risk assessments. This decision completely reversed the previous policy that disqualified cryptocurrencies from mortgage applications.
🔹 In March 2026, a major US exchange
BTC-2.1%
USDC0.05%
MILO-0.05%
User_any
Home Loans Meet Crypto
Bitcoin is no longer just an investment vehicle; it's becoming the key to home ownership. In the US, the Trump administration has officially given the green light for Fannie Mae and Freddie Mac to accept cryptocurrencies as mortgage collateral.
🔹 The Federal Housing Finance Agency (FHFA), in a directive issued on June 25, 2025, ordered Fannie Mae and Freddie Mac to consider crypto assets in mortgage risk assessments. This decision completely reversed the previous policy that disqualified cryptocurrencies from mortgage applications.
🔹 In March 2026, a major US exchange partnered with Better Home & Finance to launch the first Fannie Mae-backed crypto-collateralized mortgage product. This model allows investors to purchase homes by using their Bitcoin or USDC as collateral without having to sell it.
🔹 A volatility discount remains in place: roughly 40-50% of your Bitcoin's value counts toward the loan assessment. Additionally, assets must sit on regulated, licensed US platforms rather than self-custody wallets to qualify under the federal framework.
🔹 Meanwhile, pioneering crypto mortgage providers like Milo have been accepting self-custody wallets since 2022, offering an alternative path and already surpassing $100 million in total loan volume.
Living without selling, earning by holding. Do you think the crypto mortgage model will create a lasting transformation in the real estate market?
$BTC
repost-content-media
  • Reward
  • Comment
  • Repost
  • Share
Ethereum is shifting its entire development focus to establish absolute on-chain anonymity.
Co-founder Vitalik Buterin just unveiled a streamlined engineering framework designed to weave native privacy directly into the base layer.
The Ethereum Foundation is actively narrowing its organizational scope to protect user sovereignty. The development core is accelerating three major technical updates scheduled for the Hegota hard fork in late 2026:
🔹 Account Abstraction + FOCIL: This combination forces private transactions into blocks, bypassing malicious validator censorship entirely.
🔹 Keyed No
ETH-2.66%
User_any
Ethereum is shifting its entire development focus to establish absolute on-chain anonymity.
Co-founder Vitalik Buterin just unveiled a streamlined engineering framework designed to weave native privacy directly into the base layer.
The Ethereum Foundation is actively narrowing its organizational scope to protect user sovereignty. The development core is accelerating three major technical updates scheduled for the Hegota hard fork in late 2026:
🔹 Account Abstraction + FOCIL: This combination forces private transactions into blocks, bypassing malicious validator censorship entirely.
🔹 Keyed Nonces: This upgrade enables highly fluid private asset transfers while supporting parallel transaction execution.
🔹 Kohaku Wallet Integration: This client-layer update shields local account data, blocking third-party metadata surveillance completely.
This architectural evolution transforms ETH into fully fungible digital cash. The network prioritizes fundamental censorship resistance and user protection over raw processing speed.
The era of total public wallet tracking is approaching its expiration date.
Soon your financial history will remain your own private business, assuming you remember your seed phrase.
Friends, what are your thoughts on this massive privacy pivot?
#EthereumPrivacyUpgradeRoadmap
repost-content-media
  • Reward
  • Comment
  • Repost
  • Share
#USIranDraftDeal Peace Loading? 🤔
The draft is on the table, and the world can almost hear the ink drying. After months of a grinding military standoff that paralyzed global shipping, the United States and Iran have placed a concrete Memorandum of Understanding within reach. We are looking at a blueprint that swaps mine-clearing in the Strait of Hormuz for a resumption of Iranian oil sales — a deal that could rewrite energy markets by next week.
🔹 According to a final draft obtained by Al Arabiya on May 25, the agreement establishes an immediate 60-day extension of the ceasefire, with the op
User_any
#USIranDraftDeal Peace Loading? 🤔
The draft is on the table, and the world can almost hear the ink drying. After months of a grinding military standoff that paralyzed global shipping, the United States and Iran have placed a concrete Memorandum of Understanding within reach. We are looking at a blueprint that swaps mine-clearing in the Strait of Hormuz for a resumption of Iranian oil sales — a deal that could rewrite energy markets by next week.
🔹 According to a final draft obtained by Al Arabiya on May 25, the agreement establishes an immediate 60-day extension of the ceasefire, with the option to renew. The core of the deal is a simple, powerful exchange: Iran commits to clearing all naval mines and restoring free passage through the Strait of Hormuz, guaranteeing zero tolls for commercial vessels. In return, the U.S. lifts its blockade of Iranian ports and issues specific sanctions waivers so Tehran can freely sell oil during this window.
🔹 The sequencing is critical and trust-based. U.S. Secretary of State Marco Rubio described this as a phased "relief for performance" approach. Iran must act first to remove maritime obstacles, and only then do the restrictions ease. Crucially, both sides agree to continue negotiations on the long-term nuclear file during this peace window, with Iran verbally committing to never pursuing a nuclear weapon.
🔹 Markets are already exhaling a sigh of relief, pricing in the reopening of the most critical chokepoint on Earth. By Monday, Brent crude oil plunged 5.4% to $97.97 per barrel, sliding below the $100 threshold for the first time since the blockade paralyzed 20% of global oil traffic. This steep drop is a significant factor helping to cool global inflation pressures almost instantly, with U.S. equity futures climbing toward fresh records as geopolitical risk premiums evaporate.
🔹 Diplomacy is working overtime to close the remaining gaps. Pakistan has played a central mediation role, with military chief Field Marshal Asim Munir traveling to Tehran to help finalize the text. U.S. officials remain cautious, noting the blockade stays in "full force" until a final signature is dry, but the White House is optimistic that remaining hurdles—such as the exact timeline for unfreezing Iranian assets—can be solved within hours.
A deal that sweeps mines from the water while pumping barrels back into the market is exactly the kind of supply-side shock a stressed global economy needs right now. Are you reading this as the all-clear for a sustained risk-on rotation, or just a 60-day ceasefire rally?
repost-content-media
  • Reward
  • Comment
  • Repost
  • Share
$16B On-Chain T-Bills?
Tokenized U.S. Treasuries just crossed $15.8 billion in market value, nearly doubling since the start of 2026. That is not a niche experiment anymore — it is the fastest-growing institutional corner of digital finance, and Franklin Templeton's BENJI product has quietly vaulted past $2.05 billion in assets under management.
🔹 Franklin Templeton now ranks among the top five tokenized Treasury issuers globally, with BENJI deployed across nine blockchains and peer-to-peer share transfers going live this year. The fund more than doubled its AUM year-to-date, reflecting the s
BENJI-0.69%
CRCLX-9.01%
ONDO-5.9%
MA-0.86%
User_any
$16B On-Chain T-Bills?
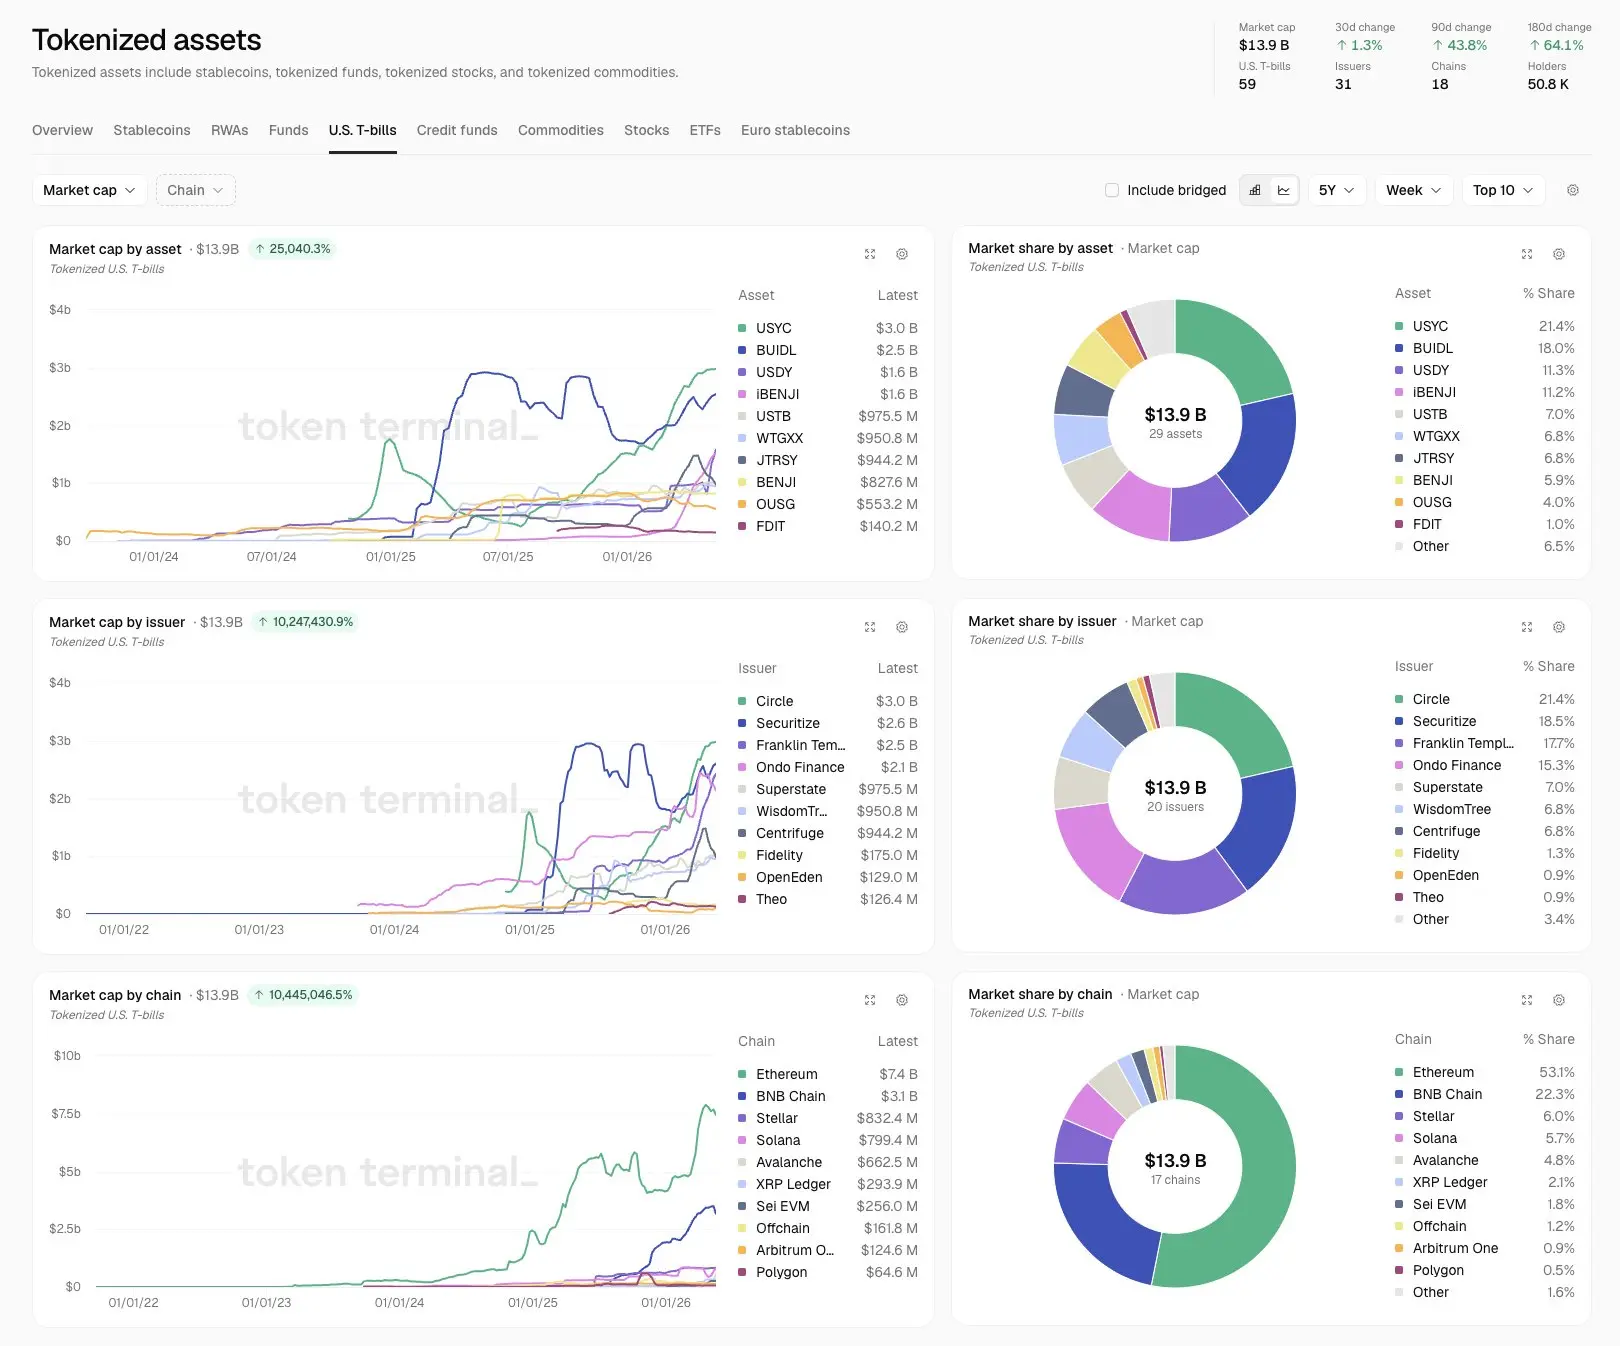
Tokenized U.S. Treasuries just crossed $15.8 billion in market value, nearly doubling since the start of 2026. That is not a niche experiment anymore — it is the fastest-growing institutional corner of digital finance, and Franklin Templeton's BENJI product has quietly vaulted past $2.05 billion in assets under management.
🔹 Franklin Templeton now ranks among the top five tokenized Treasury issuers globally, with BENJI deployed across nine blockchains and peer-to-peer share transfers going live this year. The fund more than doubled its AUM year-to-date, reflecting the same institutional appetite that pushed BlackRock's BUIDL to a $2.58 billion AAA-mf-rated milestone and Circle's USYC to $2.91 billion.
🔹 The broader tokenized real-world asset market surged to $34 billion, more than tripling from $5.4 billion at the start of 2025. Tokenized Treasuries account for roughly half of that total, and the remaining runway is enormous — they still represent just 0.2% of the $6.6 trillion short-duration U.S. Treasury market.
🔹 Ondo Finance, JPMorgan's Kinexys, Mastercard, and Ripple completed a landmark cross-border redemption of tokenized Treasuries in under five seconds earlier this May. That pilot connected public blockchain infrastructure with interbank settlement rails, demonstrating that tokenized government debt can move seamlessly between on-chain assets and traditional fiat channels outside banking hours.
🔹 The catalyst behind this surge is straightforward: tokenized Treasuries offer around 3.4% to 3.5% annualized yield, backed by the full faith and credit of the U.S. government. Institutions holding idle stablecoins are rotating into yield-bearing, programmable cash equivalents that settle instantly and integrate directly into collateral management systems.
Wall Street is no longer testing the waters — it is building the pipes. A market that took years to reach its first $10 billion just absorbed the next $10 billion in under five months. Are you watching this transformation from the sidelines, or are you already earning yield on the safest asset class now living on-chain?
#USIranDraftDeal
#TradFiTradingSharingChallenge
#StockTradingChallengeUpTo17000U
#TradeCFDWinGold
repost-content-media
  • Reward
  • Comment
  • Repost
  • Share
🚀 CELESTIA ($TIA): REAL INFRASTRUCTURE PLAY… OR JUST ANOTHER NARRATIVE PUMP? 👀
While most altcoins are still struggling for attention, Celestia is suddenly back in the spotlight.
$TIA exploded toward $0.4782, massively outperforming the broader market as traders rotated aggressively into modular infrastructure plays.
But beneath the hype, the market is split into two camps:
⚡ Bulls see the beginning of an “Infra Supercycle”
⚠️ Bears see another speculation-driven rally without enough real adoption
Here’s what’s REALLY happening👇
🔹 Institutional capital is rotating into blockchain infrastru
TIA-1.72%
LINK-1.98%
SUI-3.99%
ETH-2.66%
User_any
🚀 CELESTIA ($TIA): REAL INFRASTRUCTURE PLAY… OR JUST ANOTHER NARRATIVE PUMP? 👀
While most altcoins are still struggling for attention, Celestia is suddenly back in the spotlight.
$TIA exploded toward $0.4782, massively outperforming the broader market as traders rotated aggressively into modular infrastructure plays.
But beneath the hype, the market is split into two camps:
⚡ Bulls see the beginning of an “Infra Supercycle”
⚠️ Bears see another speculation-driven rally without enough real adoption
Here’s what’s REALLY happening👇
🔹 Institutional capital is rotating into blockchain infrastructure narratives — especially projects tied to scalability, rollups, AI infrastructure, and data availability.
Celestia keeps appearing alongside names like:
• Chainlink
• Sui
• Modular rollup ecosystems
That’s important because TIA is no longer being treated like a random altcoin… it’s increasingly viewed as foundational infrastructure.
📈 Technically, the move was explosive.
• Trading volume surged over 130%
• Buyers smashed through major resistance zones
• Momentum traders piled in after weeks of consolidation
• The modular blockchain narrative returned aggressively
The market basically said:
“Infrastructure is back.”
But here’s the uncomfortable question nobody wants to answer:
Does Celestia actually have enough REAL demand yet?
Because long term, hype alone won’t sustain valuation.
The critical metric isn’t social engagement…
It’s whether rollups and developers are truly paying for Celestia’s data availability layer consistently.
That’s where competition becomes serious:
⚔️ Ethereum EIP-4844
⚔️ EigenDA
⚔️ Other modular DA solutions
The modular thesis is strong…
…but the space is becoming crowded fast.
Some analysts are now warning that recurring fee generation and blob usage matter far more than speculative trading volume.
And honestly?
That’s probably the correct long-term lens.
Still, price action cannot be ignored.
Right now:
✅ Momentum is bullish
✅ Volume confirms interest
✅ Altcoin rotation favors infrastructure
✅ Market sentiment toward modular ecosystems is improving
Key levels traders are watching now:
🟢 Support: $0.45–$0.47
🟢 Breakout continuation: Above $0.49
🔴 Weakness trigger: Below $0.44
If TIA successfully holds this breakout zone, traders will likely start targeting psychological levels above $0.50 next.
But if volume fades and real ecosystem growth fails to appear…
this could become another classic narrative-driven spike.
The next phase depends on one thing:
Can Celestia convert speculation into sustainable on-chain demand?
That’s the battle now.
#Celestia #TIA #Crypto #Bitcoin #Altcoins
⚠️ Not financial advice.
repost-content-media
  • Reward
  • Comment
  • Repost
  • Share
$DOGE Still Meme or Momentum?
Dogecoin is sitting at the $0.10 support level, absorbing selling pressure while quietly loading up on a new kind of fuel. The price action looks sleepy on the chart, but beneath the surface, serious structural shifts are unfolding that could reshape the original meme coin into something far more substantial.
🔹 Whales are accumulating with methodical discipline rarely seen in meme assets. Large holders snapped up over 525 million DOGE in just four days, pushing total whale holdings to record levels above 108.5 billion coins. Derivatives data reveals 70.2% long po
DOGE-2.2%
User_any
$DOGE Still Meme or Momentum?
Dogecoin is sitting at the $0.10 support level, absorbing selling pressure while quietly loading up on a new kind of fuel. The price action looks sleepy on the chart, but beneath the surface, serious structural shifts are unfolding that could reshape the original meme coin into something far more substantial.
🔹 Whales are accumulating with methodical discipline rarely seen in meme assets. Large holders snapped up over 525 million DOGE in just four days, pushing total whale holdings to record levels above 108.5 billion coins. Derivatives data reveals 70.2% long positioning among top traders on major platforms, and open interest continues climbing — fresh capital entering, not just existing positions reshuffling. When smart money buys into weakness while retail sentiment remains cautious, the divergence tends to resolve upward.
🔹 The ETF door is swinging open. The SEC approved 91 crypto ETFs on March 27, 2026, including Dogecoin spot products. The 21Shares Dogecoin ETF (TDOG) launched on Nasdaq in January, and the SEC-CFTC joint framework officially classified DOGE as a digital commodity in March. The CLARITY Act locked in that status, giving pension funds and institutional desks the regulatory green light they need to allocate. Bitwise and Grayscale filings remain under review, with final deadlines extending into late 2026.
🔹 A protocol upgrade proposal on GitHub aims to slash the block reward from 10,000 to 1,000 DOGE, cutting annual issuance from roughly 5 billion to 500 million. That would reduce inflation from 3.3% to 0.33%, transforming Dogecoin from a steadily dilutive asset into one approaching hard-money territory. The proposal requires community consensus and a hard fork — no timeline is set — but the direction signals a maturing network willing to evolve.
🔹 Adoption is breaking out of screens and into wallets. Revolut launched a physical Dogecoin-branded debit card across the UK and EU, accepted wherever major payment networks operate. Crypto converts at the point of sale based on exchange rates, putting DOGE directly into everyday spending. Payment integration at this scale pushes the token beyond speculation and into genuine utility.
The charts are compressed, the whales are loading, the regulators are nodding, and the network is debating its own supply transformation. Dogecoin is no longer just the people's joke — it is becoming the people's infrastructure. How do you see it: a range-bound meme waiting for the next viral spark, or an undervalued commodity ETF play building quietly at support?
⚠️ Not financial advice.
repost-content-media
  • Reward
  • Comment
  • Repost
  • Share
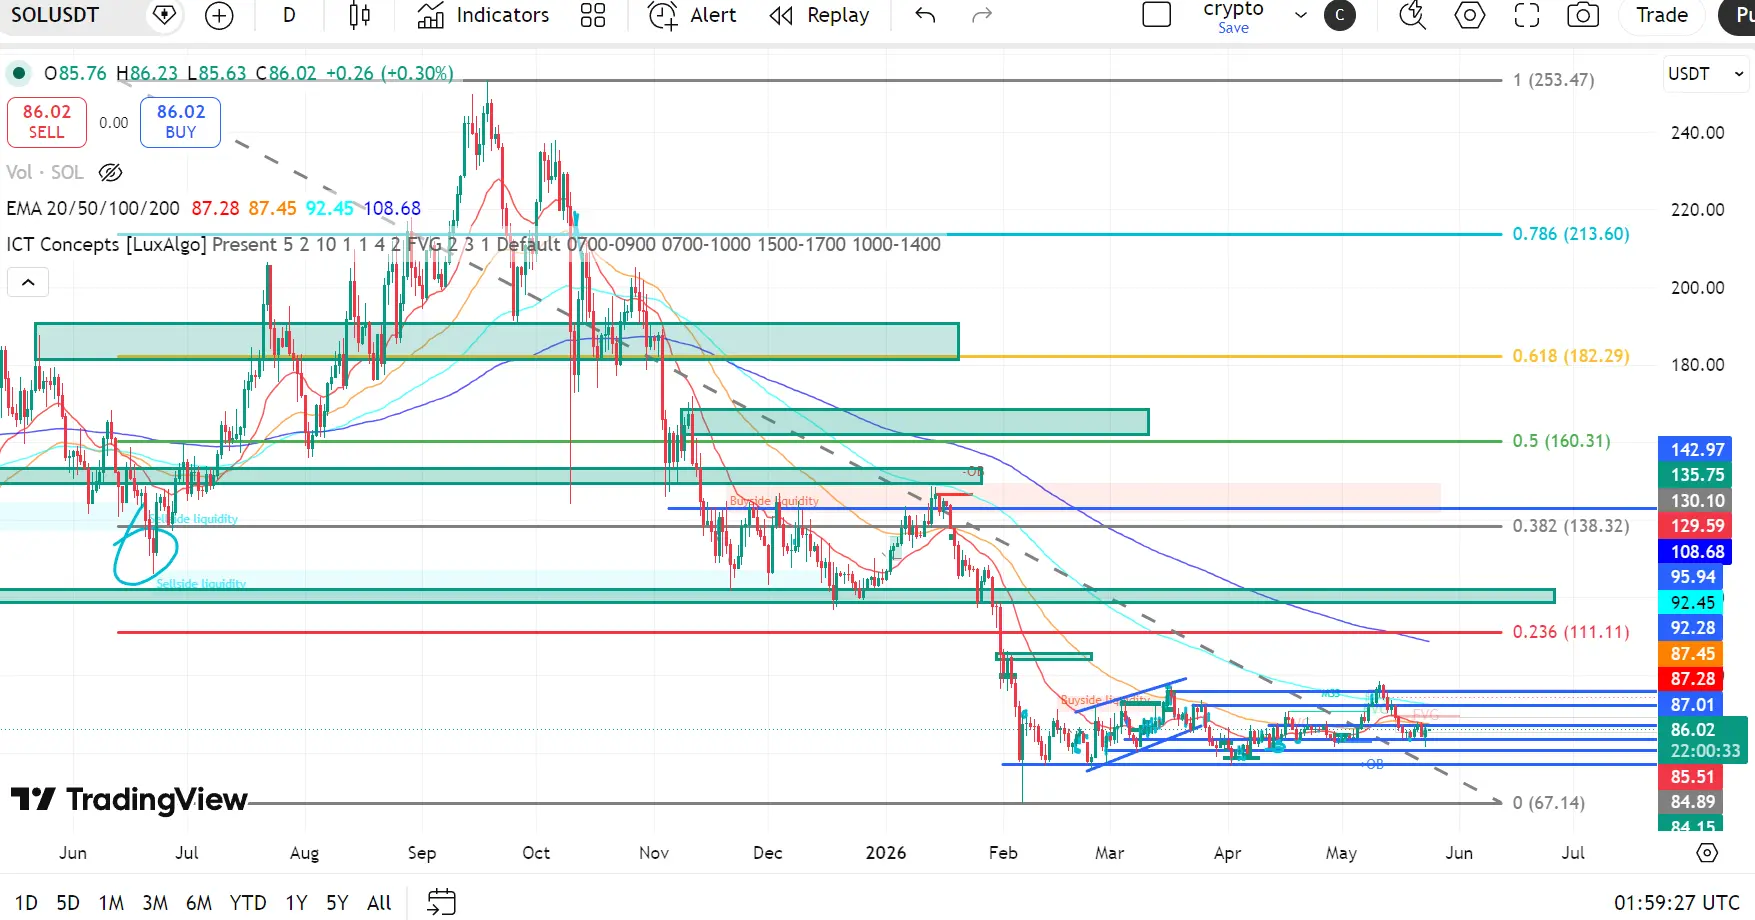
Technical Outlook: Solana — Range Compression, Breakdown Risk Building
Solana is currently trading in a tight consolidation range after a strong downtrend, showing signs of weak bullish continuation and potential breakdown pressure. Structure remains fragile unless key resistance levels are reclaimed.
EMA Structure (Bearish Bias)
20 EMA: $87.29
50 EMA: $87.45
100 EMA: $92.45
200 EMA: $108.68
Price is hovering around / below short-term EMAs
Higher EMAs still acting as dynamic resistance
EMAs are mostly bearishly aligned (20 ≈ 50 < 100 < 200)
No confirmed bullish crossover
👉 Trend remains weak
SOL-2.72%
asiftahsin
Technical Outlook: Solana — Range Compression, Breakdown Risk Building
Solana is currently trading in a tight consolidation range after a strong downtrend, showing signs of weak bullish continuation and potential breakdown pressure. Structure remains fragile unless key resistance levels are reclaimed.
EMA Structure (Bearish Bias)
20 EMA: $87.29
50 EMA: $87.45
100 EMA: $92.45
200 EMA: $108.68
Price is hovering around / below short-term EMAs
Higher EMAs still acting as dynamic resistance
EMAs are mostly bearishly aligned (20 ≈ 50 < 100 < 200)
No confirmed bullish crossover
👉 Trend remains weak bearish with consolidation
Fibonacci Levels
0.786: $213.60
0.618: $182.29
0.5: $160.31
0.382: $138.32
0.236: $111.11
0 (Low): $67.14
Price trading well below 0.236 level ($111)
Holding in lower accumulation zone ($85–$90)
No strong retracement structure formed
👉 Market still in discount zone with weak recovery
Market Structure (ICT Concepts)
Clear macro downtrend (lower highs + lower lows)
Current price forming range / accumulation after sell-off
Multiple liquidity sweeps inside range (fake breakouts both sides)
Weak bullish structure → no strong BOS yet
Potential distribution before continuation down
👉 Setup suggests range → liquidity grab → possible breakdown
RSI Momentum
RSI (14): 46–50
Moving sideways → no strong momentum
Neither overbought nor oversold
👉 Indicates indecision / consolidation phase
📊 Key Levels
Resistance
$87 – $90 (range high / short-term resistance)
$92 – $100 (EMA cluster + supply zone)
$108+ (major resistance / trend shift level)
Support
$85 – $84 (range low)
$80 (psychological level)
$67 (major macro support)
📌 Summary
Solana is consolidating after a strong downtrend, but structure remains weak with no clear bullish confirmation.
Break below $84 → continuation toward $80 / $67
Reclaim $90 → short-term push toward $95–$100
👉 Current condition: Range compression
👉 Bias: Short-term neutral → bearish, mid-term bearish
⚠️ Watch $84 support closely
Lose it → breakdown continuation
Hold it → range bounce possible
$SOL
repost-content-media
  • Reward
  • Comment
  • 2
  • Share
  • Pinned