**Date: **Wed, Jan 07, 2026 | 05:26 AM GMT
The broader cryptocurrency market continues to show strong New Year momentum, with Bitcoin (BTC) up around 5% and Ethereum (ETH) posting gains of more than 9% on a weekly basis. While several altcoins have already accelerated higher, the privacy-focused cryptocurrency** Monero (XMR)** has moved at a more measured pace.
That said, XMR’s recent price behavior on the daily chart tells a more constructive story. Despite relatively modest weekly gains, the structure suggests that Monero is undergoing a healthy bullish retest — often a critical phase before the next leg higher.
Source: Coinmarketcap
Retested Cup and Handle Breakout
On the daily timeframe, XMR had been consolidating within a well-defined Cup and Handle formation, a classic bullish continuation pattern that typically forms after an extended accumulation phase.
The pattern resolved to the upside when buyers decisively pushed price above the $412–$420 neckline resistance. This breakout sparked a sharp rally of nearly 20%, sending XMR to a local high around $498.30 and confirming a clear shift in market structure toward bullish control

Monero (XMR) Daily Chart/Coinsprobe (Source: Tradingview)
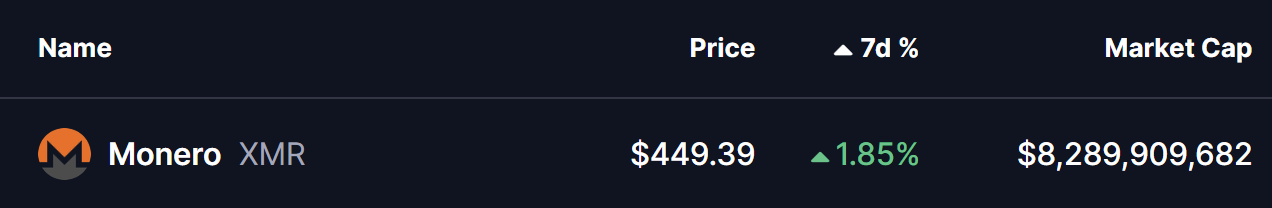
As expected after such a strong breakout, price then pulled back to retest the former resistance zone. XMR dipped back into the $412–$420 area, allowing the market to validate this region as new support. This retest has so far been successful, with price rebounding and currently trading near the $449 level. The ability to hold above the breakout zone reinforces the strength of the underlying trend and suggests growing acceptance at higher prices.
What’s Next for XMR?
As long as buyers continue to defend the $412–$420 support area, the broader bullish structure remains firmly intact. A sustained move back above the recent swing high near $498 would likely signal renewed upside momentum and open the door for continuation of the breakout trend.
Based on the depth of the cup formation, the technical upside projection points toward the $608 region. Reaching this level would imply a potential upside of roughly 35% from current prices, consistent with the measured-move expectations of this pattern.
On the downside, a failure to hold the $412–$420 zone could temporarily slow bullish momentum and lead to additional consolidation. However, unless price slips back toward the lower portion of the cup, the broader structure would still remain constructive.
From a technical perspective, XMR’s current behavior reflects a textbook breakout-and-retest scenario. If market conditions remain supportive, this structure suggests Monero could be positioning itself for another meaningful move higher in the weeks ahead.
Disclaimer: The views and analysis presented in this article are for informational purposes only and reflect the author’s perspective, not financial advice. Technical patterns and indicators discussed are subject to market volatility and may or may not yield the anticipated results. Investors are advised to exercise caution, conduct independent research, and make decisions aligned with their individual risk tolerance.
About Author: Nilesh Hembade is the Founder and Lead Author of Coinsprobe, with over 5 years of experience in the cryptocurrency and blockchain industry. Since launching Coinsprobe in 2023, he has been providing daily, research-driven insights through in-depth market analysis, on-chain data, and technical research.
Disclaimer: The information on this page may come from third parties and does not represent the views or opinions of Gate. The content displayed on this page is for reference only and does not constitute any financial, investment, or legal advice. Gate does not guarantee the accuracy or completeness of the information and shall not be liable for any losses arising from the use of this information. Virtual asset investments carry high risks and are subject to significant price volatility. You may lose all of your invested principal. Please fully understand the relevant risks and make prudent decisions based on your own financial situation and risk tolerance. For details, please refer to
Disclaimer.
Related Articles
Solana Approaches Key Sell Wall at $84.78 — Will Momentum Hold for a Move Toward $89?
Solana is trading at an approximate price of $83.18, although a solid sell wall is at an approximate price of $84.78, which prevents upward movement.
The price is trapped between the support at $81.99 and the resistance at $84.78 which is short term consolidation.
Once buyers hit the
CryptoNewsLand27m ago
SOL Consolidates Near $84 While Chart Highlights Possible $45 Demand Zone
Solana (SOL) trades at $83.87 within a range defined by $81.03 support and $84.43 resistance, showing consolidation below a $90 supply zone. There is a broader demand area near $45, indicating potential downward movement before recovery.
CryptoNewsLand31m ago
Santiment: The surge in active USDT addresses on a certain public blockchain is correlated with the rebound of BTC
Research firm Santiment found that over the past year, when USDT active addresses on a certain public blockchain surged three times, BTC price rebounded each time, indicating that USDT liquidity has a significant impact on BTC price.
GateNews1h ago
PEPE Consolidates Above $0.05324 Support as Momentum Strengthens and Resistance Near $0.05336 Holds
PEPE has a tight intraday price compression with a support level of $0.053243 and resistance level of $0.053363.
A RSI of 64.13 represents the moderate bullish momentum whereas MACD history is slightly positive, which indicates the gradual buying momentum.
The price is at $0.053364
CryptoNewsLand1h ago
Michael Saylor: Strategy - There is a time lag between buying Bitcoin and price appreciation
Gate News reports that on March 12, Strategy founder Michael Saylor posted: "There is a time lag between when we purchase Bitcoin and when the Bitcoin price skyrockets."
GateNews2h ago
Why OXT Just Skyrocketed 21.97% in 30 Minutes
OXT price surged 21.97%, now at $0.0211, driven by macroeconomic trends and increased trading activity. Analysts suggest the bullish sentiment in major cryptocurrencies boosts altcoin interest, while traders watch key resistance and support levels.
Coinfomania2h ago