
**Date: **Tue, Jan 06, 2026 | 05:28 AM GMT
As 2026 begins, the broader cryptocurrency market continues to show notable strength. Both Bitcoin (BTC) and Ethereum (ETH) are up over 7% on the week, and bullish momentum is gradually spilling over into major altcoins — including Worldcoin (WLD).
WLD has already surged more than 29% over the past week, but the more important development lies beneath the surface. Recent price action is beginning to reflect a meaningful structural shift, one that could signal the early stages of a sustained bullish continuation if key resistance is cleared.
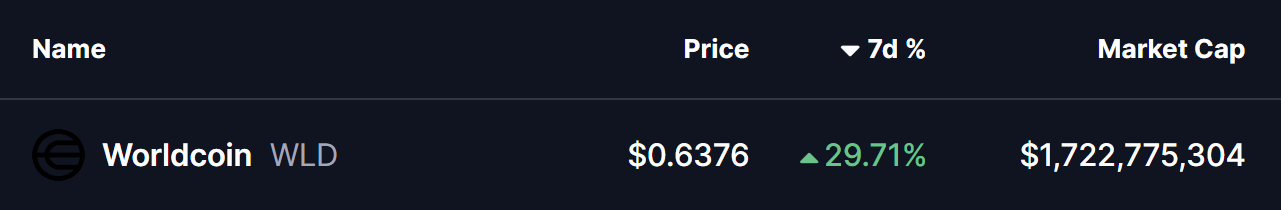
Source: Coinmarketcap
Rounding Bottom in Play
On the daily timeframe, Worldcoin appears to be forming a rounding bottom pattern — a classic bullish reversal structure that typically emerges after a prolonged corrective phase. This pattern reflects a gradual transition from strong selling pressure to steady accumulation, as buyers slowly regain control.
The setup began after WLD faced firm rejection near the $0.6388–$0.6644 zone late last month. That rejection triggered a sharp decline, dragging price down toward the $0.47 area. Notably, sellers failed to push price significantly lower, and strong demand repeatedly emerged at that level. Over time, volatility compressed, downside momentum faded, and price began to curve higher — completing the rounded base structure.
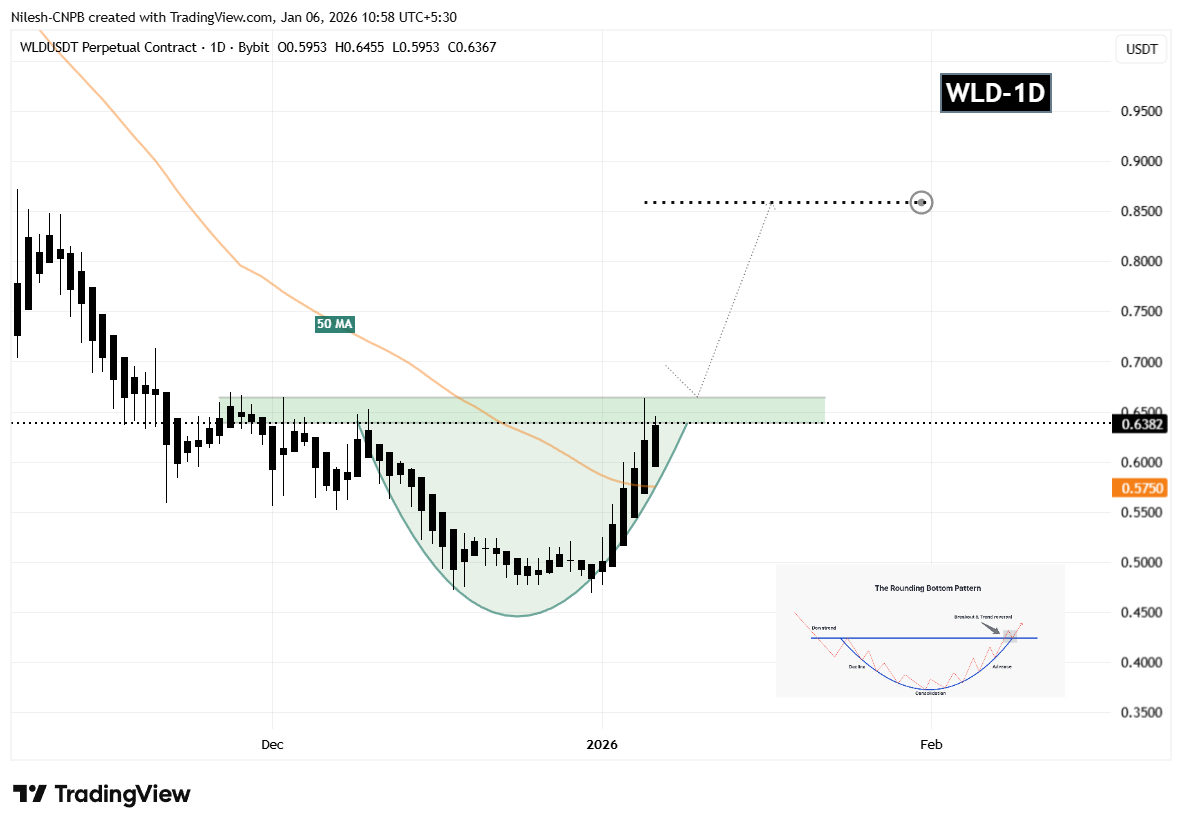
Worldcoin (WLD) Daily Chart/Coinsprobe (Source: Tradingview)
Since then, WLD has rebounded sharply and reclaimed the 50-day moving average near $0.5750, an important technical development that suggests improving short-term momentum. Price is now pressing back into the same resistance zone that previously capped upside attempts, marking a critical inflection point for the trend.
What’s Next for WLD?
If WLD continues to hold above the 50-day moving average, that level could act as short-term support and provide a foundation for further upside attempts. A clean daily close above the $0.6388–$0.6644 resistance zone would confirm the rounding bottom breakout and validate the broader reversal structure.
A successful breakout followed by acceptance above this zone would likely attract momentum traders back into the market and open the door for a stronger expansion phase. Based on the depth of the rounding formation, the projected upside target points toward the $0.8588 region — implying a potential upside of roughly 34% from current levels, in line with the measured move typically associated with this pattern.
That said, patience remains important. Before any confirmed breakout, WLD could still see short-term pullbacks, including a dip toward the rising base of the rounding structure, which has been acting as dynamic support during the recovery. Such pullbacks would not invalidate the bullish setup as long as price continues to maintain higher lows.
Until a decisive breakout and follow-through occur, traders may want to remain cautious and avoid chasing price. The $0.6388–$0.6644 zone remains the key decision area that will determine whether Worldcoin transitions into a sustained bullish phase or continues consolidating into the new year.
Disclaimer: The views and analysis presented in this article are for informational purposes only and reflect the author’s perspective, not financial advice. Technical patterns and indicators discussed are subject to market volatility and may or may not yield the anticipated results. Investors are advised to exercise caution, conduct independent research, and make decisions aligned with their individual risk tolerance.
About Author: Nilesh Hembade is the Founder and Lead Author of Coinsprobe, with over 5 years of experience in the cryptocurrency and blockchain industry. Since launching Coinsprobe in 2023, he has been providing daily, research-driven insights through in-depth market analysis, on-chain data, and technical research.
Disclaimer: The information on this page may come from third parties and does not represent the views or opinions of Gate. The content displayed on this page is for reference only and does not constitute any financial, investment, or legal advice. Gate does not guarantee the accuracy or completeness of the information and shall not be liable for any losses arising from the use of this information. Virtual asset investments carry high risks and are subject to significant price volatility. You may lose all of your invested principal. Please fully understand the relevant risks and make prudent decisions based on your own financial situation and risk tolerance. For details, please refer to
Disclaimer.
Related Articles
APEPE Reclaims $0.051207 As Whale Buying Activity Sets a 500% Major Market Rally: Analyst
The Ape and Pepe (APEPE) coin shows signs that its market is approaching a potential big bounce. By reclaiming the $0.009000 level for the first time in almost a month and pushing past a multi-week consolidation range, the digital asset is displaying indicators of renewed bullish momentum,
BlockChainReporter55m ago
Bitcoin Veteran Buys $49 Million Worth of ETH as Experts Believe ETH Nears Breakout Price Levels
Bitcoin veteran buys $49 million worth of ETH.
Experts believe ETH is nearing major breakout prices.
ETH price could surge to $2,800 if it can hit $2,400.
The crypto community basks in high spirits as the price of Bitcoin (BTC) recovers targets over the $73,000 price range. At the
CryptoNewsLand1h ago
Ethereum Open Interest Jumps 18%, Bull Trap Signal? - U.Today
Ethereum's futures market saw a significant increase, with open interest rising over 18% to $33.37 billion, indicating heightened risk-taking. Despite bullish trends, traders appear cautious, hedging against potential downturns.
UToday1h ago
"Seeking a Sword by Marking a Boat" - Style Coin Price Predictions Go Viral: The Practical Logic and Flaws of Mystical Prophecies
Author: Frank, PANews
Whenever the market enters a confusing phase of going nowhere, people try to use a "cutting the boat to seek the sword" method of historical retrospection to predict the next market movement. In such cases, people often see from these theories and charts that history always repeats itself, and seem to automatically overlay and verify future price movements with a certain period in the past.
This coincidence seems to have a magical effect and is often verified. Some bloggers claim this prediction method has an accuracy rate of 75%~80%.
Does this "cutting the boat to seek the sword" style price prediction that repeatedly goes viral on social media help the market identify stages, or is it just packaging noise as prophecy?
From "Tick Fractals" to "History Rhyming"
The peak operation regarding predictions of October 2025 market tops is an analyst named CryptoBullet, who created a method called "ti
区块客1h ago
DeFi enters a "winter of yields": liquidity stagnation, leverage contraction, and the disappearance of arbitrage opportunities
The DeFi market entered an "interest rate winter" since September 2025, with deposit rates for major stablecoins declining sharply and supply-demand imbalances causing liquidity congestion. The rate decline reflects reduced capital demand and a lack of high-return opportunities. Stablecoin lending demand has dropped significantly, with market risk appetite shifting toward more stable investment channels. In response to this situation, the Sky protocol demonstrates competitiveness and adaptability by introducing real-world assets to enhance yields. The low interest rates during this phase can be viewed as an opportunity for DeFi market transformation.
区块客2h ago
