


Comprehensive Dow Theory, Wave Theory, Volume-Price Behavior, Order Flow, and Price Action Analysis for BTC Short-term Trend:
$BTC
1. Dow Theory Analysis
Current Signal: The main upward trend is under test, a break below Higher Low on April 13th, warning of structural damage!
Technical Features:
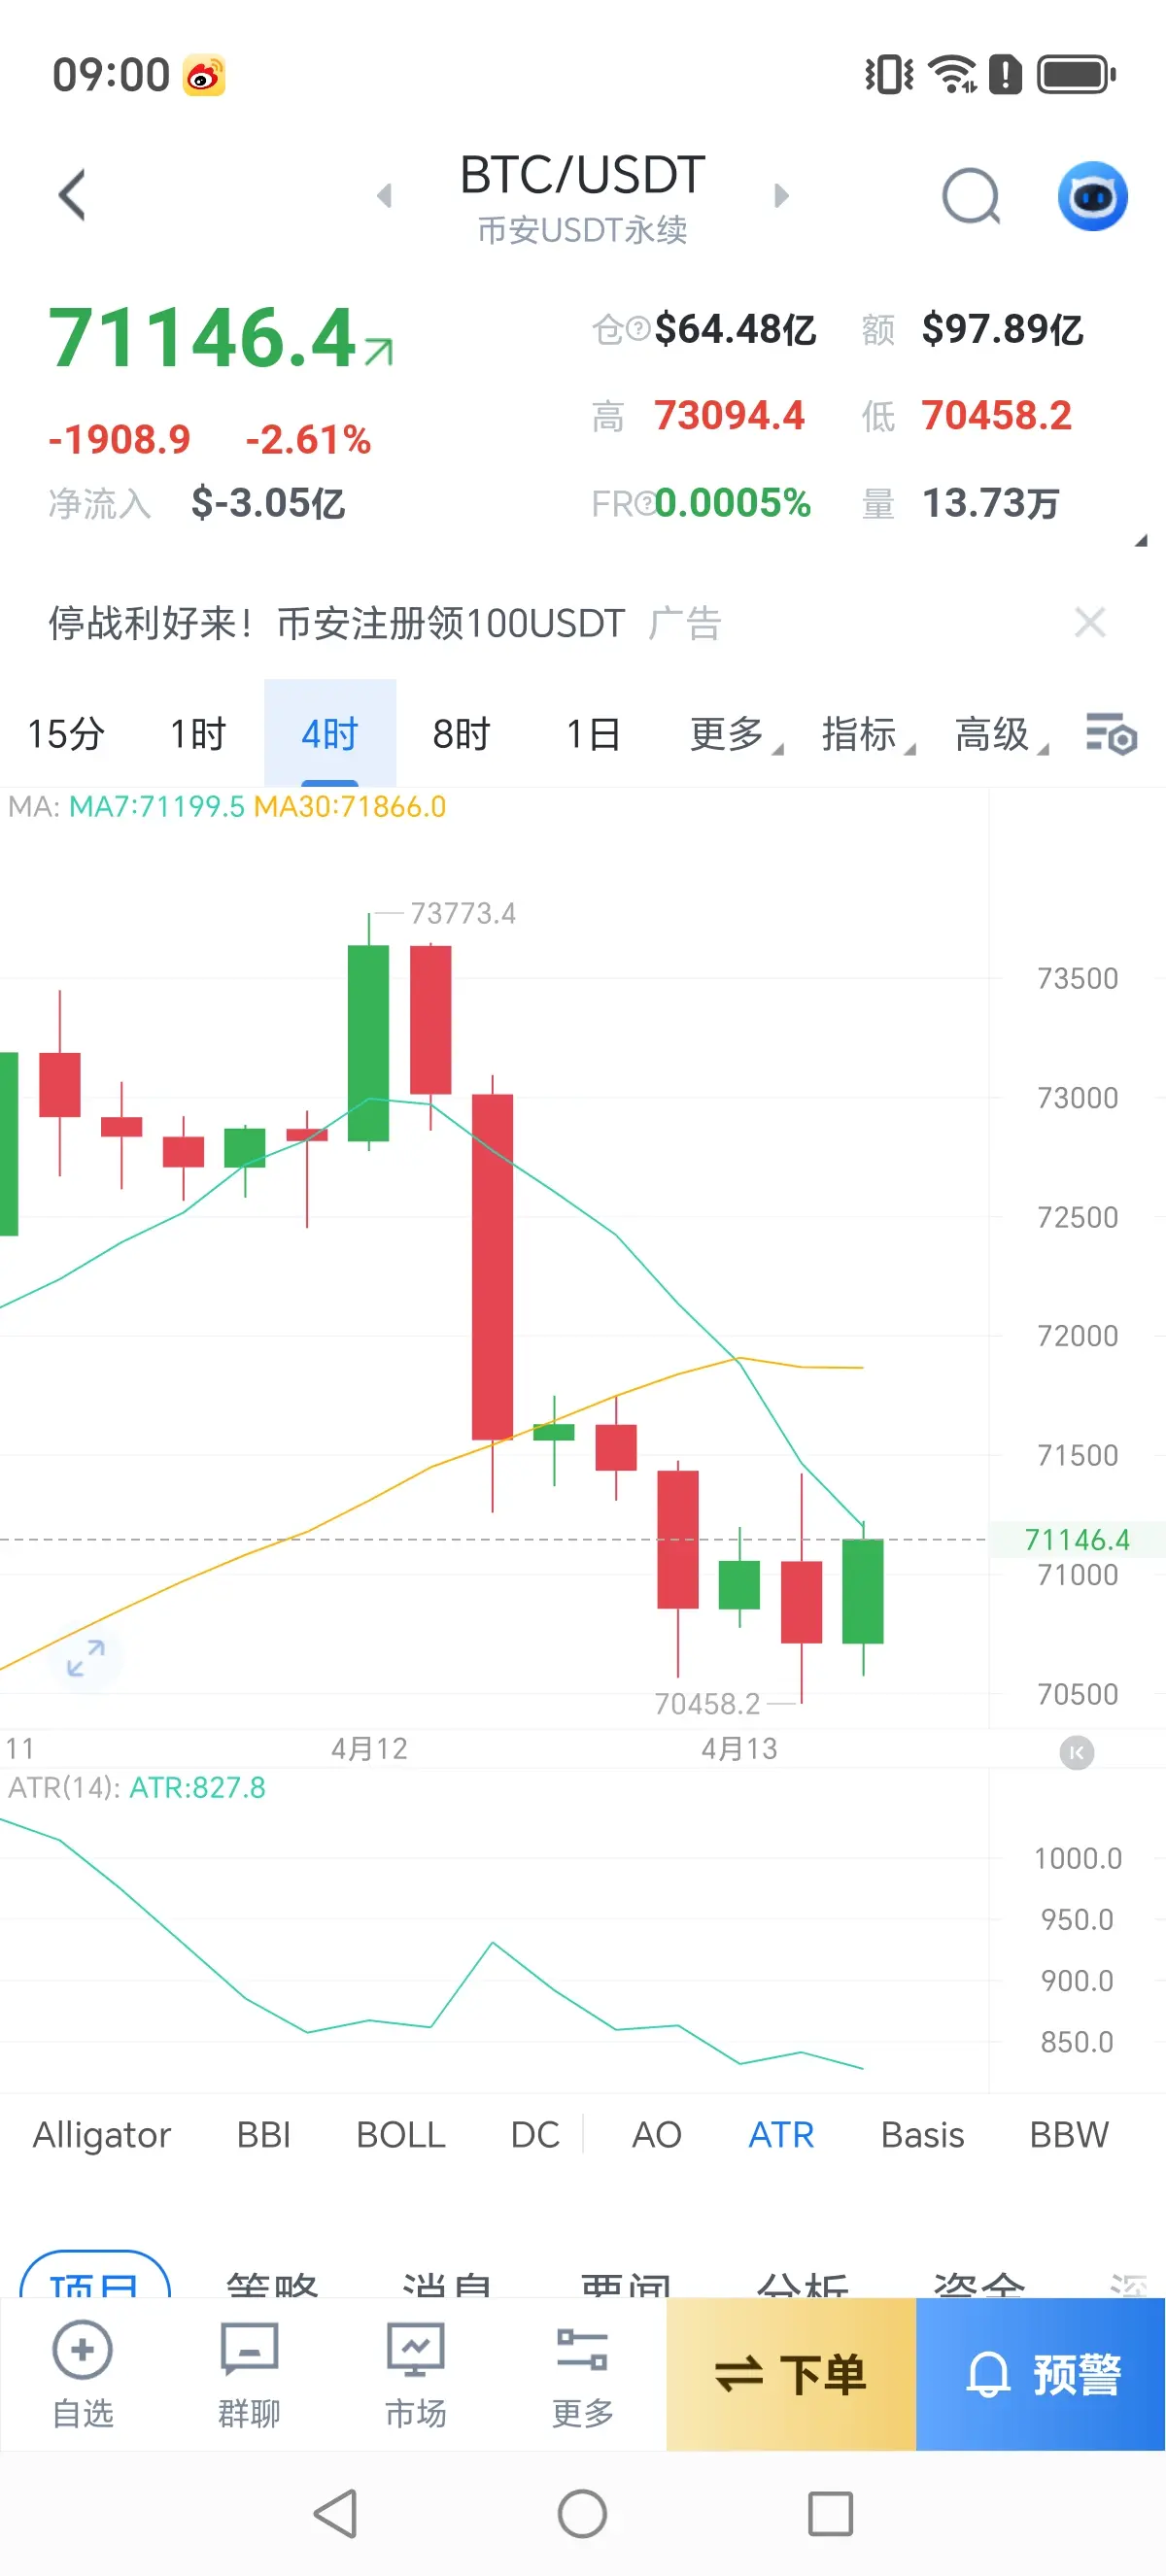
• Primary Trend: Upward — rebound from $68,860 low on April 7 to $73,370 high on April 11
• Secondary Correction: Continuous pullback on April 12-13, breaking below previous low of $71,580 on April 13
• Key Structural Damage: Higher Low structure broken, support at $71,580 lost
Key Observations:
• Higher High: $73,370 (April 11)
• Higher Low: $71,580 (April 12, already broken)
• Current Price: $70,652 below previous low, trend structure broken
Short-term Judgment: The main upward trend is severely threatened; if it cannot quickly recover $71,500, a trend reversal to bearish may occur
2. Elliott Wave Theory
Current Signal: Wave C extension breaks key support, beware of trend reversal
Wave Structure:
• Wave 1: $68,860 → $72,000 (impulse wave)
• Wave 2: retracement to $69,500 (0.618 retracement)
• Wave 3: main rally to $75,000 (1.618 extension)
• Wave 4: retracement to $74,000 (0.382 retracement)
• Wave 5: extension to $73,370 (failed Wave 5)
ABC Correction (Wave C extension):
• Wave A: $73,370 → $72,626
• Wave B: rebound to $73,000
• Wave C: extended downward to $70,652 (beyond expectations, breaking key support)
Key Signal: Wave C exceeds 1.618 times Wave A, indicating strong bearish force, possibly not just a correction but a trend reversal
Short-term Judgment: Wave C extension breaks key support, beware of evolving from correction to downtrend, with support at $70,000-$69,000
3. Volume-Price Behavior Analysis
Current Signal: Volume spike on April 13th breaking key support, bears dominate
Volume-Price Relationship:
• Rising volume: rebound to $73,370 accompanied by increased trading volume
• Initial retracement with decreasing volume: April 12th retracement to $71,580 with shrinking volume, appearing as healthy consolidation
• Volume spike on April 13th break: volume significantly increased when breaking below $71,500, heavy selling pressure
Key Observations:
• Volume spike confirms bears’ dominance after breaking key support
• Volume and price decline in sync, no signs of stabilization via shrinking volume
• Longs’ stop-loss orders surge, causing a cascade effect
Short-term Judgment: Volume-driven decline confirms short-term bearish dominance; wait for shrinking volume signals to stabilize before considering bottom fishing
4. Order Flow Analysis
Current Signal: Trading below POC, sell-side dominance, support turns into resistance
Key Data:
• POC (Point of Control): $72,500 — area with highest previous volume, now broken and turned into resistance
• Value Area: shifted downward, current price below lower boundary of value area
• Imbalance (Delta): active sell volume > active buy volume at current price, Delta negative
• Liquidity Distribution: below $70,000-$69,000, there are long stop-loss liquidity pools
Order Book Observation:
• Dense sell orders in the $71,500-$72,500 range, forming resistance wall
• Weak buy orders around $70,000, support fragile
Short-term Judgment: After losing POC, trend turns bearish; rebound to $71,500-$72,000 can be shorted, with stop-loss at $72,500; downside targets at $70,000-$69,500
5. Price Action Analysis
Current Signal: Bearish breakdown, Higher Low structure broken, trend turns bearish
Key Patterns:
Bearish Breakdown: April 13th price breaks below $71,500 key support, a strong bearish signal
Higher Low structure broken: $71,580 low breached, upward trend disintegrated
Key Level Transitions:
Original support at $71,500 → new resistance
Support below at $70,000 (psychological level), $69,500 (previous low)
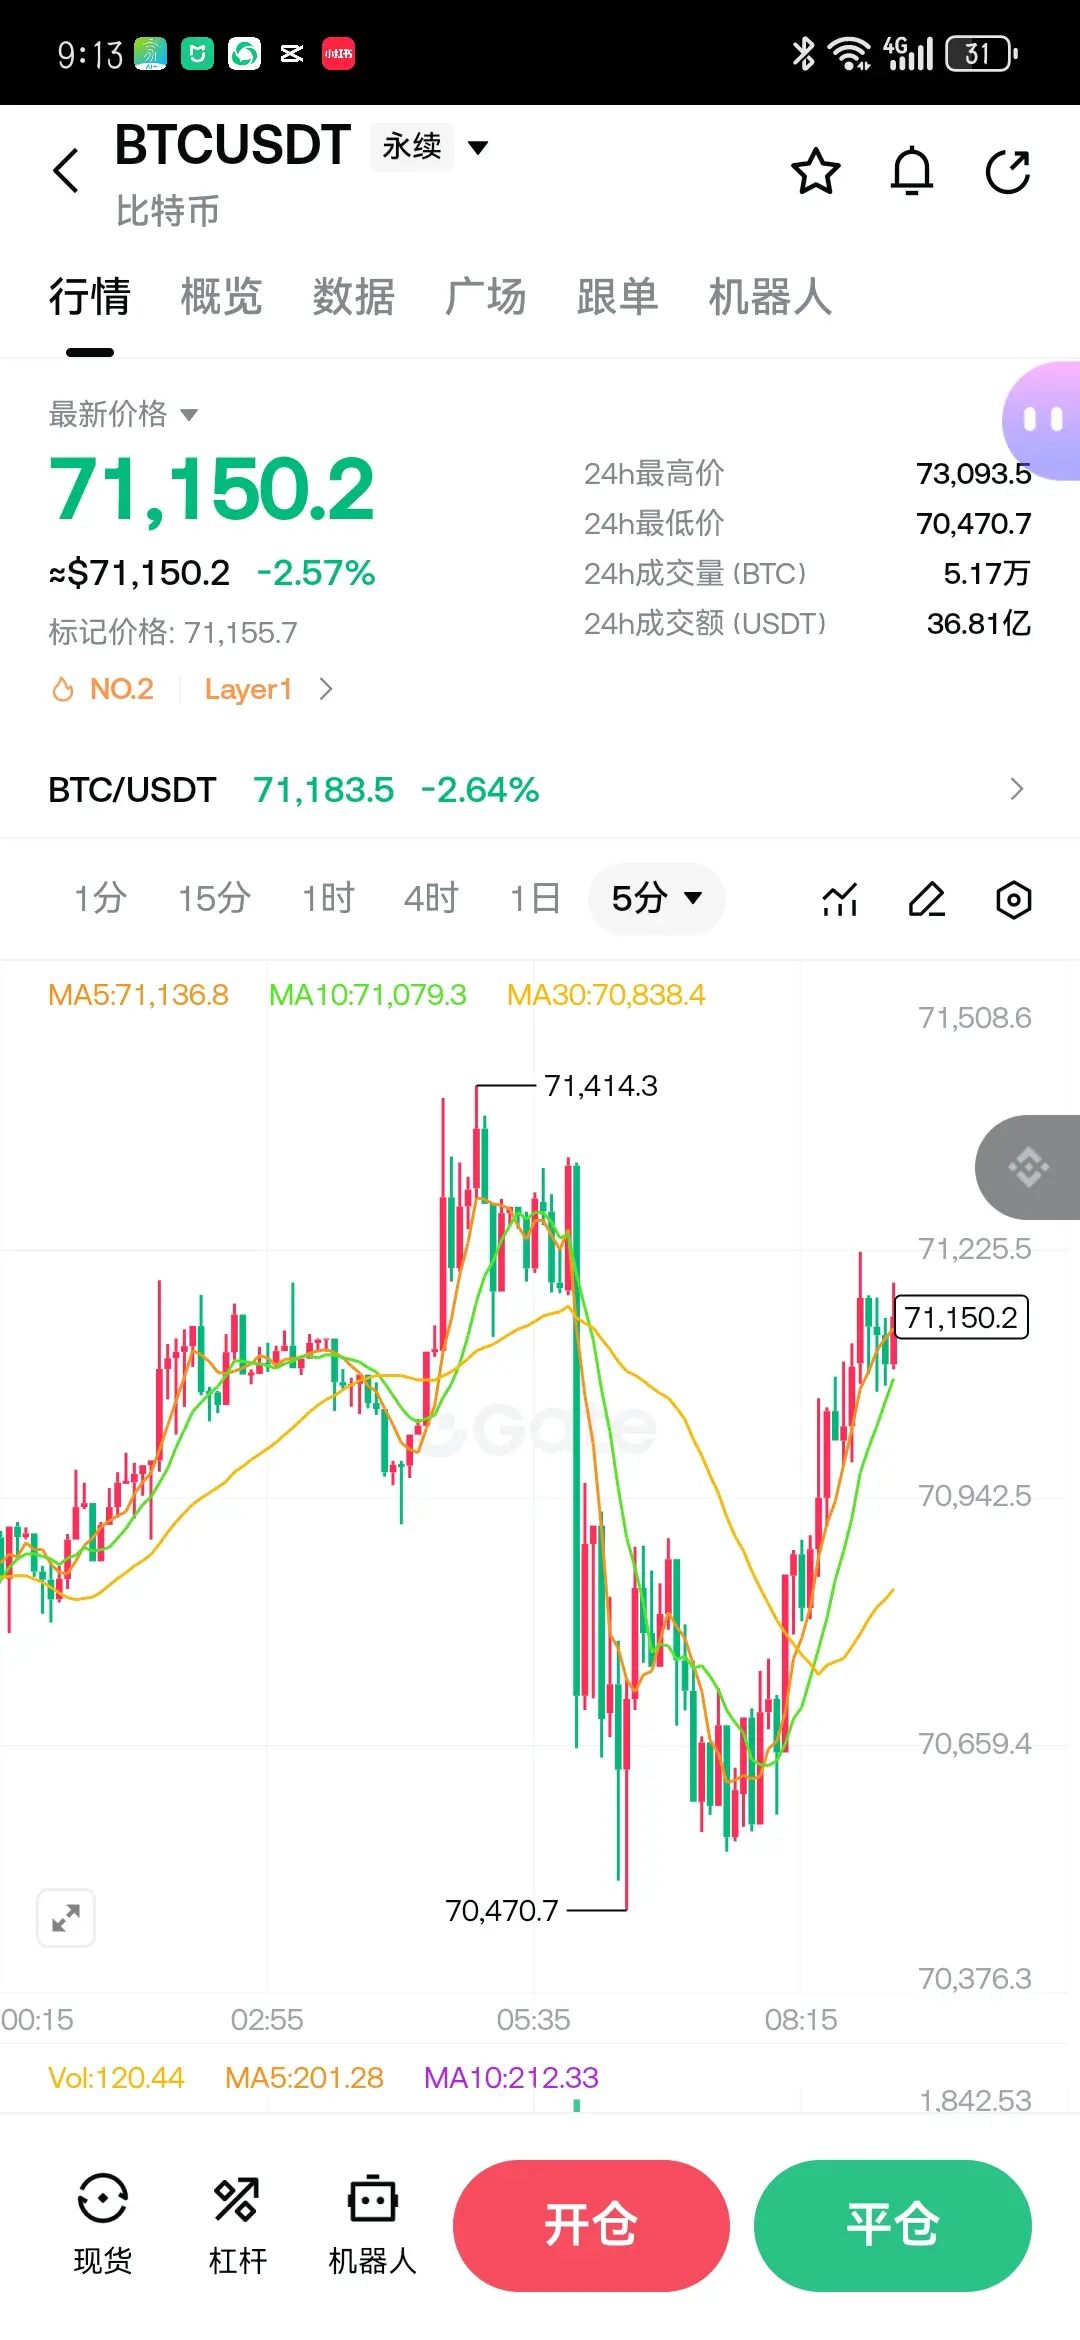
Price Behavior:
Current price $70,652 tests lower support
If it breaks below $70,000, downside opens to $69,000-$68,000
If it holds and rebounds above $71,500, a false breakout is likely, and bullish view can be reconsidered
Short-term Judgment: Bearish breakdown confirmed, trend turns bearish, focus on shorting rebounds, wait for stabilization signals before considering bottom fishing
⚠️ Urgent Risk Reminder:
• Current price $70,652 has broken key support at $71,500, structural damage
• If it cannot quickly recover $71,500, trend reversal to bearish confirmed
• Key supports below: $70,000 (psychological level), $69,500 (previous low)
• Suggest position control at 1-2x leverage, strict stop-loss, currently mainly observing or shorting, avoid rushing to bottom fish
$BTC
1. Dow Theory Analysis
Current Signal: The main upward trend is under test, a break below Higher Low on April 13th, warning of structural damage!
Technical Features:
• Primary Trend: Upward — rebound from $68,860 low on April 7 to $73,370 high on April 11
• Secondary Correction: Continuous pullback on April 12-13, breaking below previous low of $71,580 on April 13
• Key Structural Damage: Higher Low structure broken, support at $71,580 lost
Key Observations:
• Higher High: $73,370 (April 11)
• Higher Low: $71,580 (April 12, already broken)
• Current Price: $70,652 below previous low, trend structure broken
Short-term Judgment: The main upward trend is severely threatened; if it cannot quickly recover $71,500, a trend reversal to bearish may occur
2. Elliott Wave Theory
Current Signal: Wave C extension breaks key support, beware of trend reversal
Wave Structure:
• Wave 1: $68,860 → $72,000 (impulse wave)
• Wave 2: retracement to $69,500 (0.618 retracement)
• Wave 3: main rally to $75,000 (1.618 extension)
• Wave 4: retracement to $74,000 (0.382 retracement)
• Wave 5: extension to $73,370 (failed Wave 5)
ABC Correction (Wave C extension):
• Wave A: $73,370 → $72,626
• Wave B: rebound to $73,000
• Wave C: extended downward to $70,652 (beyond expectations, breaking key support)
Key Signal: Wave C exceeds 1.618 times Wave A, indicating strong bearish force, possibly not just a correction but a trend reversal
Short-term Judgment: Wave C extension breaks key support, beware of evolving from correction to downtrend, with support at $70,000-$69,000
3. Volume-Price Behavior Analysis
Current Signal: Volume spike on April 13th breaking key support, bears dominate
Volume-Price Relationship:
• Rising volume: rebound to $73,370 accompanied by increased trading volume
• Initial retracement with decreasing volume: April 12th retracement to $71,580 with shrinking volume, appearing as healthy consolidation
• Volume spike on April 13th break: volume significantly increased when breaking below $71,500, heavy selling pressure
Key Observations:
• Volume spike confirms bears’ dominance after breaking key support
• Volume and price decline in sync, no signs of stabilization via shrinking volume
• Longs’ stop-loss orders surge, causing a cascade effect
Short-term Judgment: Volume-driven decline confirms short-term bearish dominance; wait for shrinking volume signals to stabilize before considering bottom fishing
4. Order Flow Analysis
Current Signal: Trading below POC, sell-side dominance, support turns into resistance
Key Data:
• POC (Point of Control): $72,500 — area with highest previous volume, now broken and turned into resistance
• Value Area: shifted downward, current price below lower boundary of value area
• Imbalance (Delta): active sell volume > active buy volume at current price, Delta negative
• Liquidity Distribution: below $70,000-$69,000, there are long stop-loss liquidity pools
Order Book Observation:
• Dense sell orders in the $71,500-$72,500 range, forming resistance wall
• Weak buy orders around $70,000, support fragile
Short-term Judgment: After losing POC, trend turns bearish; rebound to $71,500-$72,000 can be shorted, with stop-loss at $72,500; downside targets at $70,000-$69,500
5. Price Action Analysis
Current Signal: Bearish breakdown, Higher Low structure broken, trend turns bearish
Key Patterns:
Bearish Breakdown: April 13th price breaks below $71,500 key support, a strong bearish signal
Higher Low structure broken: $71,580 low breached, upward trend disintegrated
Key Level Transitions:
Original support at $71,500 → new resistance
Support below at $70,000 (psychological level), $69,500 (previous low)
Price Behavior:
Current price $70,652 tests lower support
If it breaks below $70,000, downside opens to $69,000-$68,000
If it holds and rebounds above $71,500, a false breakout is likely, and bullish view can be reconsidered
Short-term Judgment: Bearish breakdown confirmed, trend turns bearish, focus on shorting rebounds, wait for stabilization signals before considering bottom fishing
⚠️ Urgent Risk Reminder:
• Current price $70,652 has broken key support at $71,500, structural damage
• If it cannot quickly recover $71,500, trend reversal to bearish confirmed
• Key supports below: $70,000 (psychological level), $69,500 (previous low)
• Suggest position control at 1-2x leverage, strict stop-loss, currently mainly observing or shorting, avoid rushing to bottom fish