Trade
Basic
Futures
Futures
Hundreds of contracts settled in USDT or BTC
TradFi
Gold
Trade global traditional assets with USDT in one place
Options
Hot
Trade European-style vanilla options
Unified Account
Maximize your capital efficiency
Demo Trading
Futures Kickoff
Get prepared for your futures trading
Futures Events
Participate in events to win generous rewards
Demo Trading
Use virtual funds to experience risk-free trading
Earn
Launch
CandyDrop
Collect candies to earn airdrops
Launchpool
Quick staking, earn potential new tokens
HODLer Airdrop
Hold GT and get massive airdrops for free
Launchpad
Be early to the next big token project
Alpha Points
Trade on-chain assets and enjoy airdrop rewards!
Futures Points
Earn futures points and claim airdrop rewards
Investment
Simple Earn
Earn interests with idle tokens
Auto-Invest
Auto-invest on a regular basis
Dual Investment
Buy low and sell high to take profits from price fluctuations
Soft Staking
Earn rewards with flexible staking
Crypto Loan
0 Fees
Pledge one crypto to borrow another
Lending Center
One-stop lending hub
VIP Wealth Hub
Customized wealth management empowers your assets growth
Private Wealth Management
Customized asset management to grow your digital assets
Quant Fund
Top asset management team helps you profit without hassle
Staking
Stake cryptos to earn in PoS products
Smart Leverage
New
No forced liquidation before maturity, worry-free leveraged gains
GUSD Minting
Use USDT/USDC to mint GUSD for treasury-level yields
More
GennyCruz
No content yet
GennyCruz
Ever wonder why a chart looks perfect right before it does the exact opposite of what you expect?
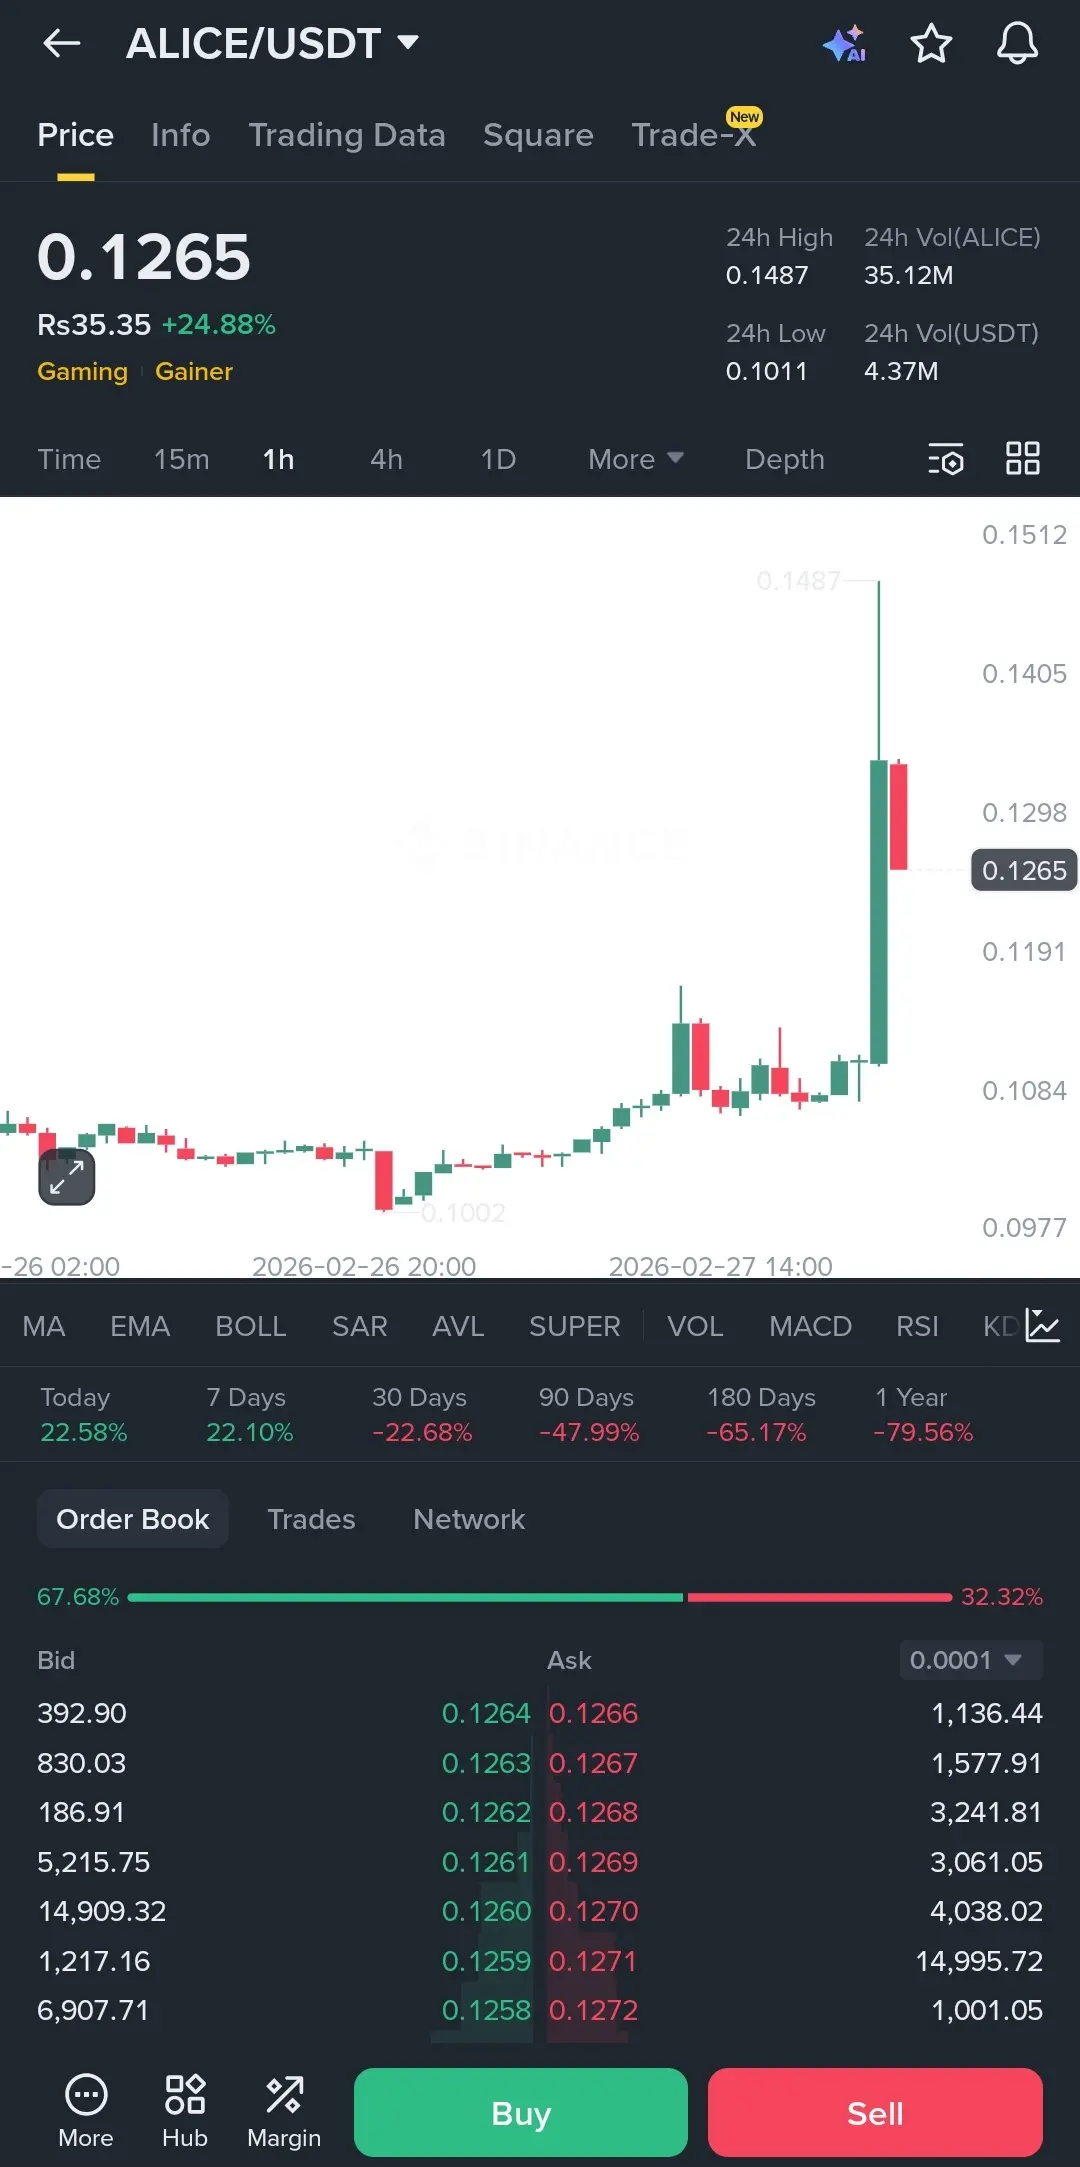
Check out $ALICE on the 1h timeframe. We just had a massive vertical spike up to 0.1487 but the rejection was just as fast. It’s currently sitting at 0.1265 and trying to find its feet.
The volume on that breakout was huge but that long upper wick is a bit concerning. It shows there's a lot of profit taking happening as soon as we hit those local highs. Right now the order book is looking fairly balanced with about 67% buy interest which is keeping it from dumping back to the 0.1100 base.
If w
ALICE26%

- Reward
- like
- Comment
- Repost
- Share
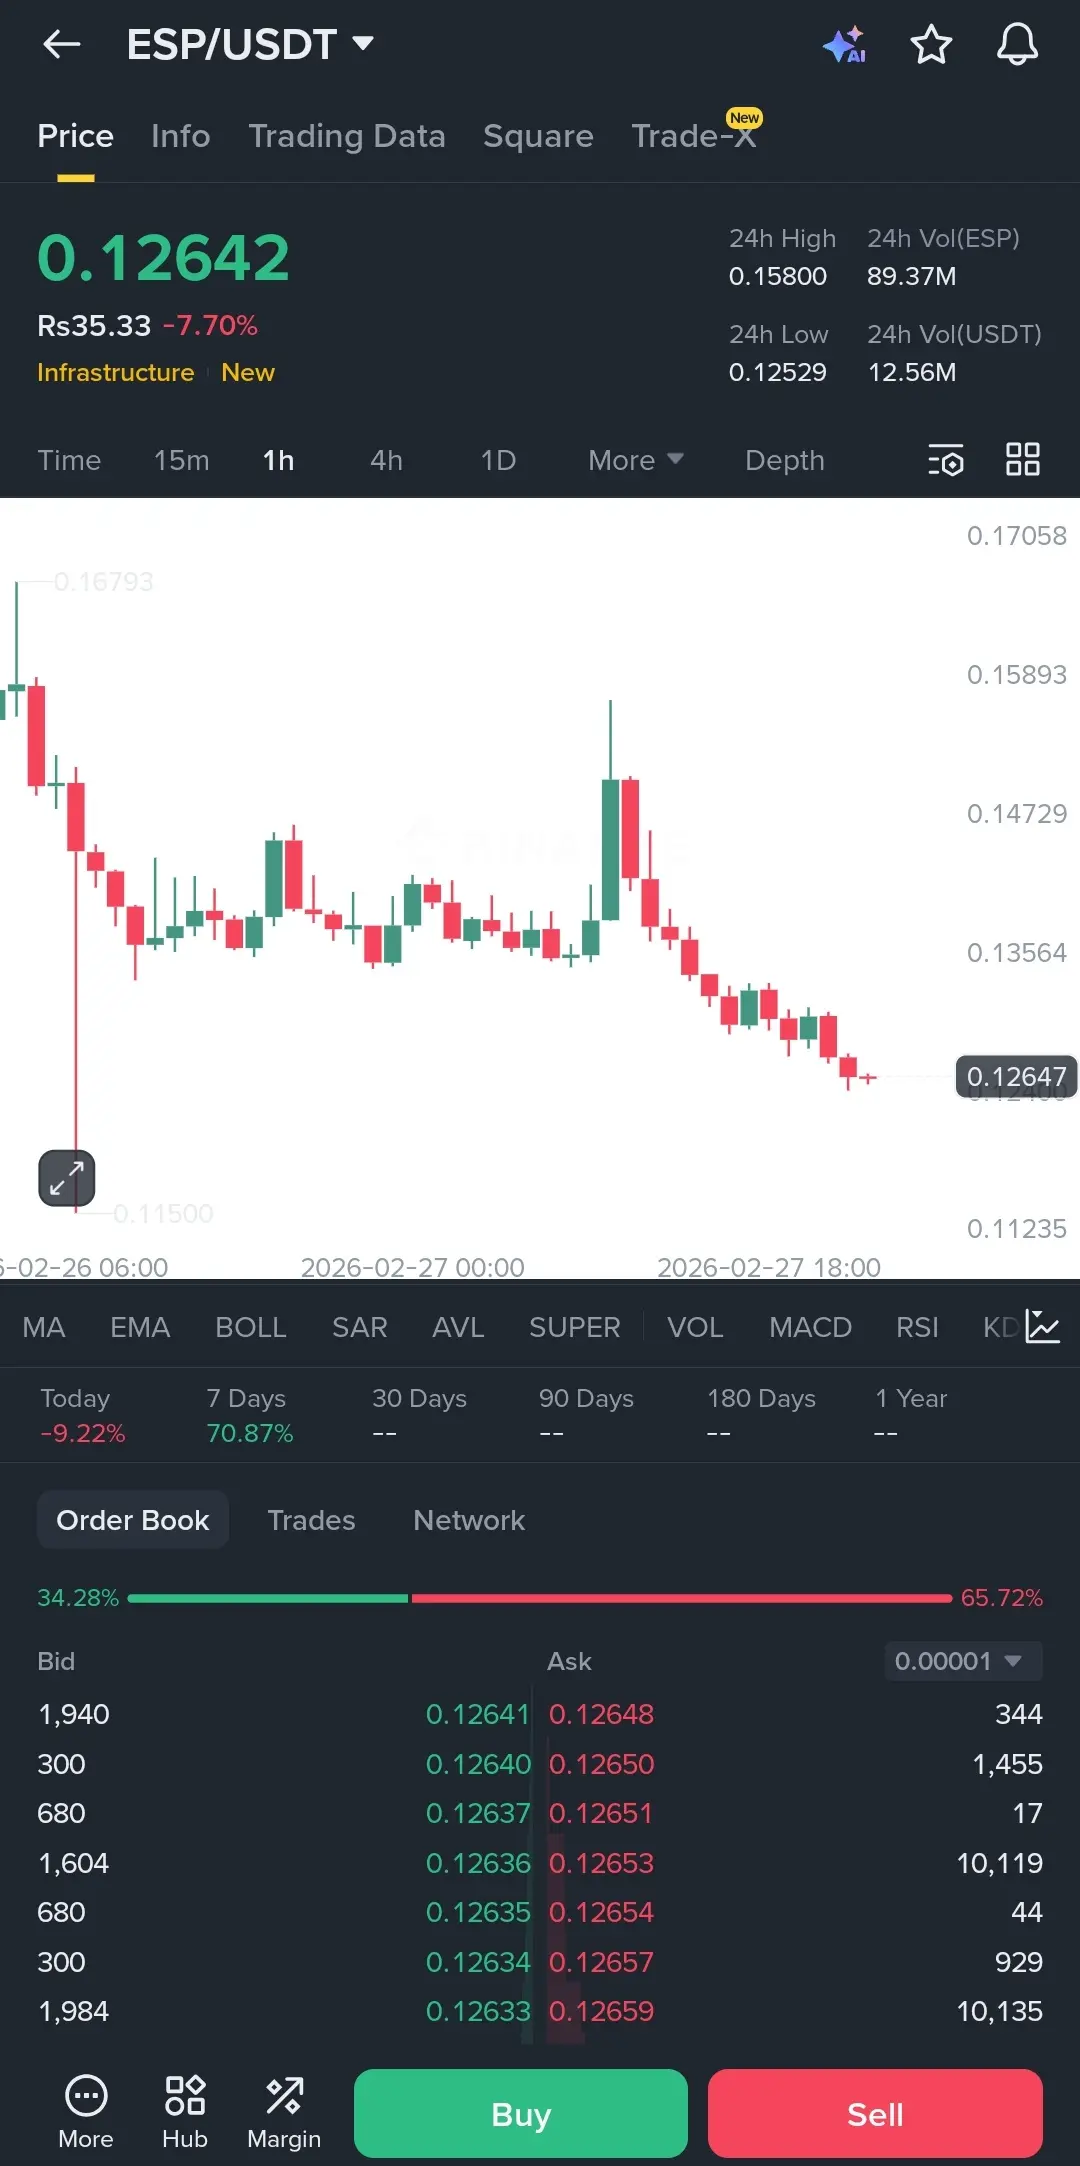
Is $ESP finally hitting a floor or is the floor about to give way?
The 1h chart on ESP is looking pretty rough right now with that slow bleed after the failed pump to 0.1580. We are currently sitting at 0.1264 and it’s basically hugging the bottom of this recent range.
Volume is fading and the order book is looking heavy on the sell side with about 65% of the pressure coming from the asks. That 0.1250 level is the absolute line in the sand. If we lose that, there isn’t much historical support holding us up from a deeper drop toward the 0.1150 zone.
I’m staying on the sidelines for this one
ESP-13.16%

- Reward
- 1
- Comment
- Repost
- Share
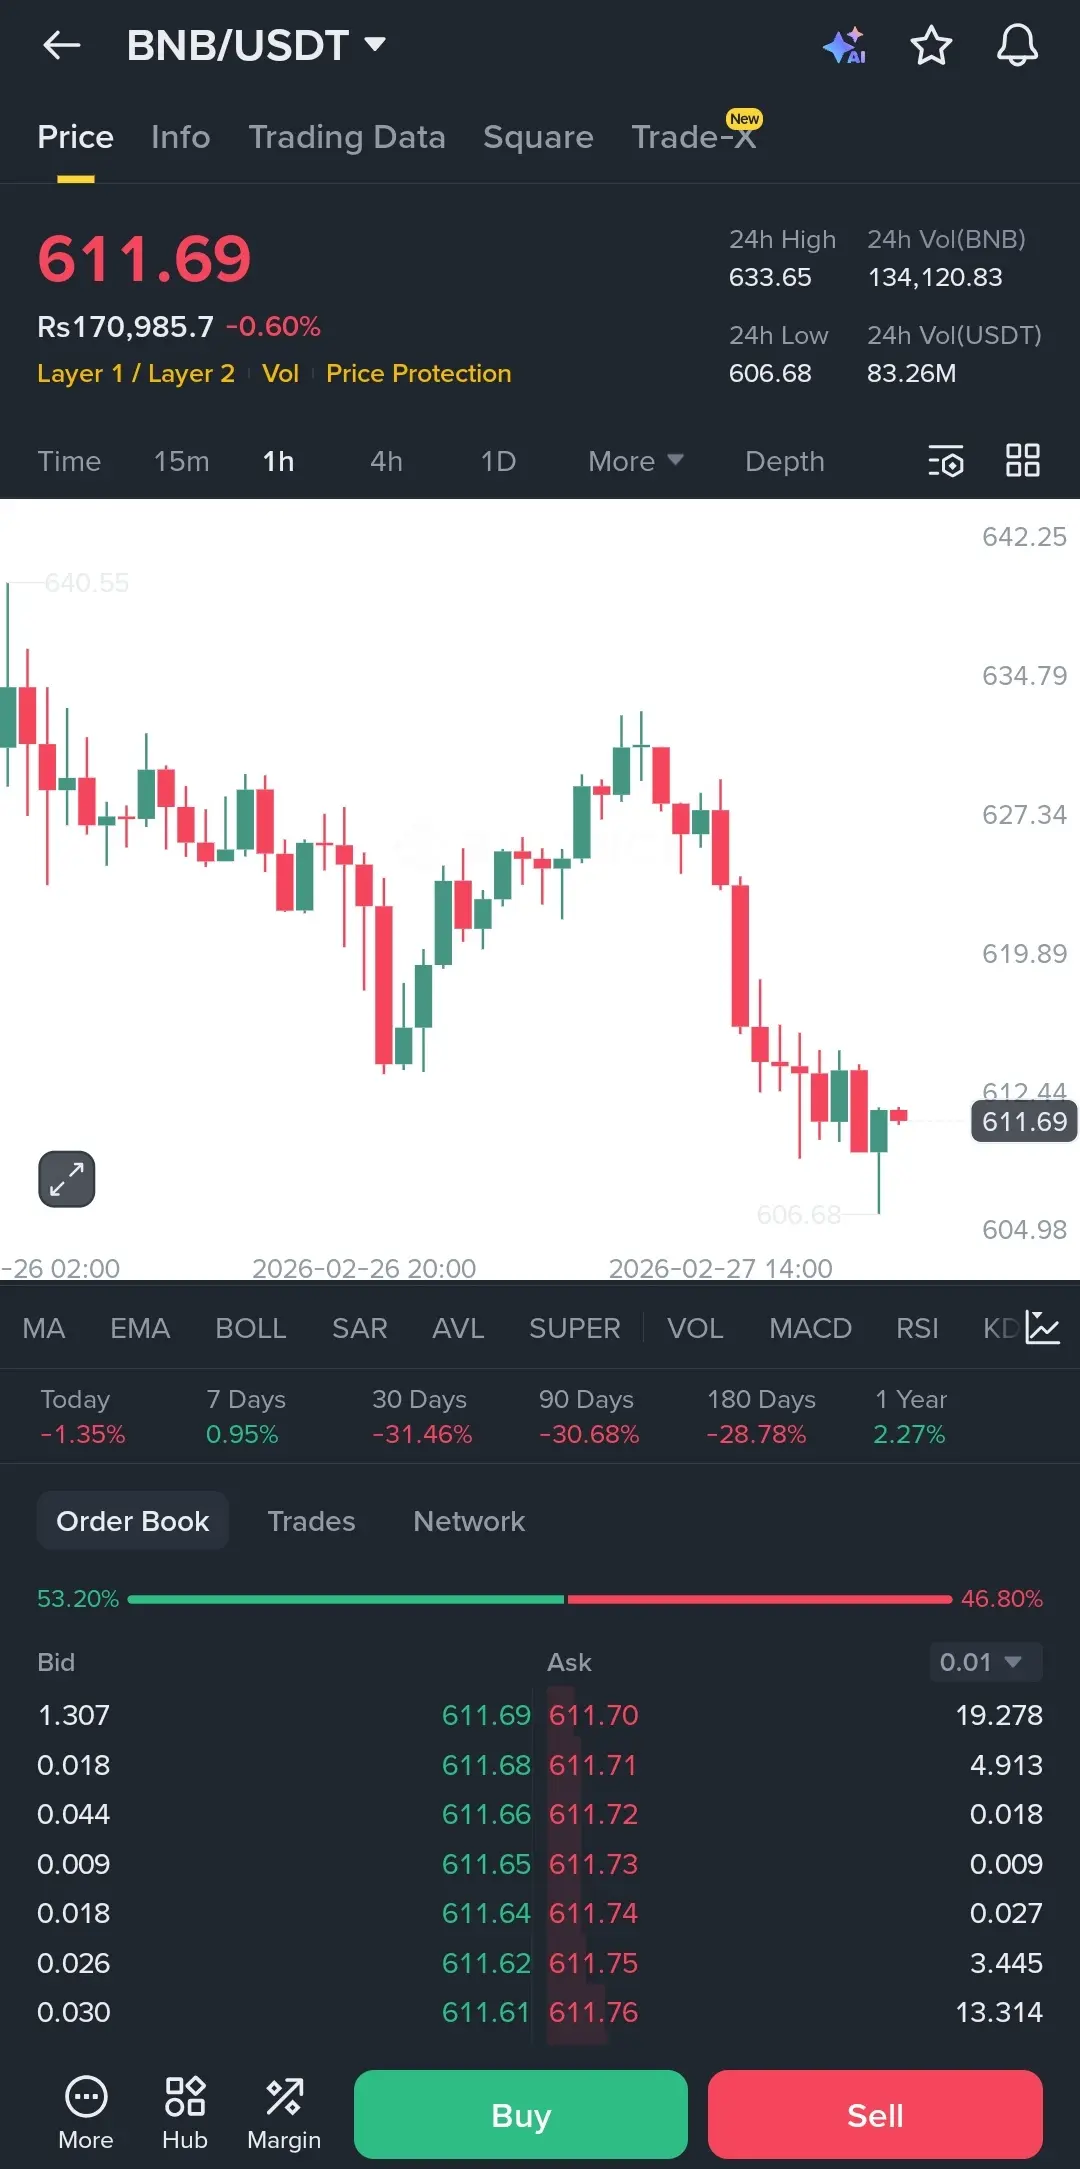
I’m starting to wonder if the $BNB bulls just ran out of gas.
Looking at the 1h chart, we just took a nasty dive from the 630 region and we are currently struggling to hold 611. That long wick down to 606 shows there's some buying interest at the bottom, but the recovery looks weak so far.
If we can't reclaim 615 soon, this might just be a brief pause before we test the 600 psychological level. The order book is slightly leaning green at 53%, but that's not enough to convince me we've bottomed out yet.
Volume on the way down was definitely higher than this current bounce, so I'm playing it
BNB-1.99%

- Reward
- 2
- 1
- Repost
- Share
GateUser-378c4af2 :
:
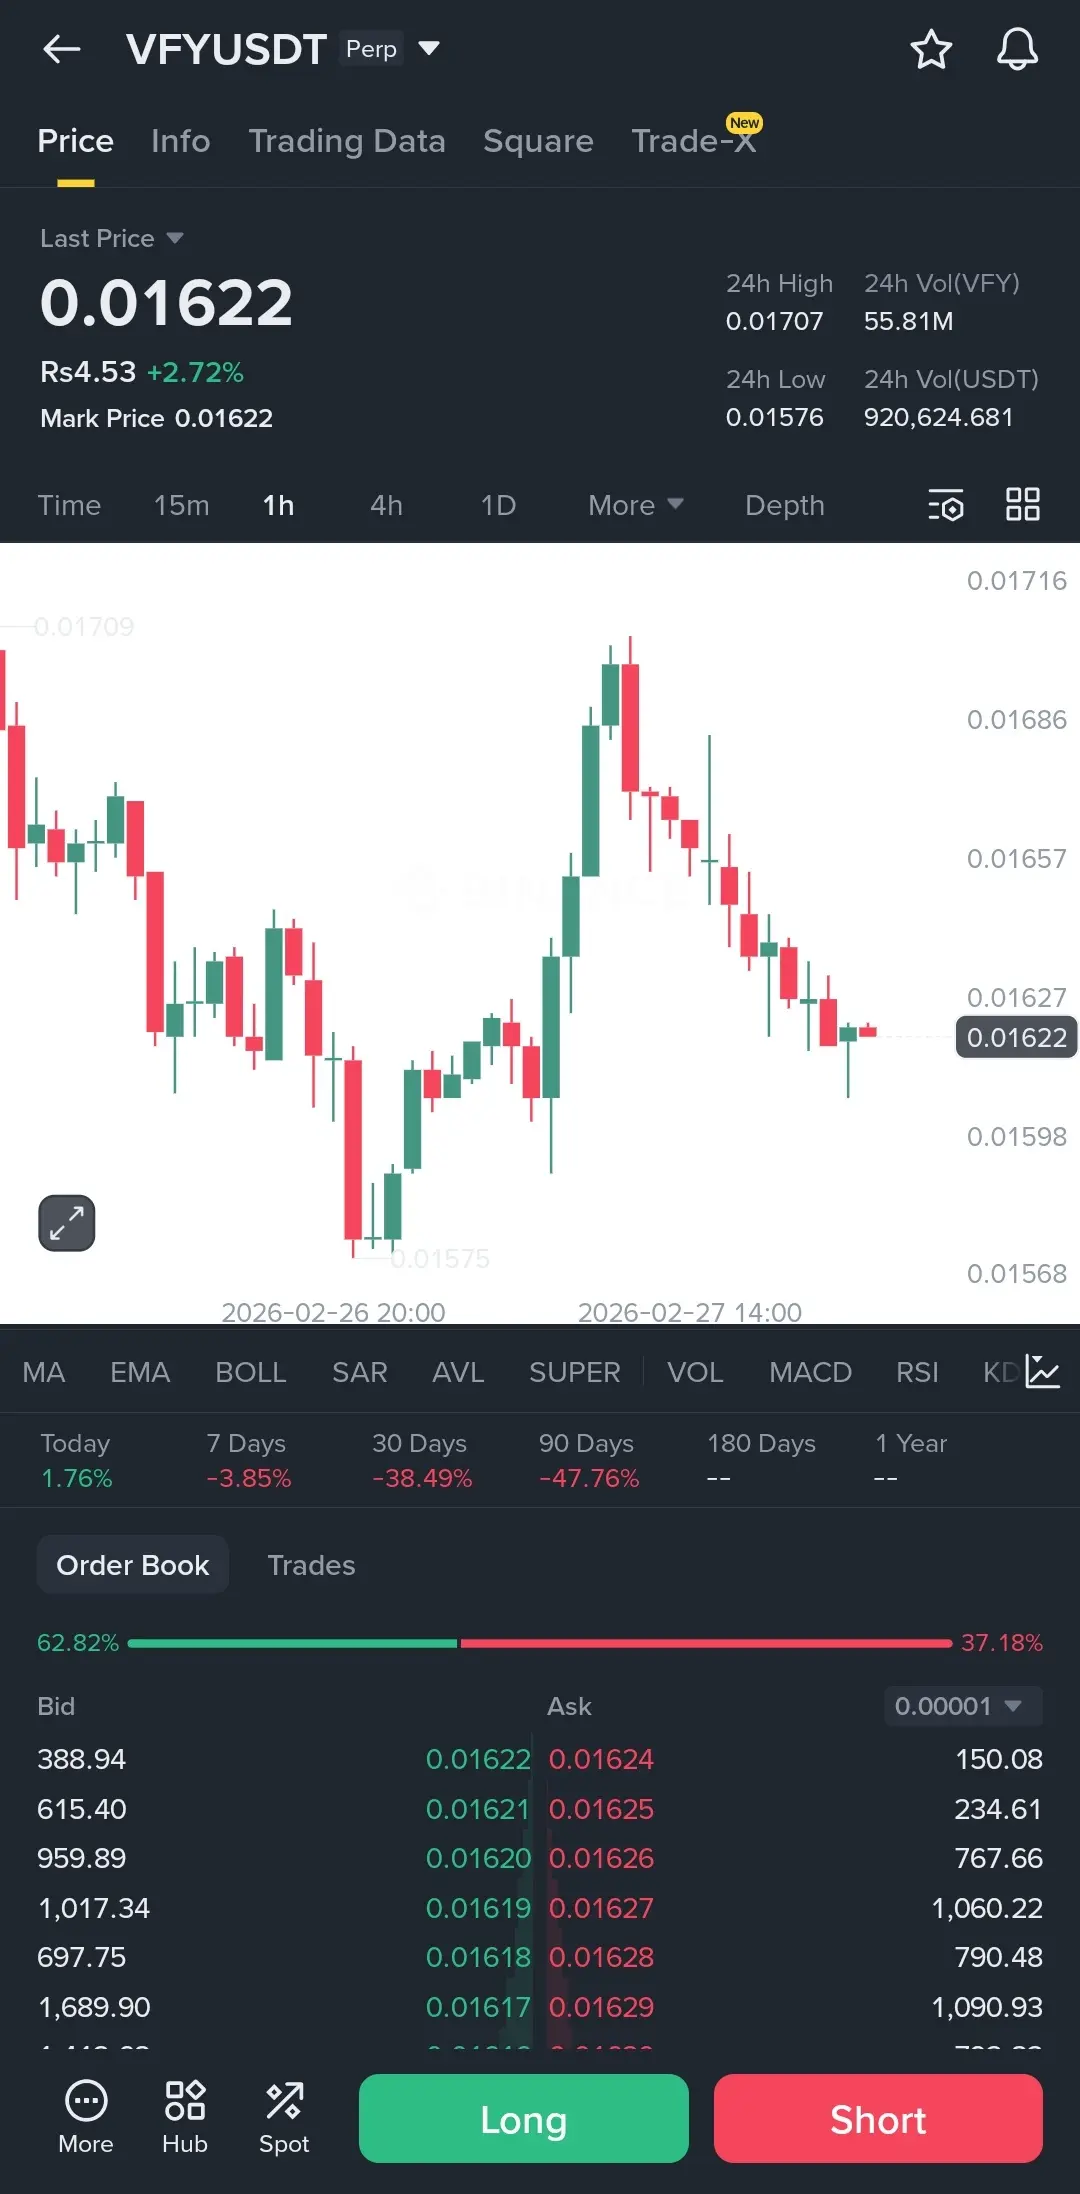
thanks for the useful information 🤠Something feels off about this $VFY move.
We just saw a solid rejection at the 0.01707 level and now we are sliding back down. It looks like it tried to make a higher high but the sellers stepped in way too fast.
Right now we are sitting at 0.01622 which is dangerously close to that local support we saw yesterday. If it doesn't hold this 0.01600 zone we could easily slip back down to test the 0.01575 bottom again.
The volume isn't exactly screaming "buy the dip" yet. I'm just watching the order book for now because that 62% buy ratio can be a bit of a trap if the price keeps making lower h

- Reward
- like
- Comment
- Repost
- Share
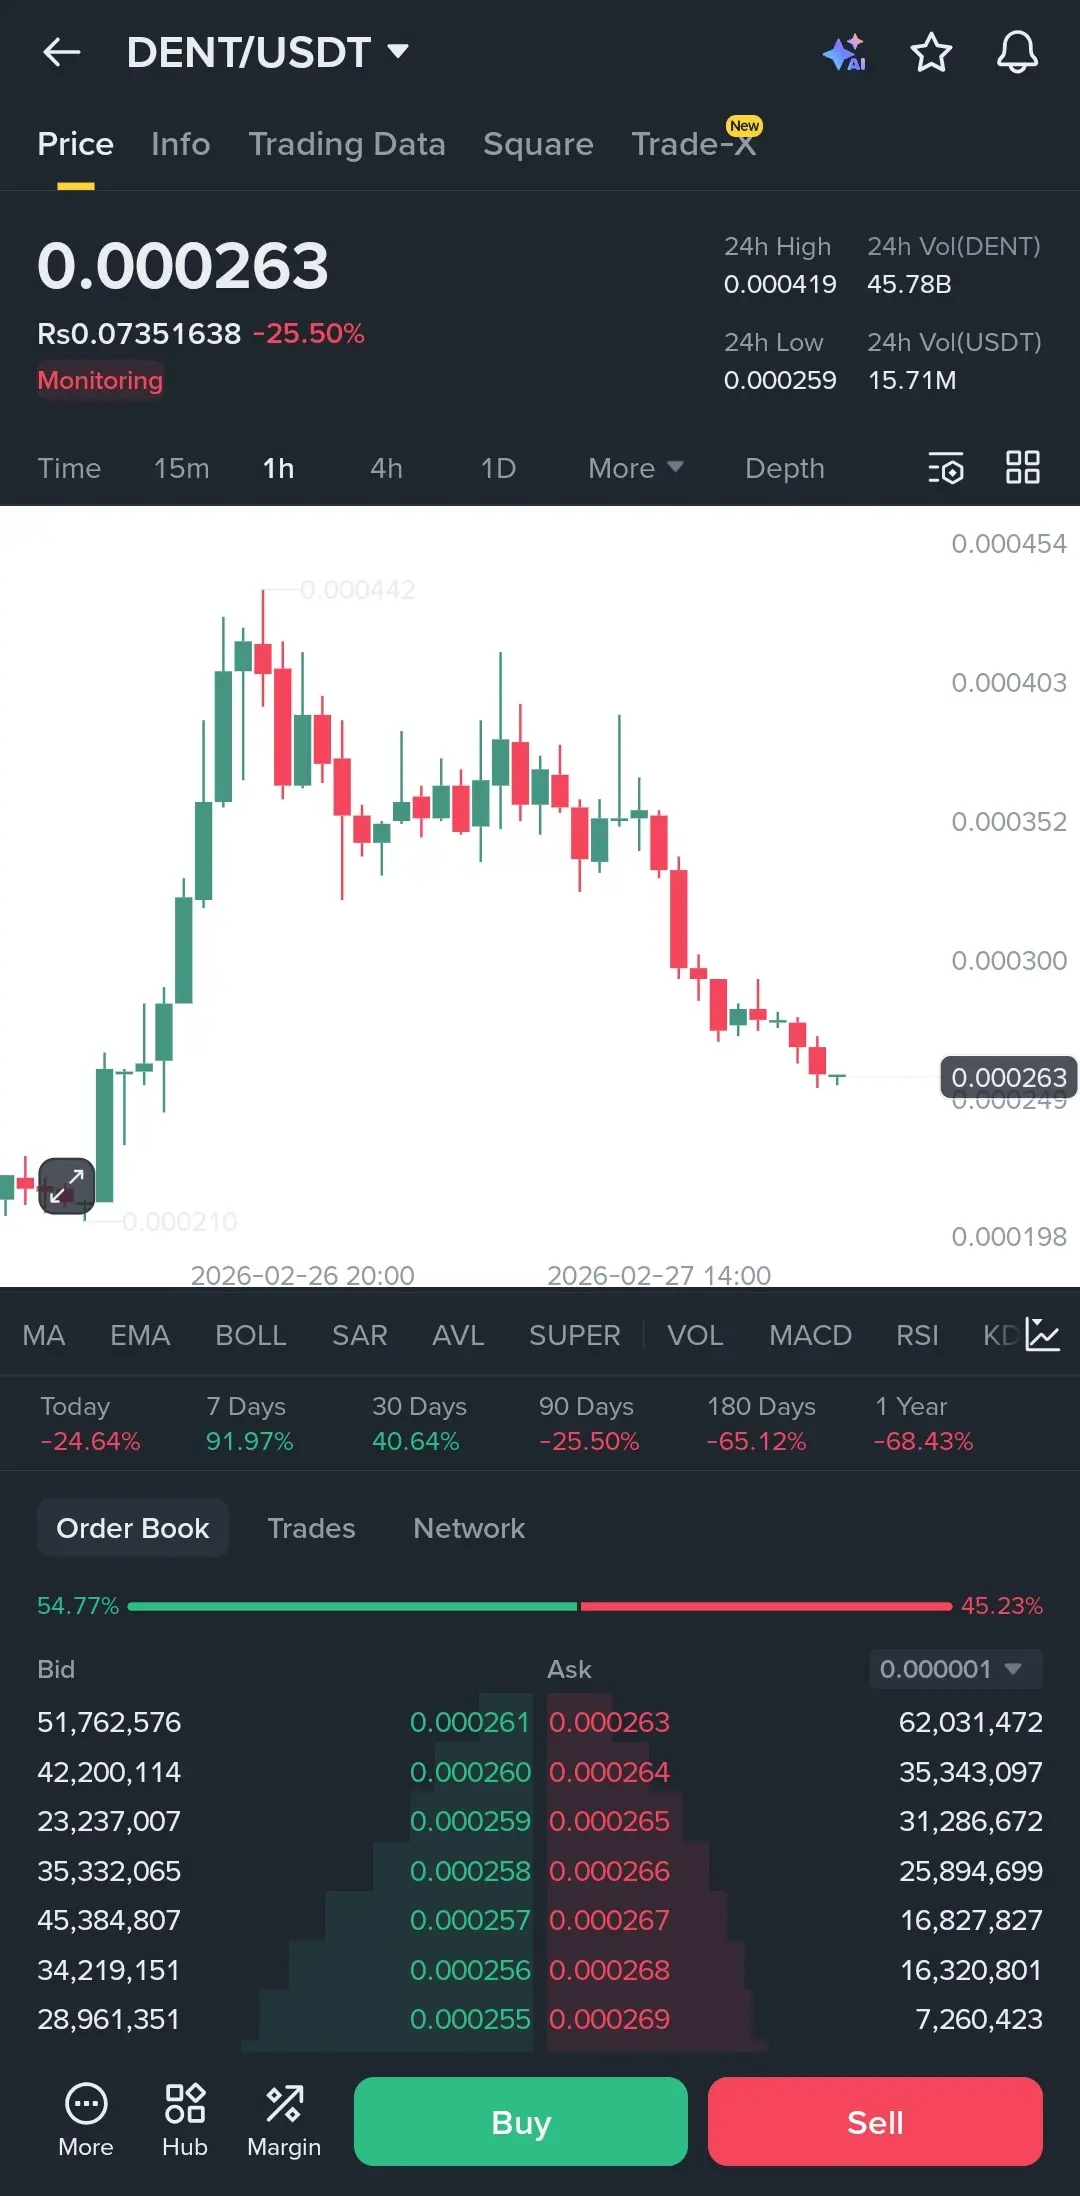
That $DENT move has everyone second-guessing right now.
Look at those candles. We just came off a massive rejection at that 0.00044 level and it’s been a straight slide ever since. The 1h chart is looking pretty heavy, especially with that -25% drop today wiping out a lot of the recent momentum.
We are currently hovering right around the 0.00026 mark. If you check the order book, there’s some decent bid support sitting at 0.00025, but the volume on the sell-side is still keeping the pressure high. It needs to stabilize here or we might be looking at a deeper retest of the 0.00021 zone wher
DENT-25.41%

- Reward
- like
- Comment
- Repost
- Share
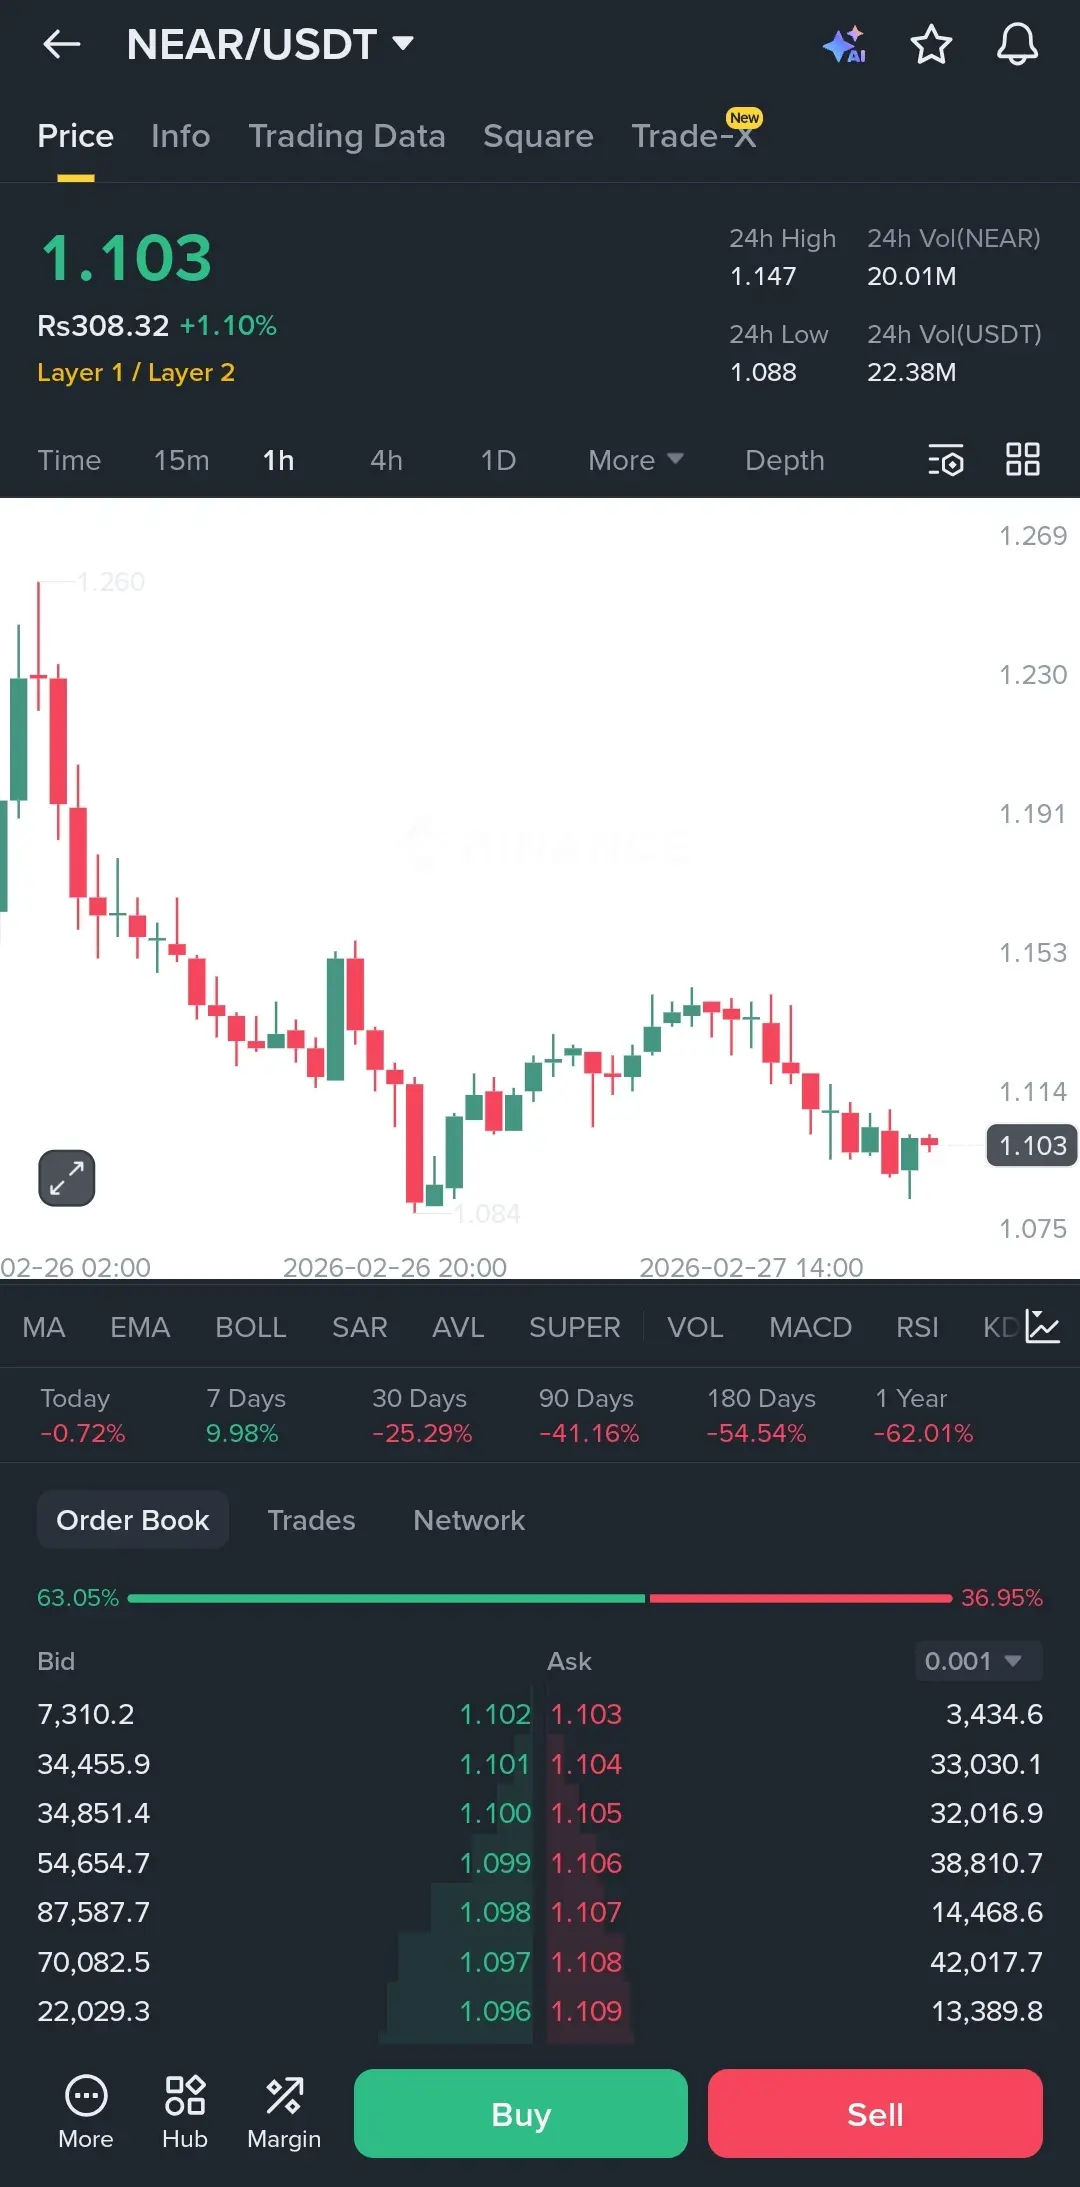
Is $NEAR setting up for a massive breakout or just baiting the late buyers again?
Looking at the 1-hour chart, NEAR is currently fighting for its life at 1.103. We saw a nice little relief bounce from the 1.084 bottom, but the momentum seems to be stalling out here.
The volume is sitting at 20M NEAR, which is decent, but we really need to see some aggressive buying if we want to flip 1.15 into support. Right now, it's just printing lower highs and that’s making me a bit nervous for the short term.
If the 1.100 psychological level holds, we might see another push toward 1.147. But honestly,
NEAR-2.37%

- Reward
- 1
- Comment
- Repost
- Share
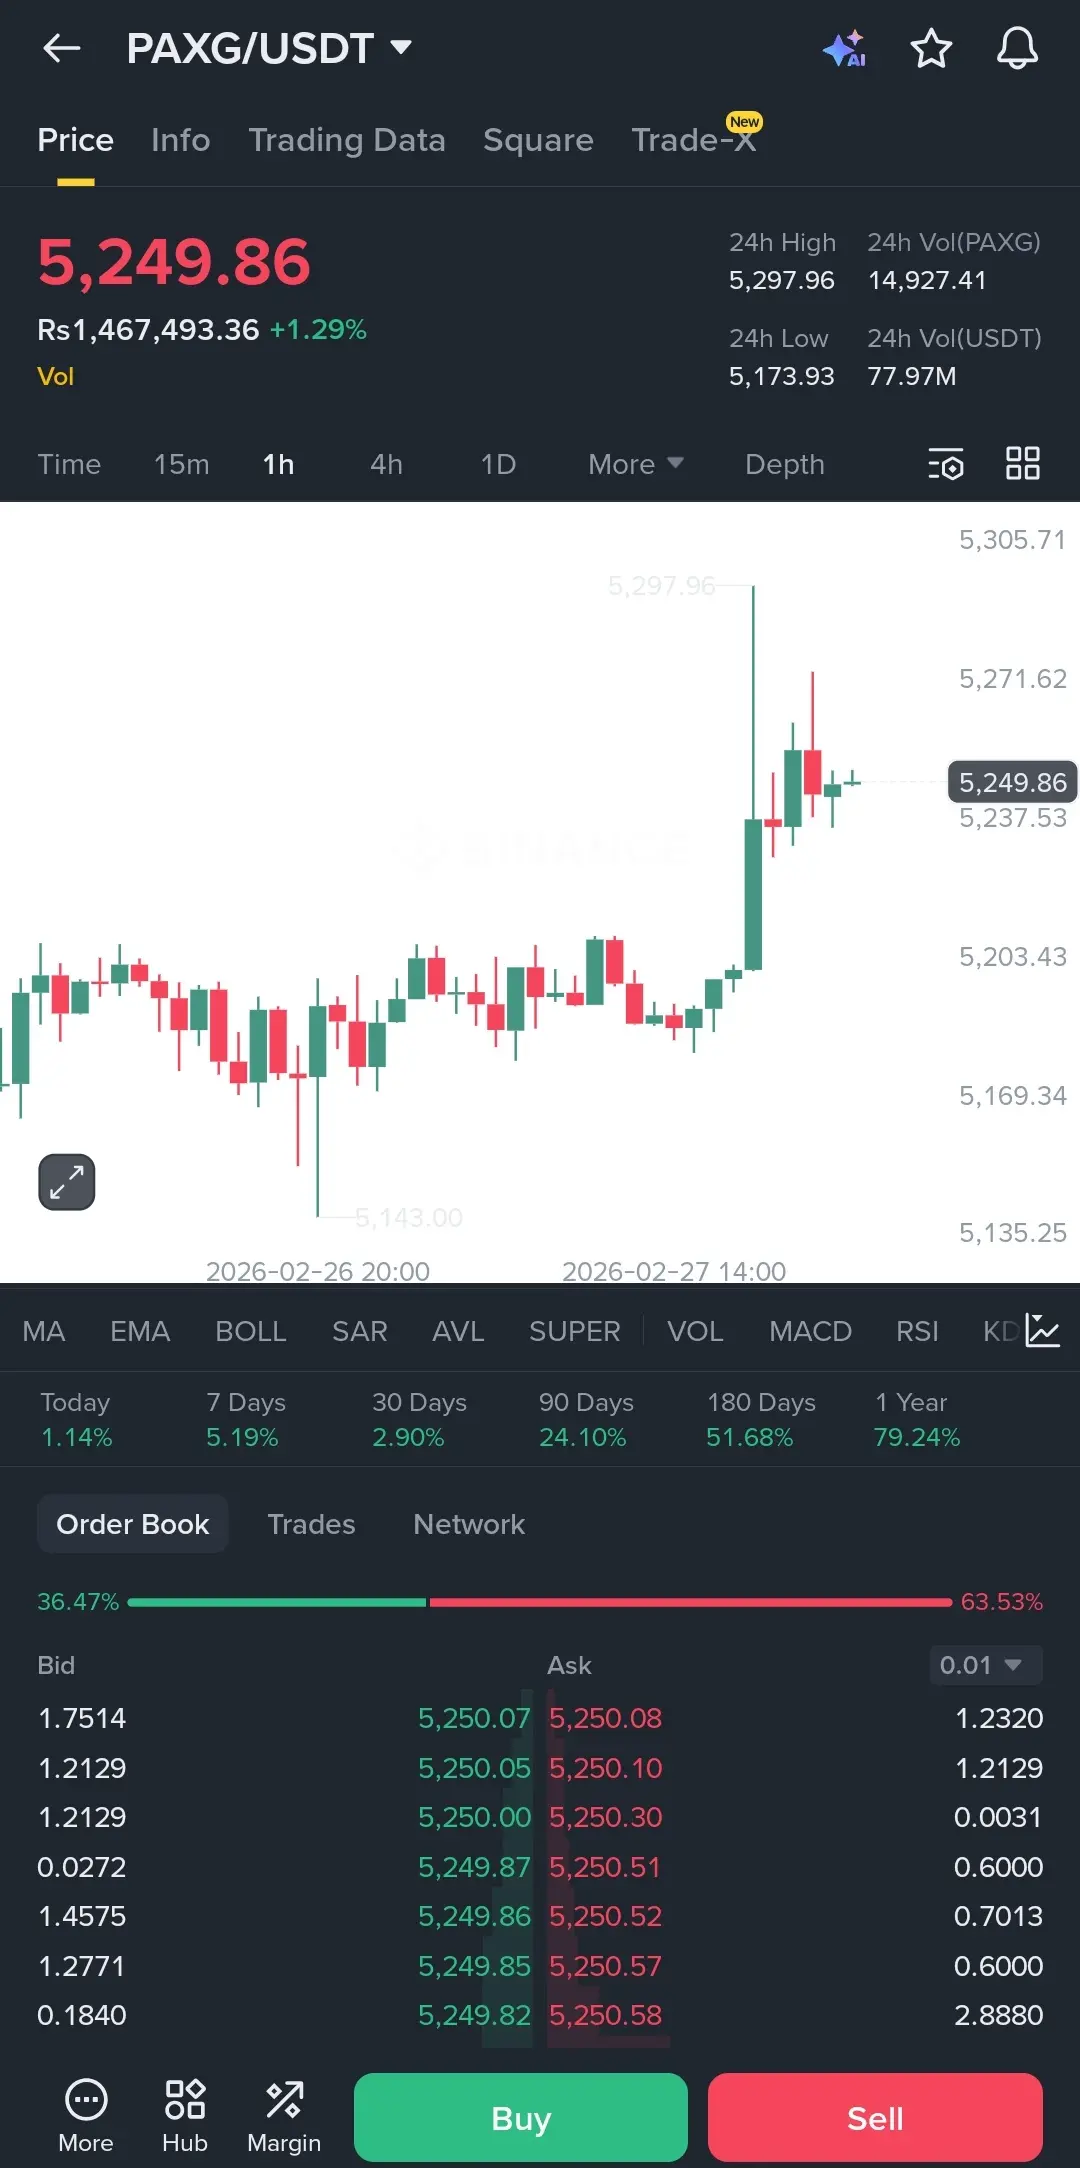
Everyone is chasing the pumps while $PAXG is quietly making a massive move behind the scenes.
We just saw a huge wick up to 5,297 and the price is currently consolidating around 5,249. This looks like a classic "buy the dip" scenario before the next leg up because it’s holding that new support level remarkably well.
The 24h volume for USDT is sitting at nearly 78M which shows there is serious money flowing into this right now. If we can stay above the 5,230 zone then I’m expecting another attempt at 5,300 very soon.
It’s rare to see gold-backed assets move with this much volatility so I’m
PAXG1.36%

- Reward
- like
- Comment
- Repost
- Share
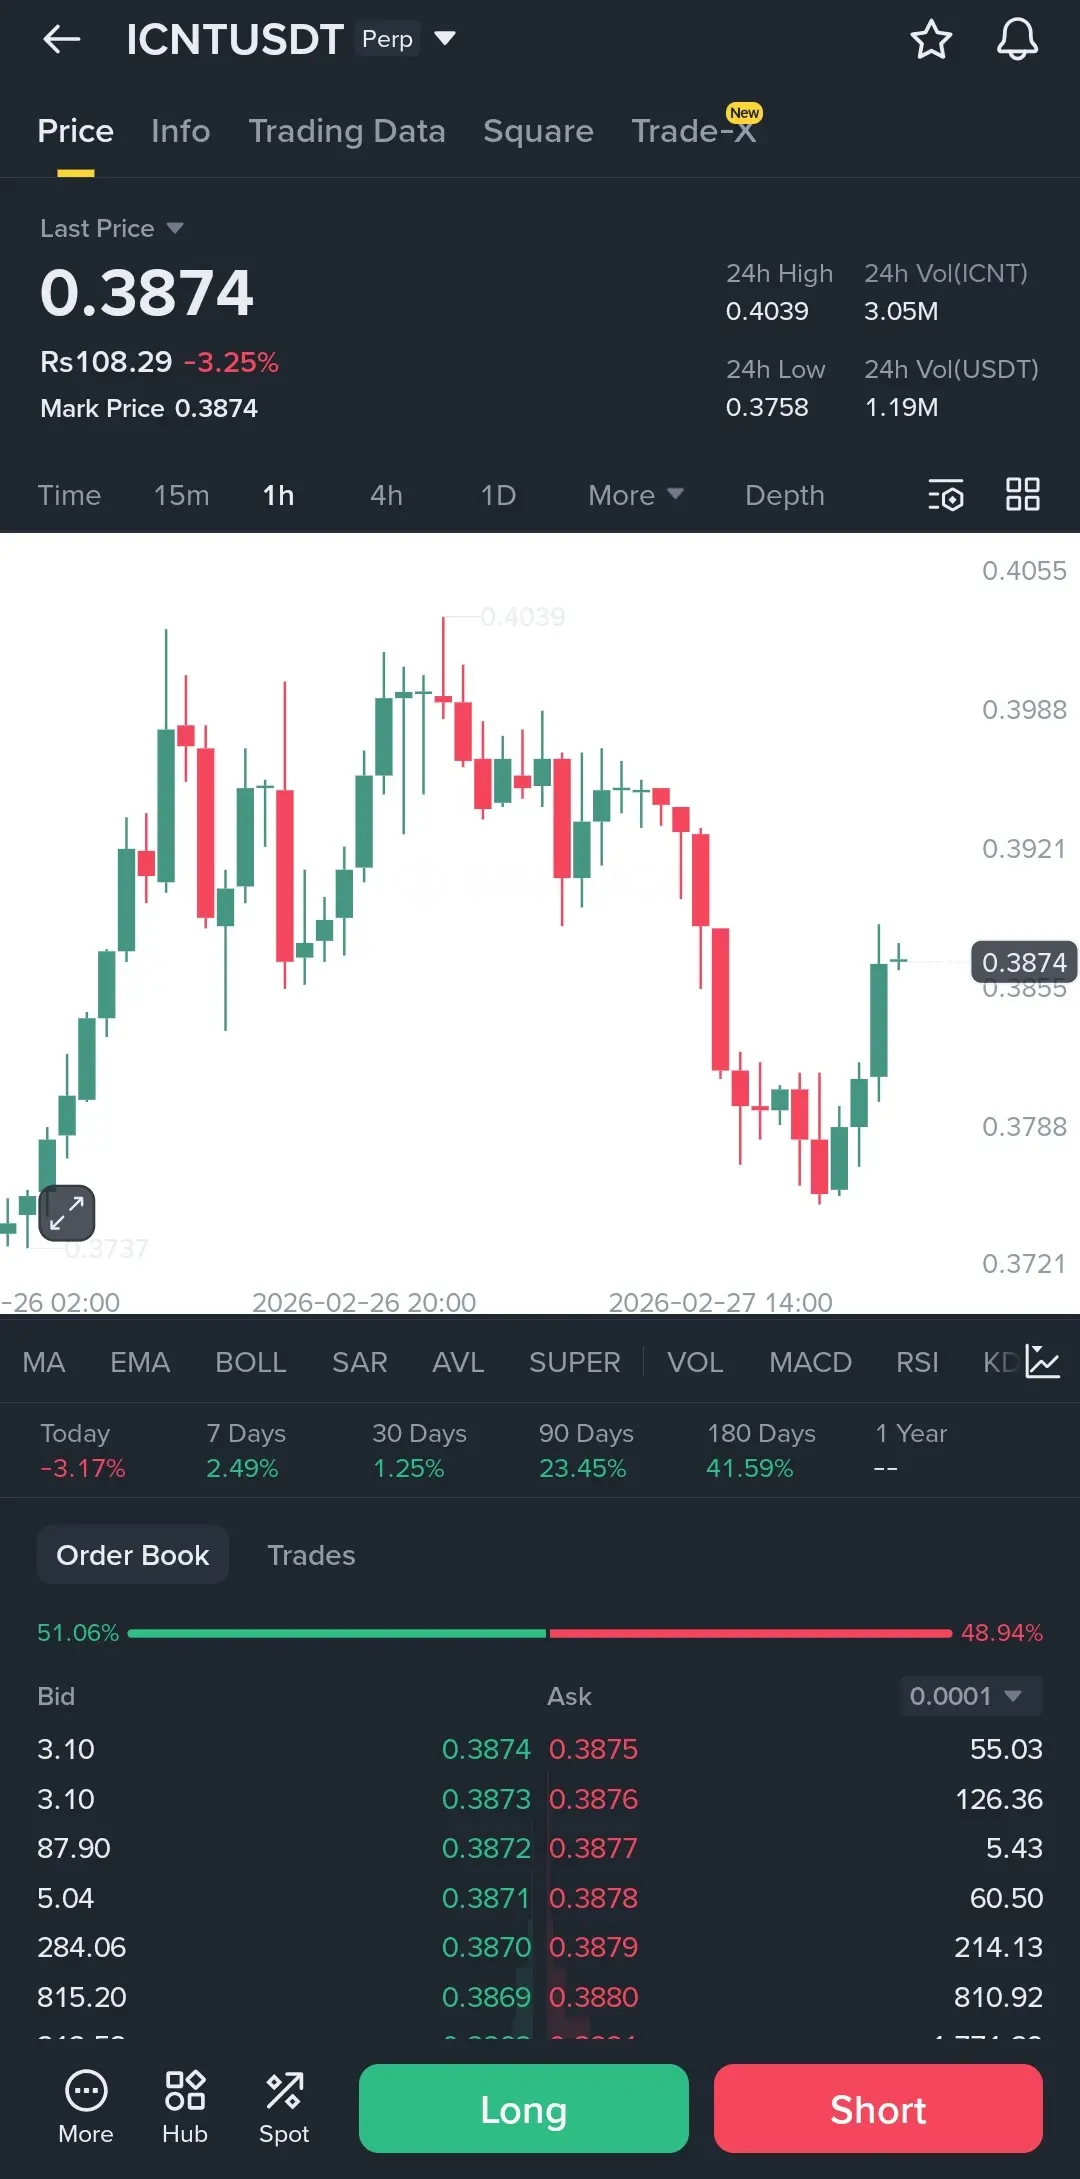
Is the $ICNT dip finally over or are we just catching a falling knife?
That drop from 0.4039 was pretty sharp and definitely shook out some weak hands. We found a bit of a floor around 0.3758 and the current bounce to 0.3874 looks like it’s trying to reclaim some lost ground.
The volume isn't screaming "moon" yet at 3.05M but the order book is looking a bit more balanced now. If we can squeeze past 0.3920 and hold it as support then we might have a shot at testing the local highs again.
I'm playing this one carefully. If the 0.3850 area fails to hold as support on this retest then I'm expe
ICNT-3.14%
- Reward
- 1
- Comment
- Repost
- Share
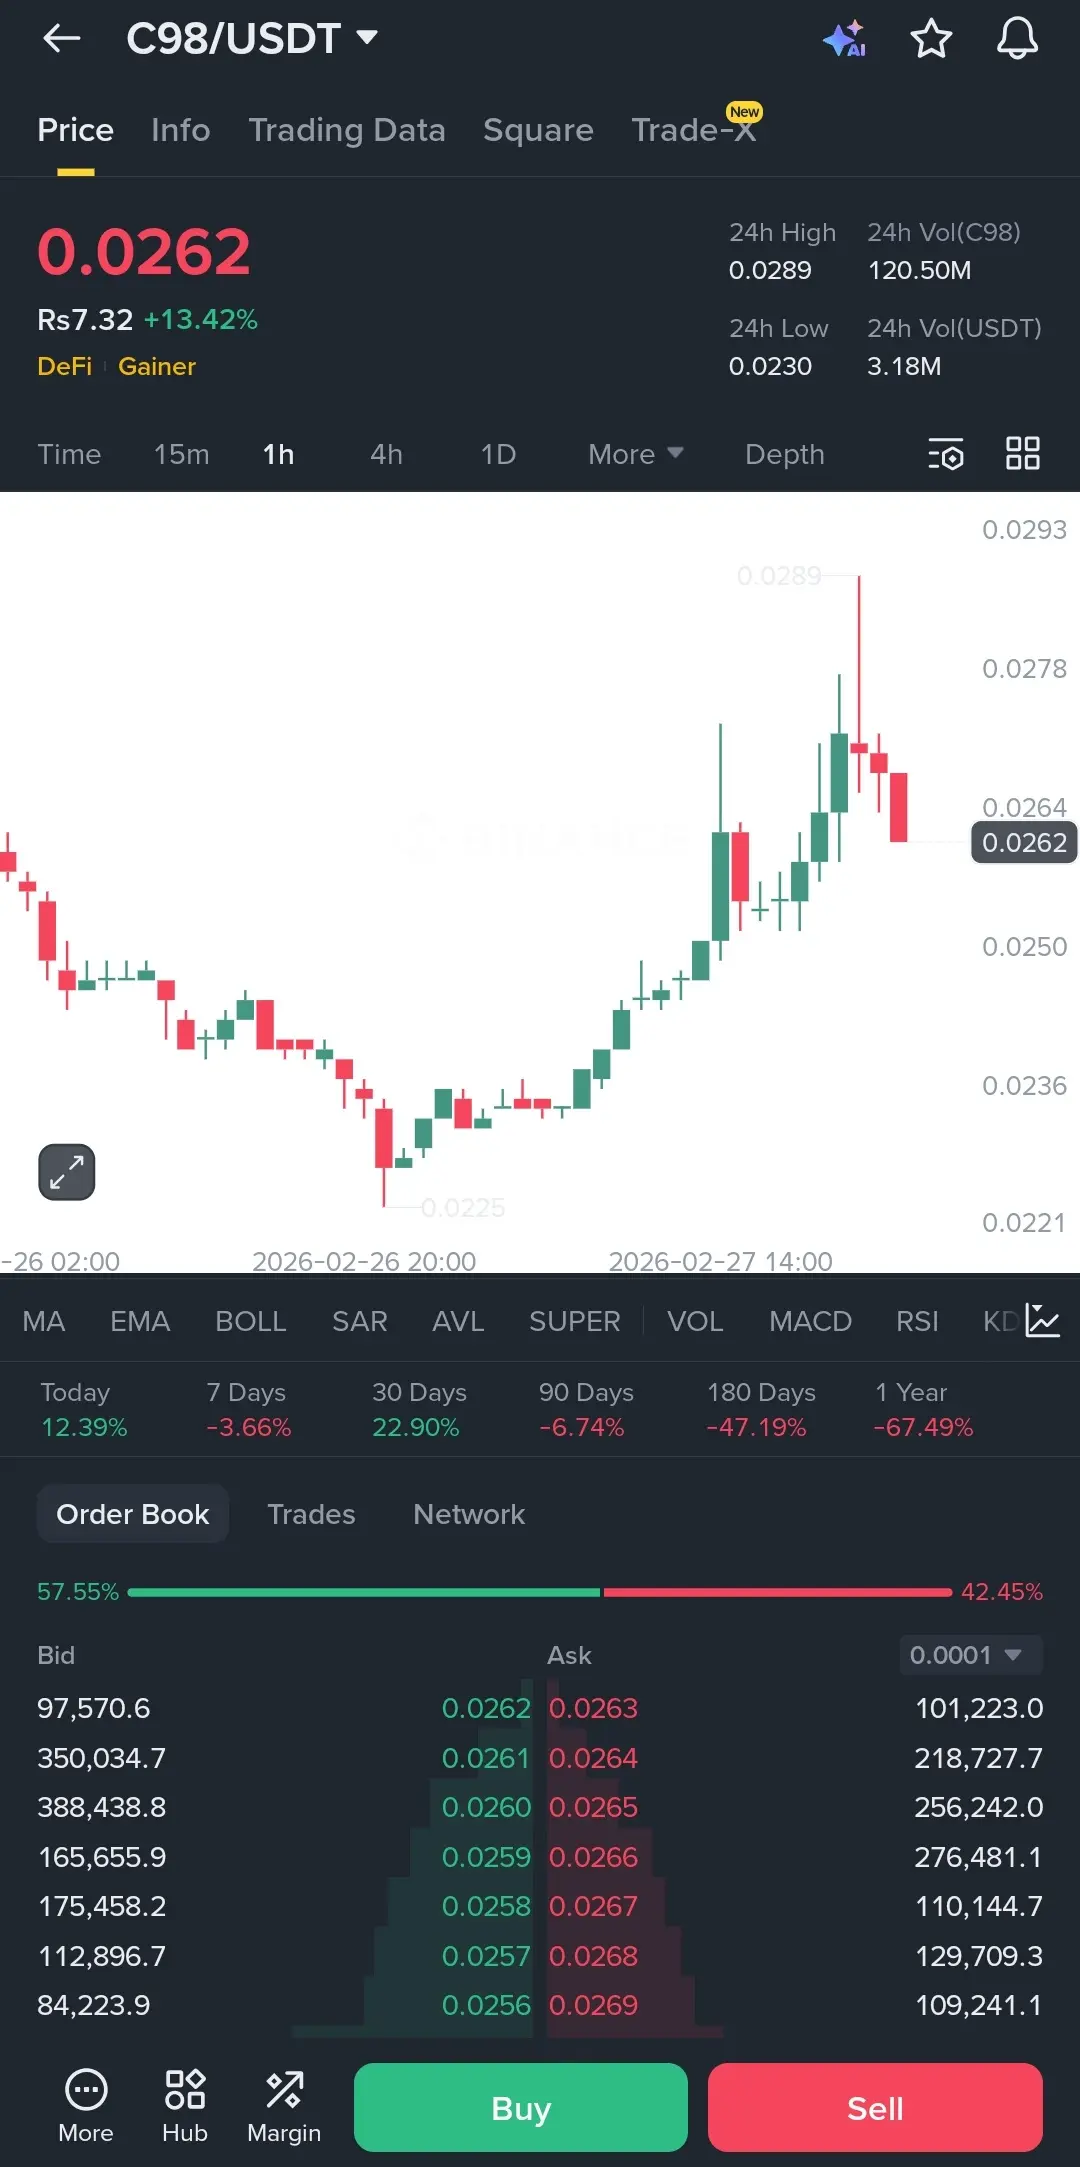
Is $C98 finally waking up or are we about to get trapped at the top?
The price action on the 1-hour chart is actually looking pretty strong after that bounce from 0.0225. We just saw a massive spike up to 0.0289 but it got rejected quickly and now we're sitting at 0.0262.
Volume is picking up with 120M traded in the last 24 hours so there is definitely some eyes on this right now. If we can hold the 0.0255 area as support we might see another leg up to test that 0.029 level again.
I'm keeping an eye on the buy orders to see if the bulls have enough gas left to flip this into a proper uptre
C989.66%

- Reward
- like
- Comment
- Repost
- Share
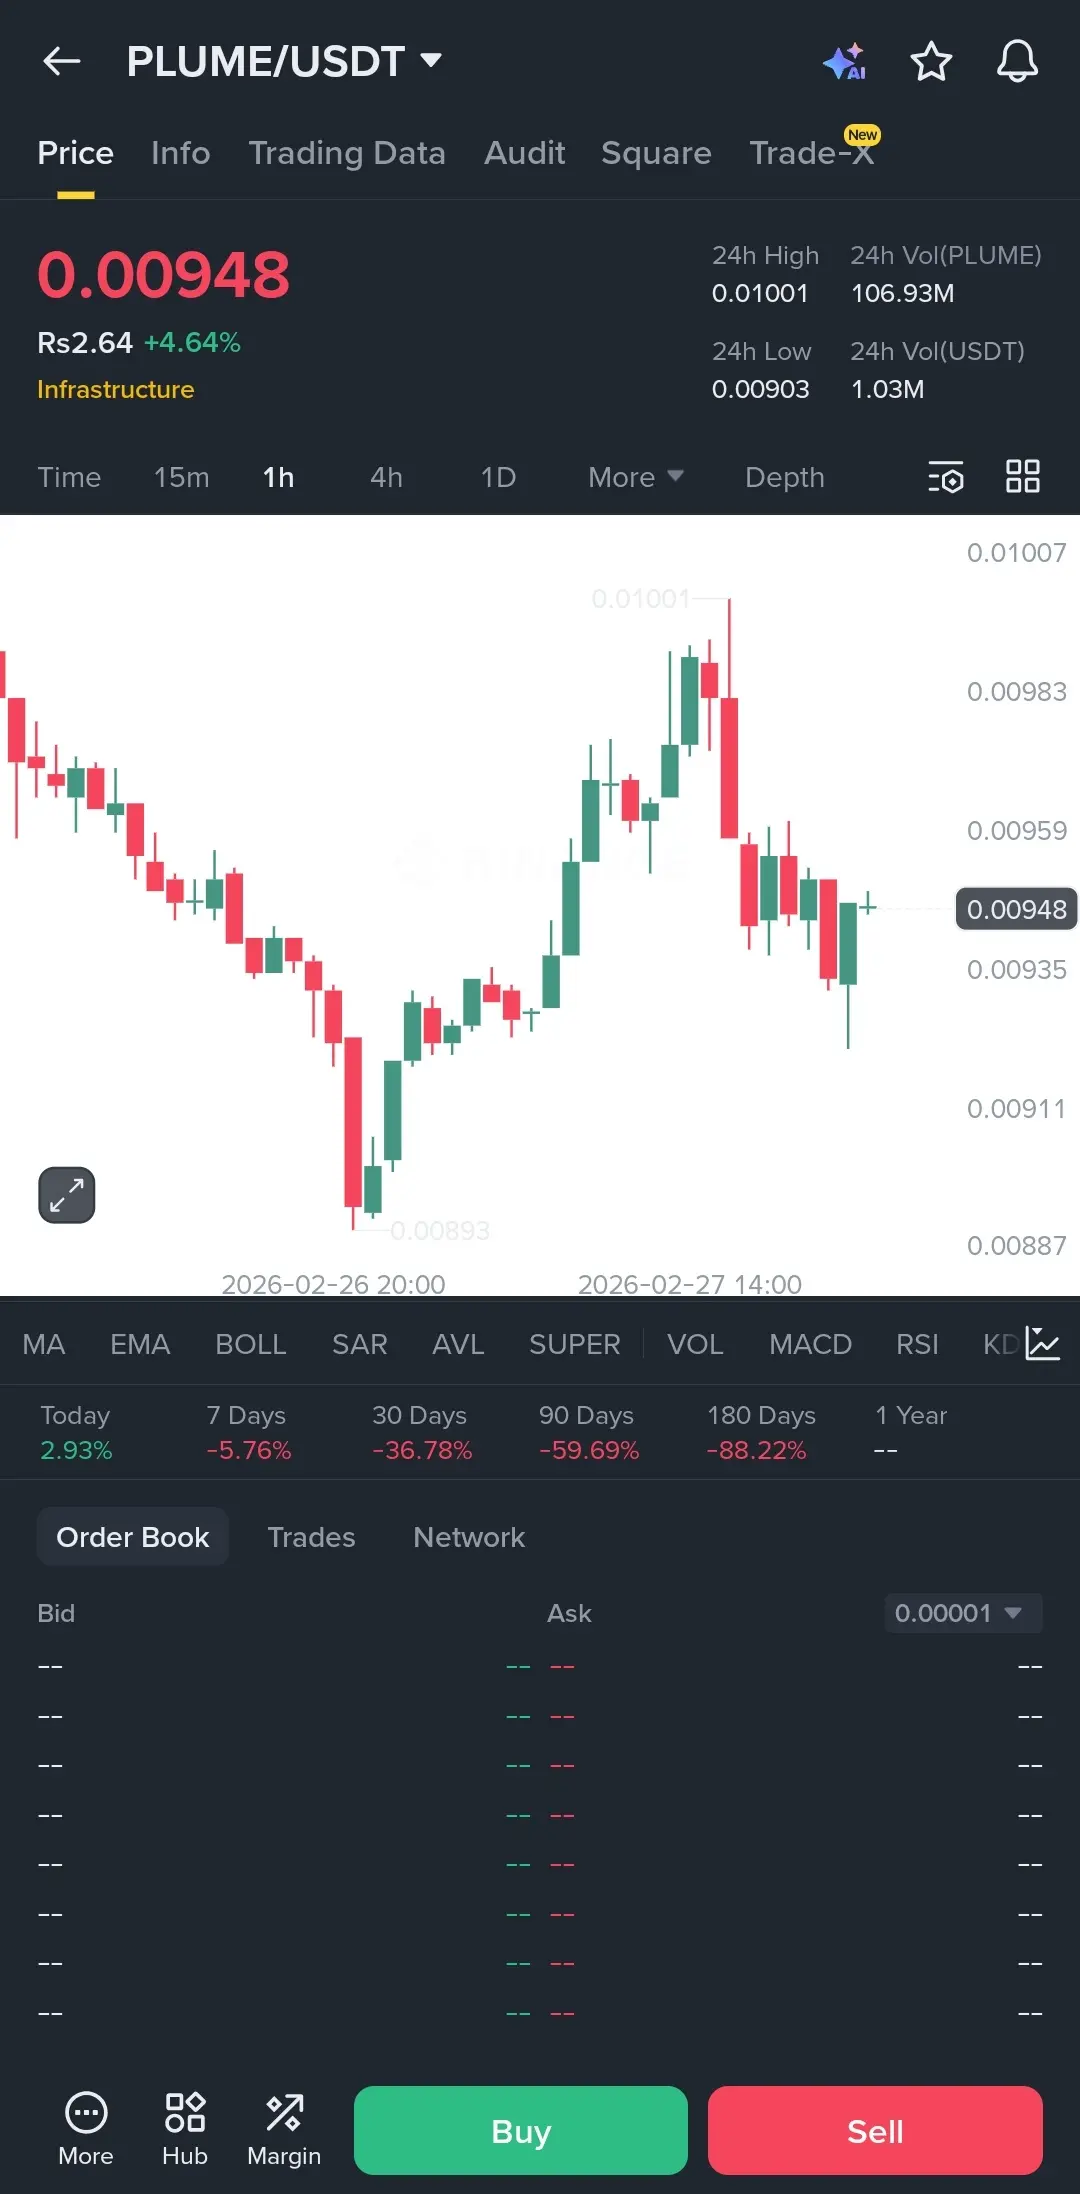
Is it finally time for a reversal or just another fake-out?
$PLUME is showing some signs of life after that nasty dip to 0.0089. We’ve seen a decent bounce back to 0.0094 but the 1-hour chart is struggling to hold its ground at these levels.
The volume is sitting around 106M which isn't huge, but it's enough to keep the price moving. If we can flip 0.010 into support, we might actually have a trend shift. If not, we’re probably just ranging between 0.009 and 0.010 for a bit longer.
I’m watching the 0.0093 level closely as immediate support. As long as we stay above that, I’m cautiously opt
PLUME0.24%

- Reward
- 1
- Comment
- Repost
- Share
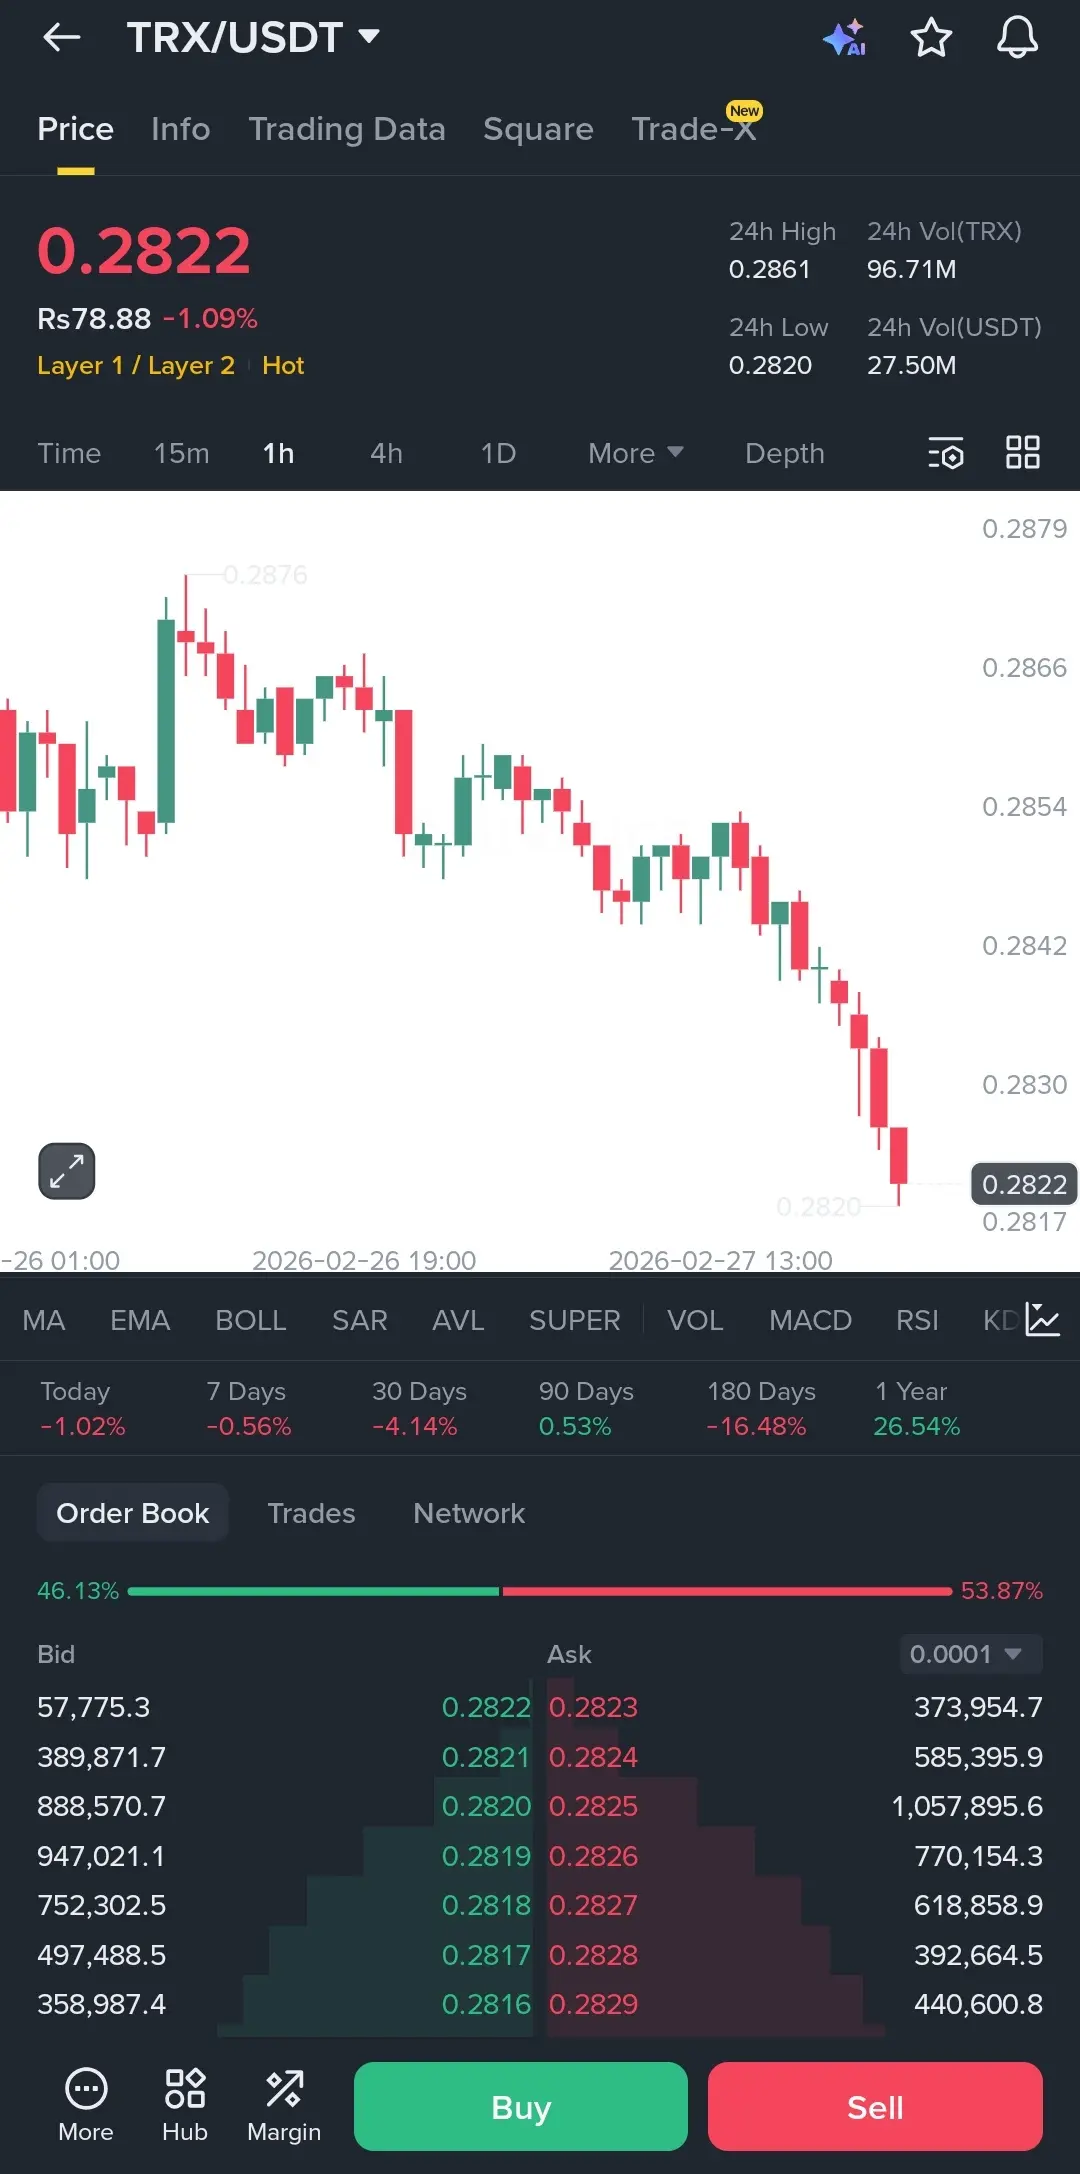
Look at the way $TRX is bleeding out right now.
That 0.2822 level is the only thing keeping us from a complete breakdown. We’ve been printing lower highs all day and the latest hourly candle is looking really heavy. It’s basically hugging the 24h low of 0.2820.
Volume is sitting at 27.5M USDT which isn't massive, but the sell side in the order book is definitely starting to stack up. About 54% of the orders are leaning bearish right now. If we lose 0.2820, there isn't much historical support nearby to stop a quick flush.
I’m watching for a potential sweep of the lows to grab liquidity befo
TRX-1.16%

- Reward
- 2
- Comment
- 1
- Share
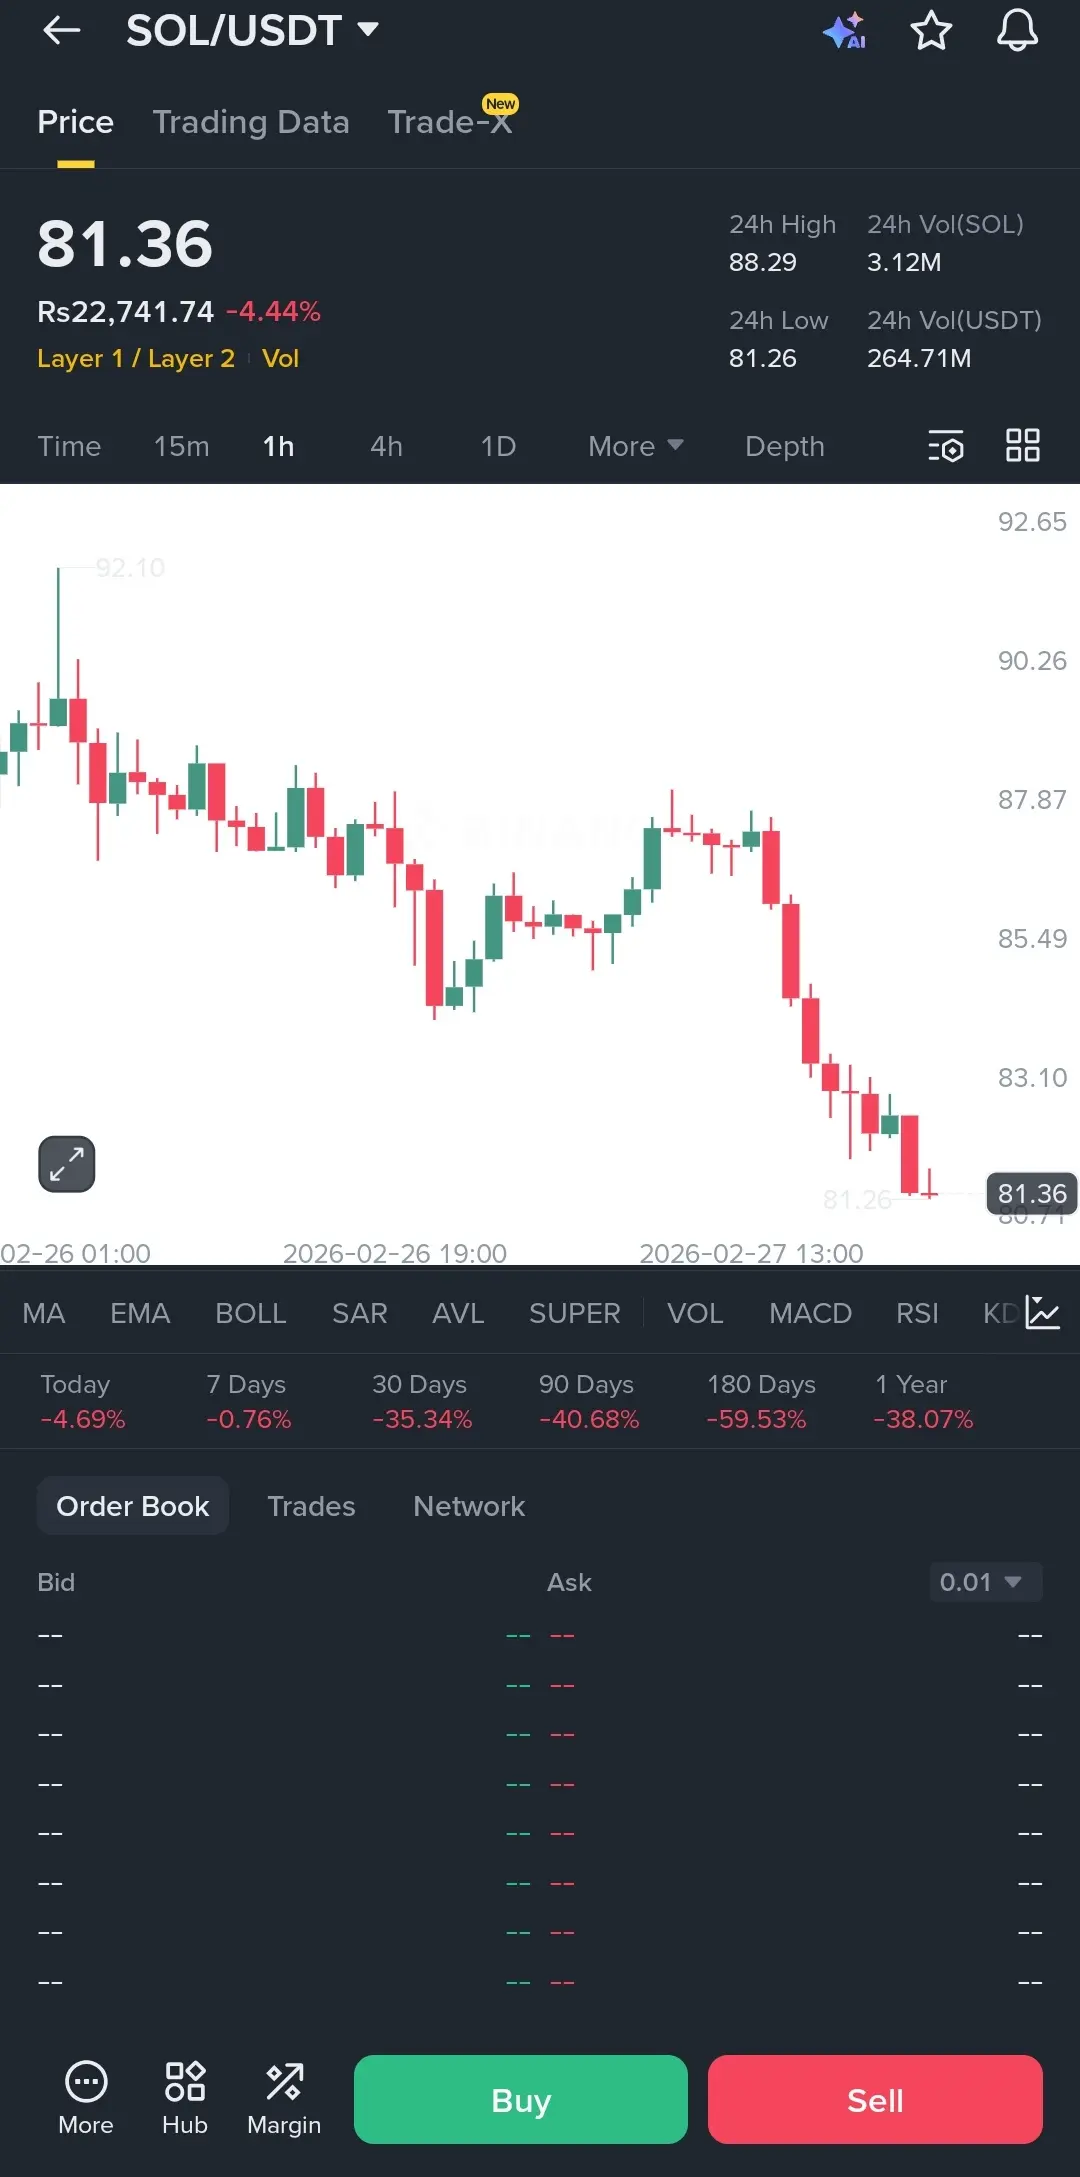
The $SOL chart is looking like a straight up waterfall right now.
I honestly didn't think we'd see 81.36 this fast. We just fell off a cliff after that weak attempt to hold 85.00 and there is zero buyer confidence on this hourly timeframe. We are basically sitting on the 24h low of 81.26 and if that gives way, the next psychological floor is all the way down at 80.00.
The volume is heavy at 264M USDT which shows this isn't just a low liquidity slip, people are actually exiting positions. Every little green candle is getting snuffed out before it even gets a chance to breathe.
I’m watching
SOL-5.24%

- Reward
- like
- Comment
- Repost
- Share
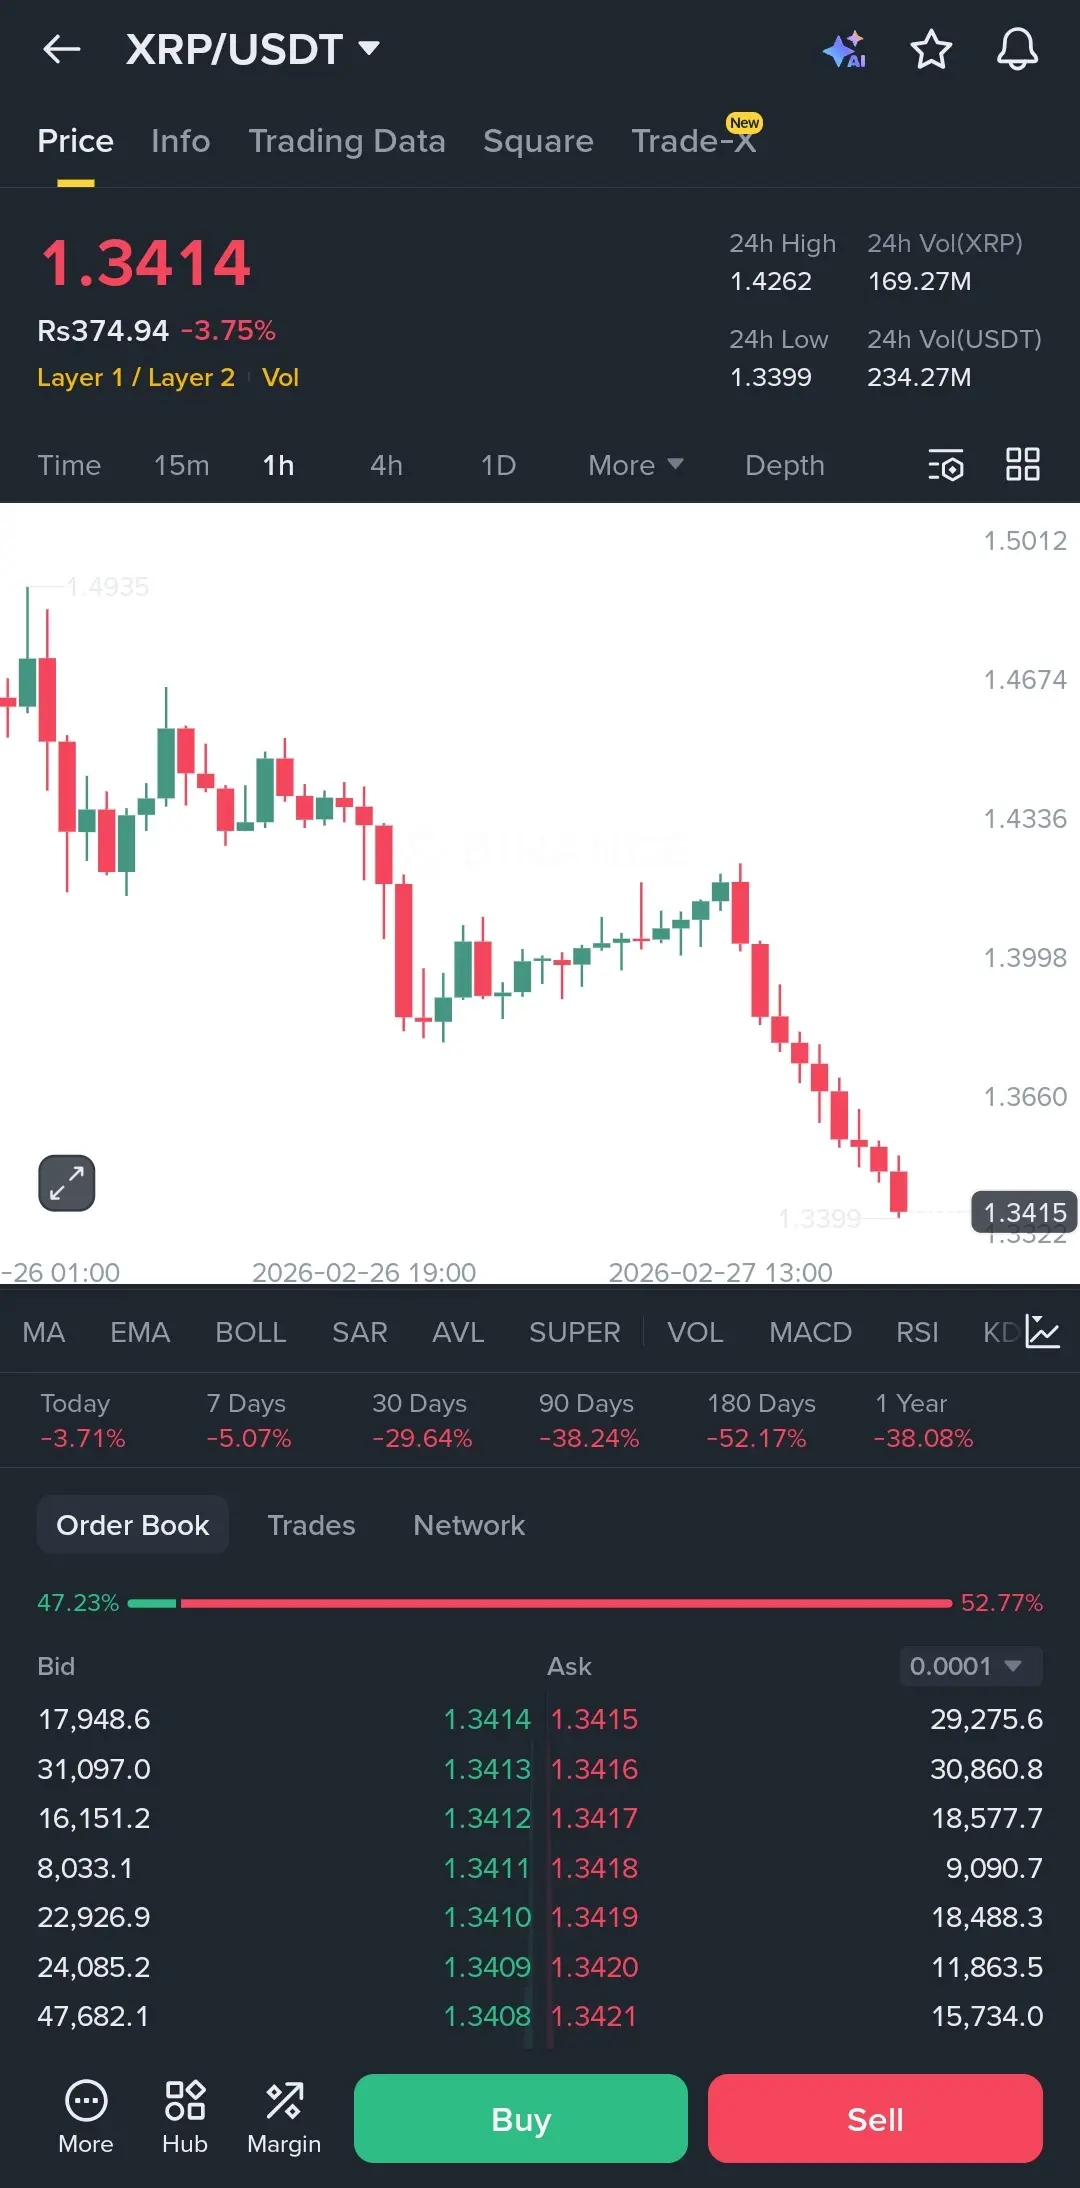
This $XRP chart is a total trap for anyone trying to catch the bottom.
We just sliced through $1.40 like it wasn't even there. The price action is looking ugly, with red candle after red candle pushing us down toward the 24h low of 1.3399.
The volume is huge at 234M, which tells me this isn't just a tiny dip, it's a serious sell-off. If you look at the order book, the sellers are clearly in control with about 52% of the weight, and that wall at 1.3415 is getting hammered.
If we don't see some aggressive buying come in at this 1.34 level, we might be looking at a much faster drop toward 1.3
XRP-3.7%
- Reward
- 1
- Comment
- Repost
- Share
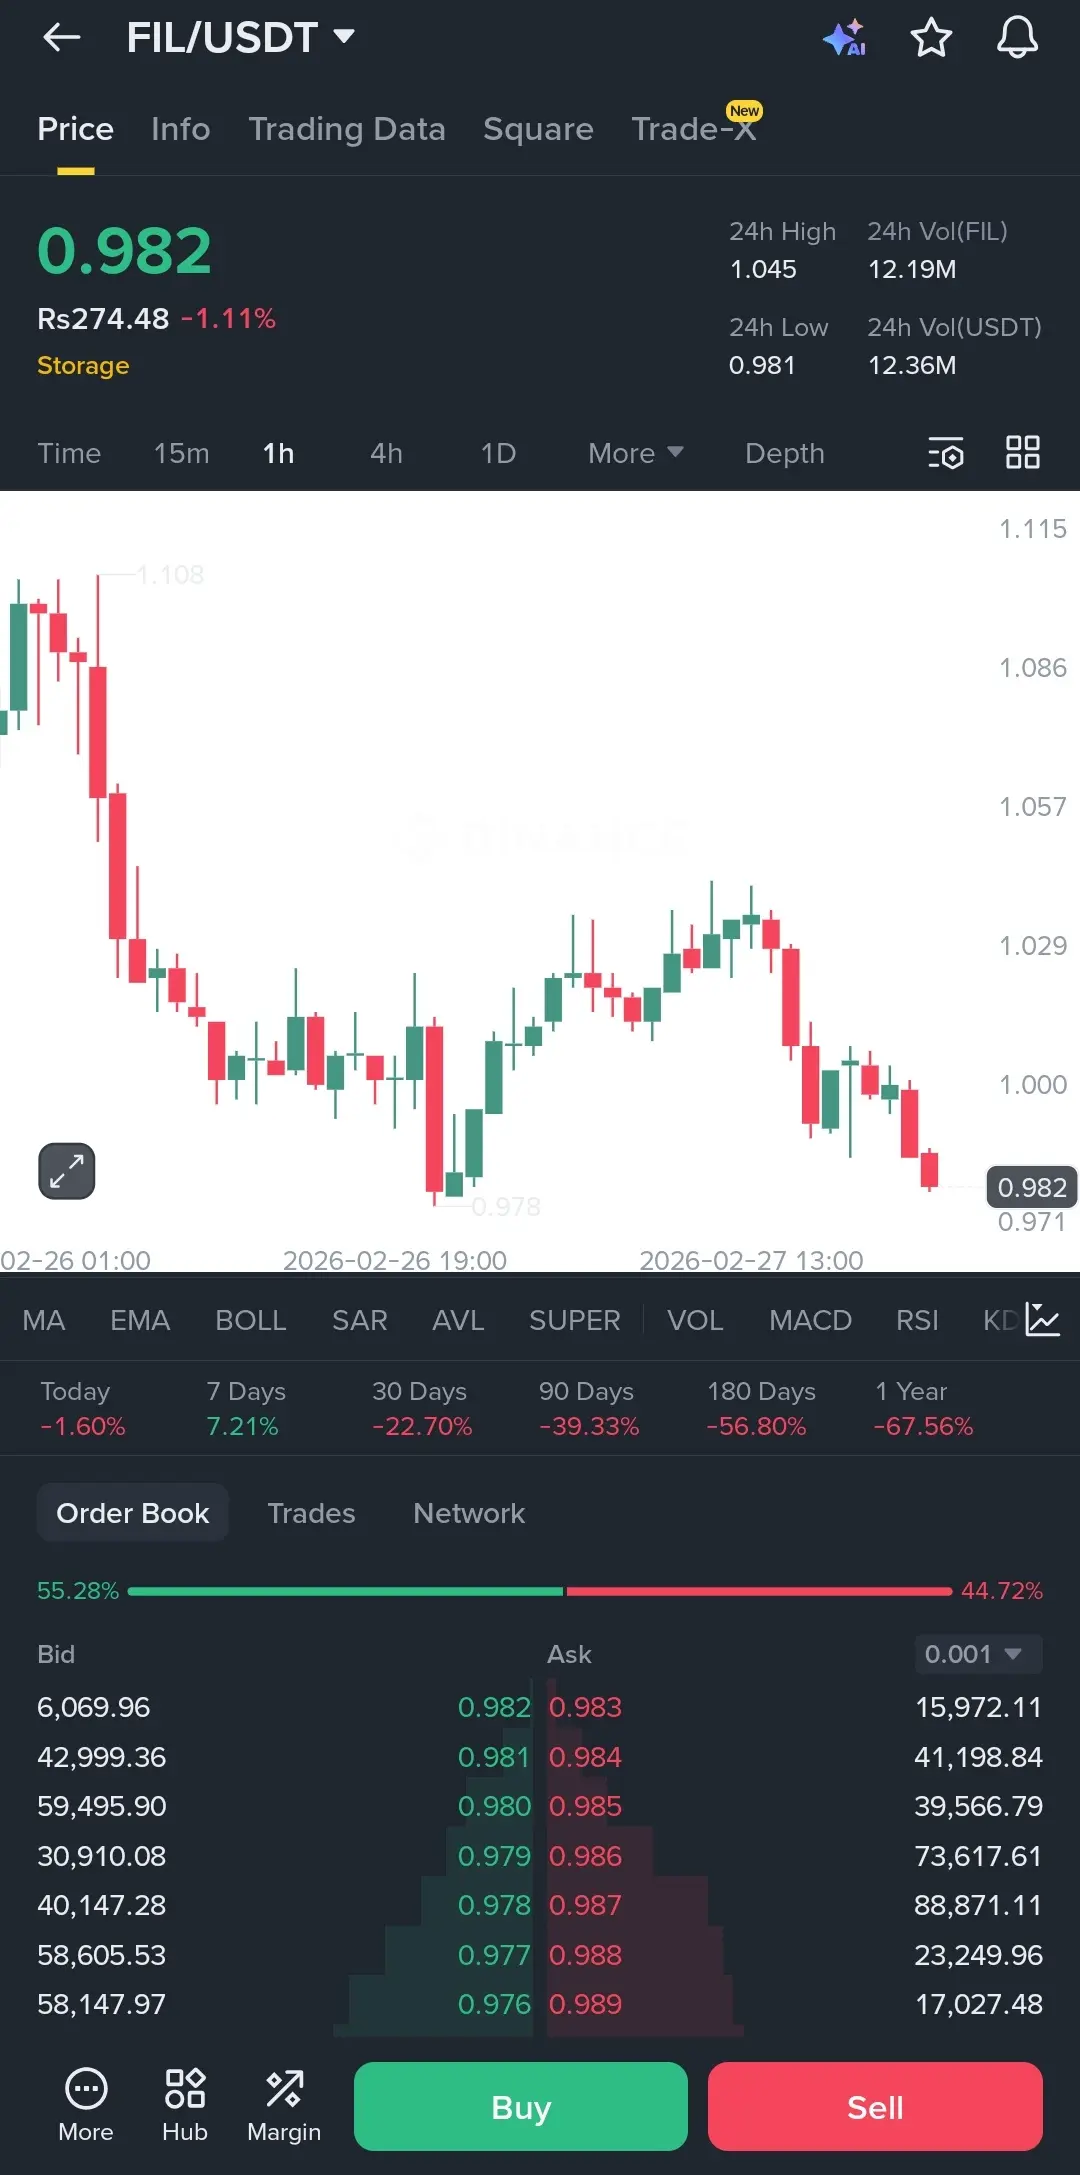
$FIL is testing everyone's patience right now.
The way we just tapped 0.981 and bounced a tiny bit shows there's still some life left here, but it's looking heavy. We’re basically sitting right on the 24h low, and looking at the hourly, that local double bottom attempt around 0.978 is the only thing standing between us and a much nastier drop.
Volume is pretty decent at 12M, but the order book is almost a 50/50 split. Usually, that means we’re about to see a big expansion move once one side gives up.
If we can't reclaim 1.00 soon, this support is going to get tired. I’m staying flat for a
FIL-1.74%

- Reward
- 1
- Comment
- Repost
- Share
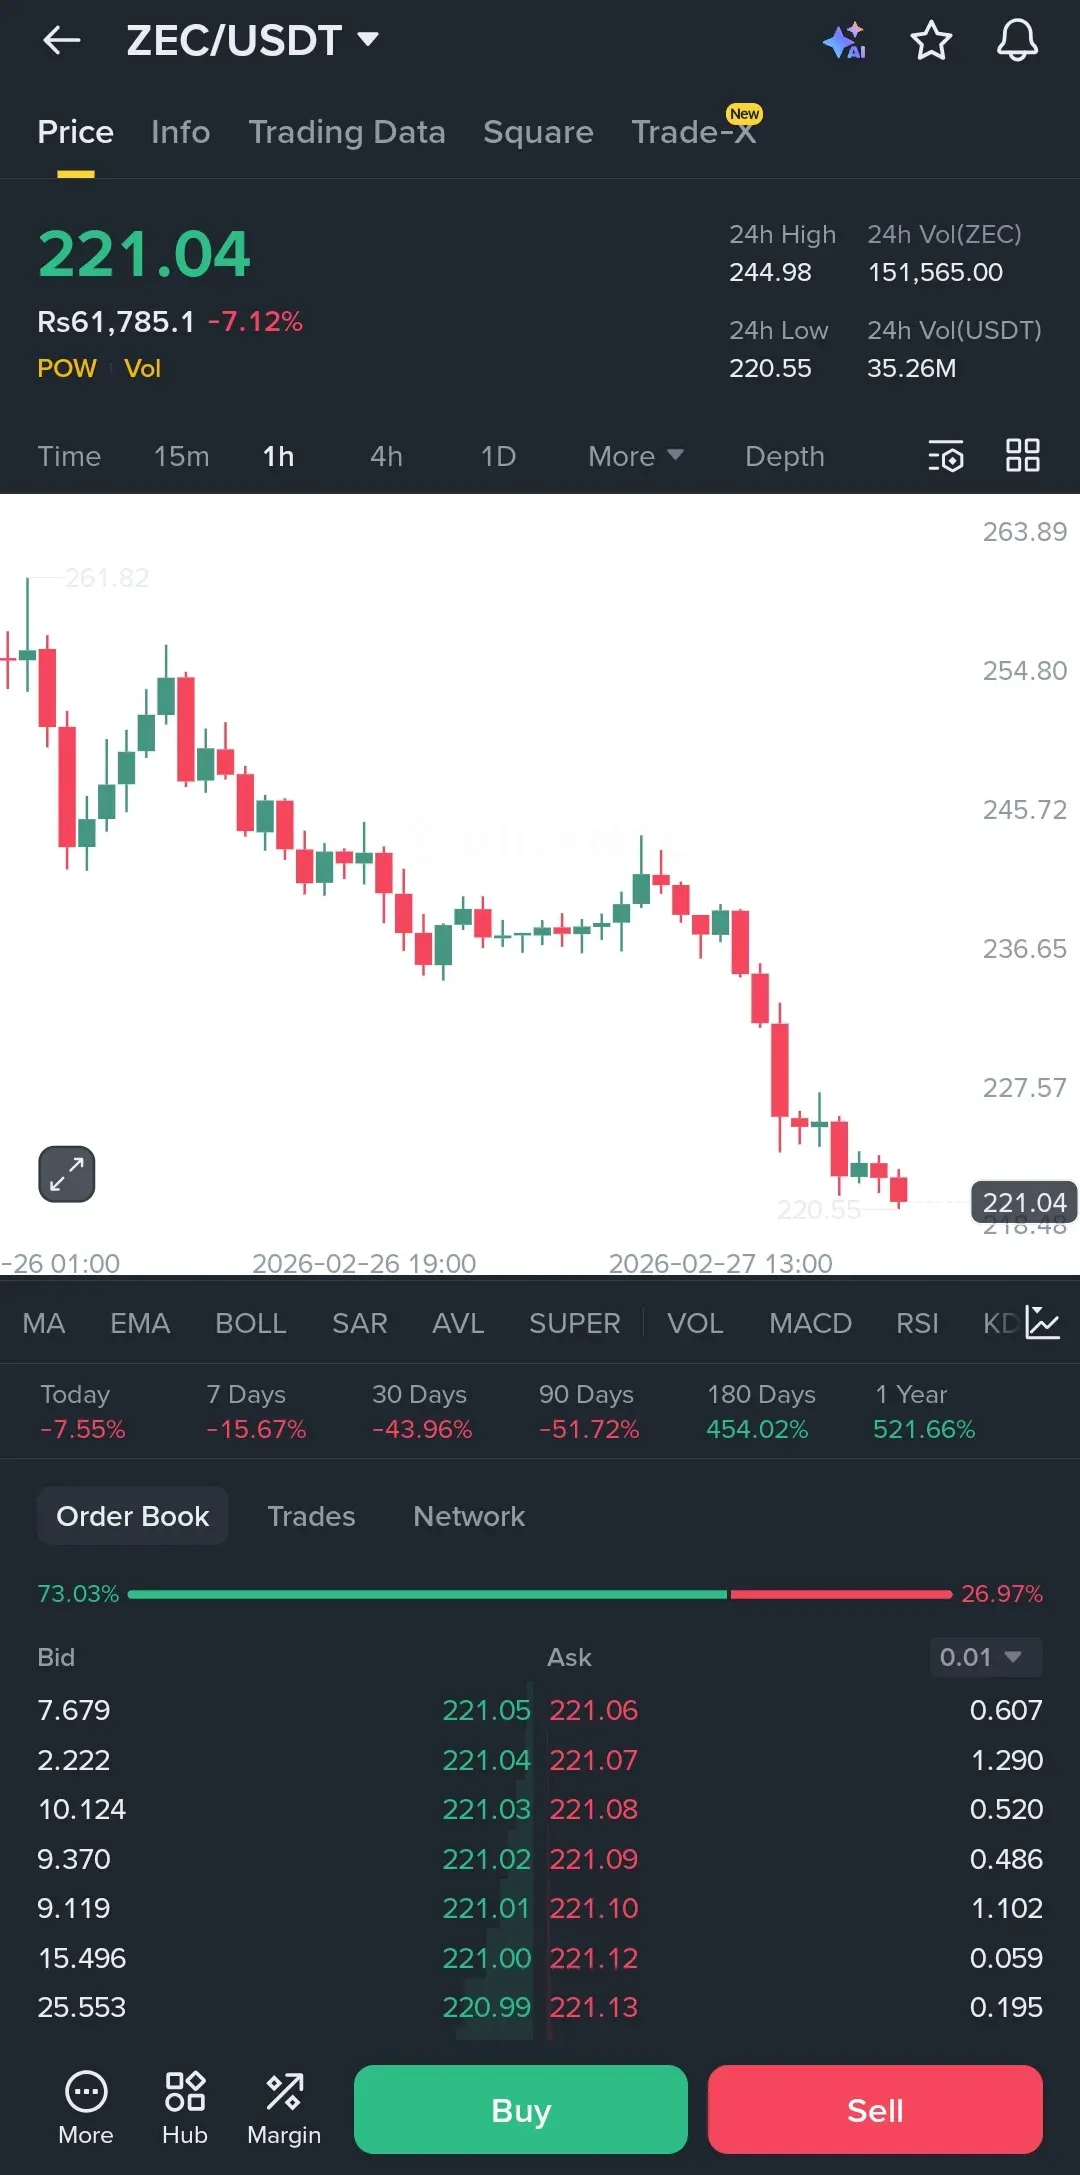
Something is definitely brewing with $ZEC right now.
The way $221 is held by a thread is actually wild. We’ve been bleeding out for the last 24 hours, and looking at that hourly chart, every single bounce is getting sold into immediately. The sellers aren’t even letting it breathe.
We just hit a 24-hour low of 220.55. If this horizontal support cracks, there’s not much structural history to catch it until we see a much deeper flush. However, the order book shows 73% of people are sitting on the big side. That’s a lot of trapped liquidity if this breaks down further.
I’m watching for a fake
ZEC-9.55%

- Reward
- 1
- Comment
- Repost
- Share
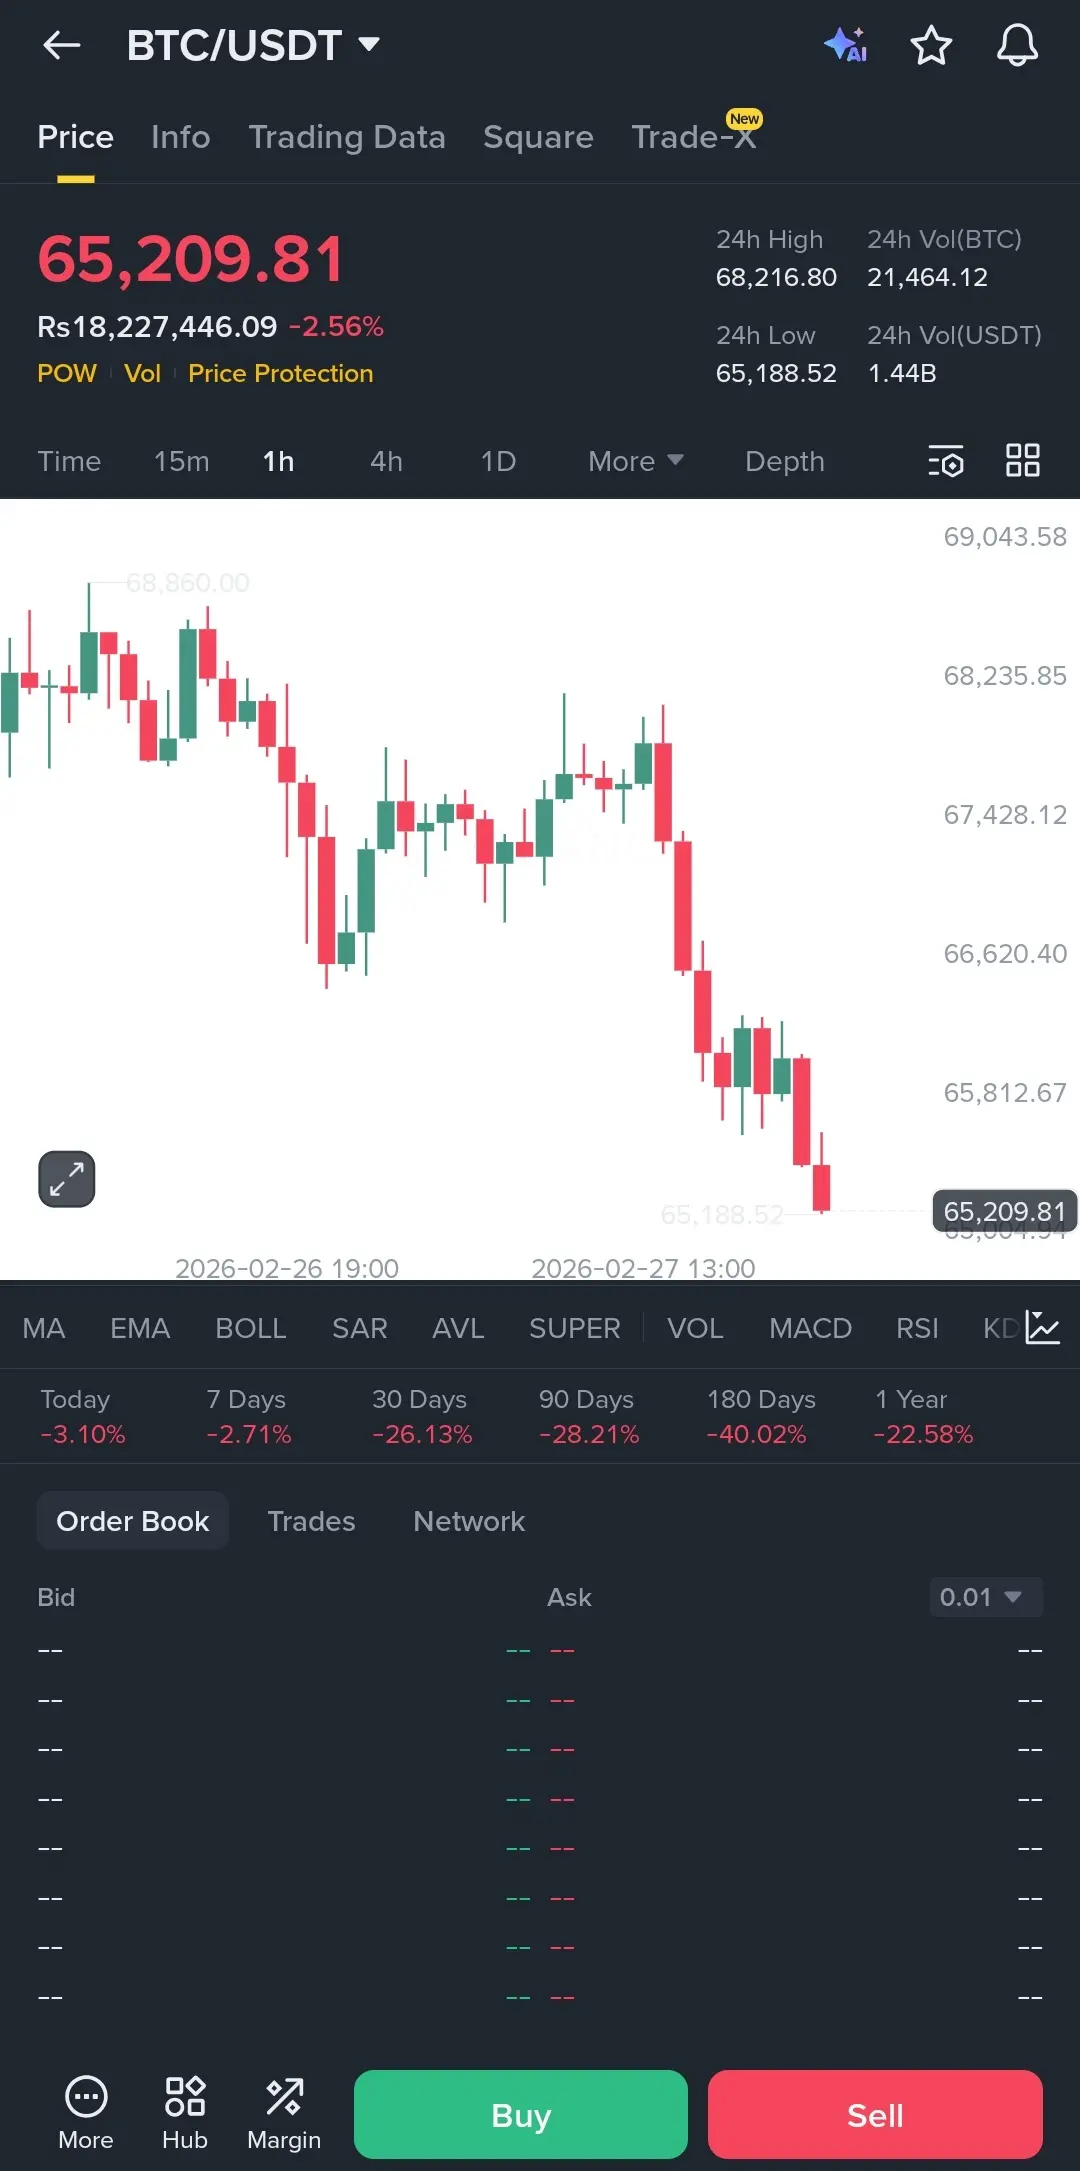
Is the king about to take a massive tumble?
$BTC is looking shaky as hell on the 1h chart. We just wicked down to 65,188 which is basically the 24h low, and the recovery is non-existent. It’s sitting right at 65,209 and every small bounce is getting sold off instantly.
We’ve got a clear series of lower highs here. If 65,000 breaks, we might see a fast flush because there’s zero momentum from the bulls right now. The 24h volume is huge at 1.44B but it’s mostly red candles.
I'm sitting on my hands for this one. I need to see a solid base form before I even think about a long, otherwise this
BTC-3.27%

- Reward
- like
- Comment
- Repost
- Share
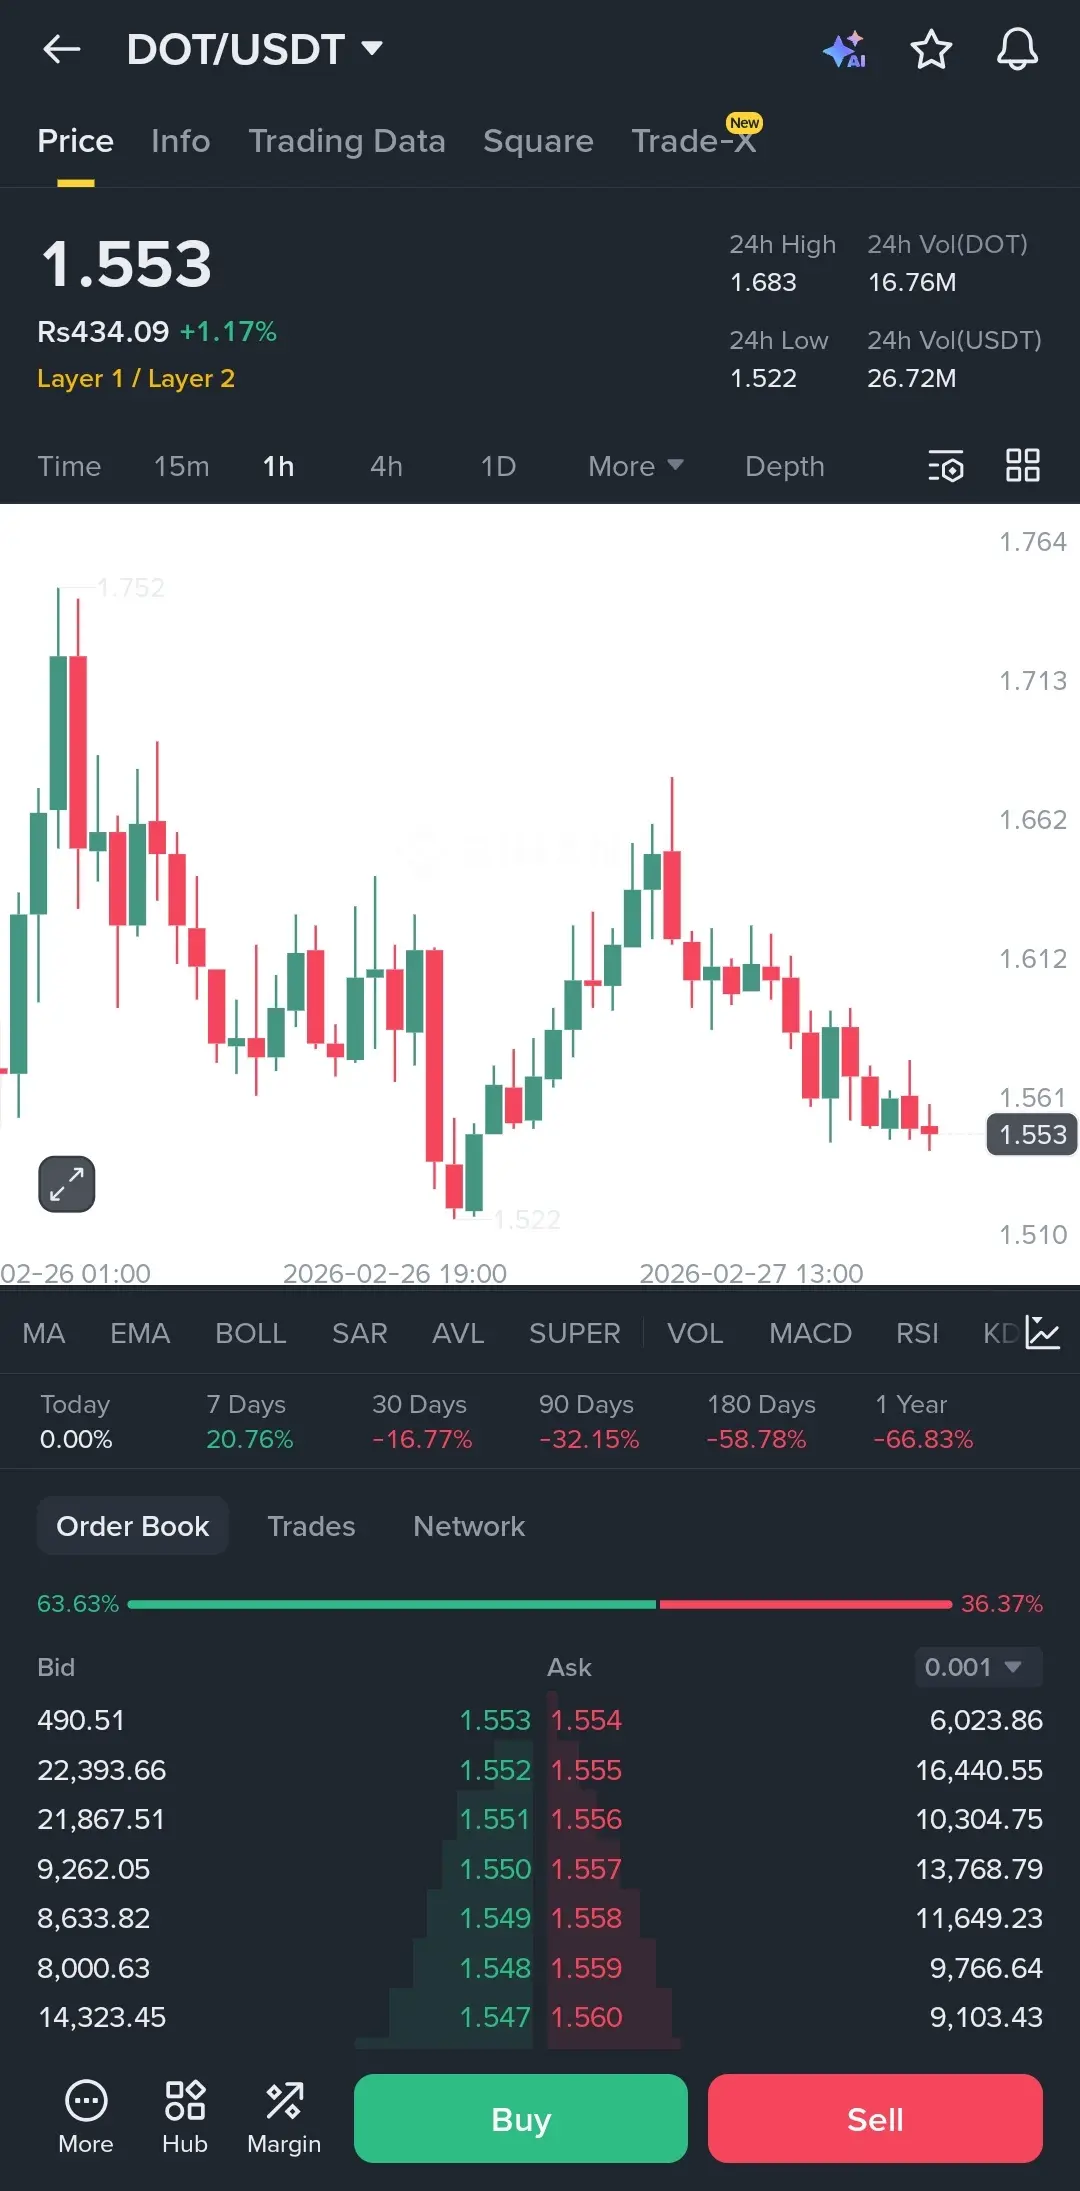
Is $DOT actually forming a trap right now?
Looking at the 1h chart, it’s hanging around 1.553 after a pretty rough rejection from that 1.660 area earlier. It’s making these lower highs that just look heavy.
The buy side in the order book is stacked at 63% which usually sounds good, but the price is barely budging. If we can't clear 1.61 soon, I’m worried we’re just consolidating before another dip to test that 1.522 support again.
Volume is looking a bit thin too. I’m staying cautious because this feels like one of those "fake out" zones where it could go either way in a heartbeat.
#JaneSt
DOT2.37%
- Reward
- like
- Comment
- Repost
- Share
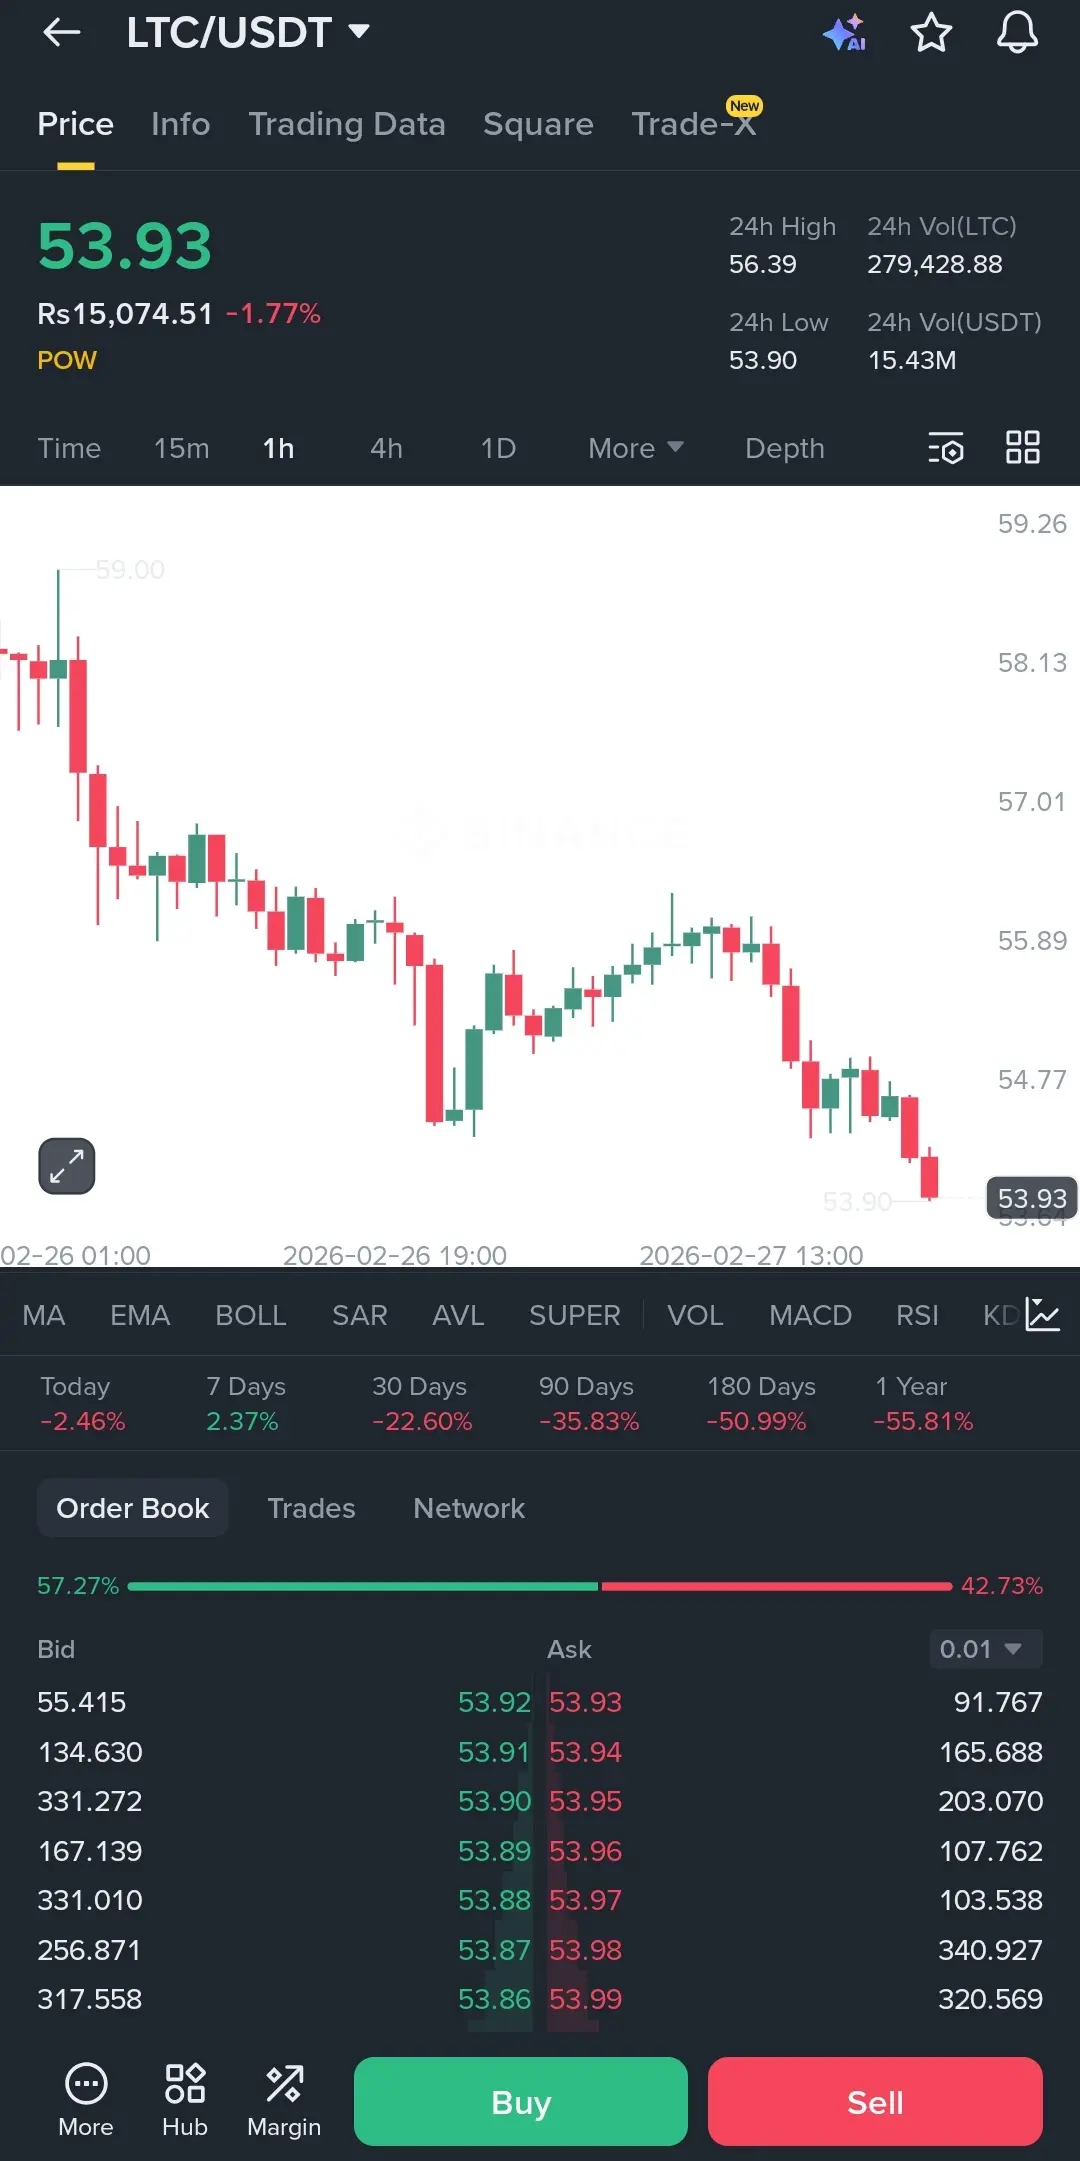
Is Litecoin finally about to cave in?
Looking at the 1h chart, $LTC is hugging the 53.90 level and it’s not looking great. We just hit a 24h low right here, and every time it tries to bounce, the sellers are right there to slap it back down.
The order book is showing more buy interest at 57%, but the price action tells a different story. If we lose this 53.90 support, there isn't much stopping a deeper slide since the momentum is clearly to the downside today.
I'm watching for a fakeout or a high volume reclaim, but right now, it’s just bleeding out.
#DeepCreationCamp
LTC-2.39%

- Reward
- like
- Comment
- Repost
- Share
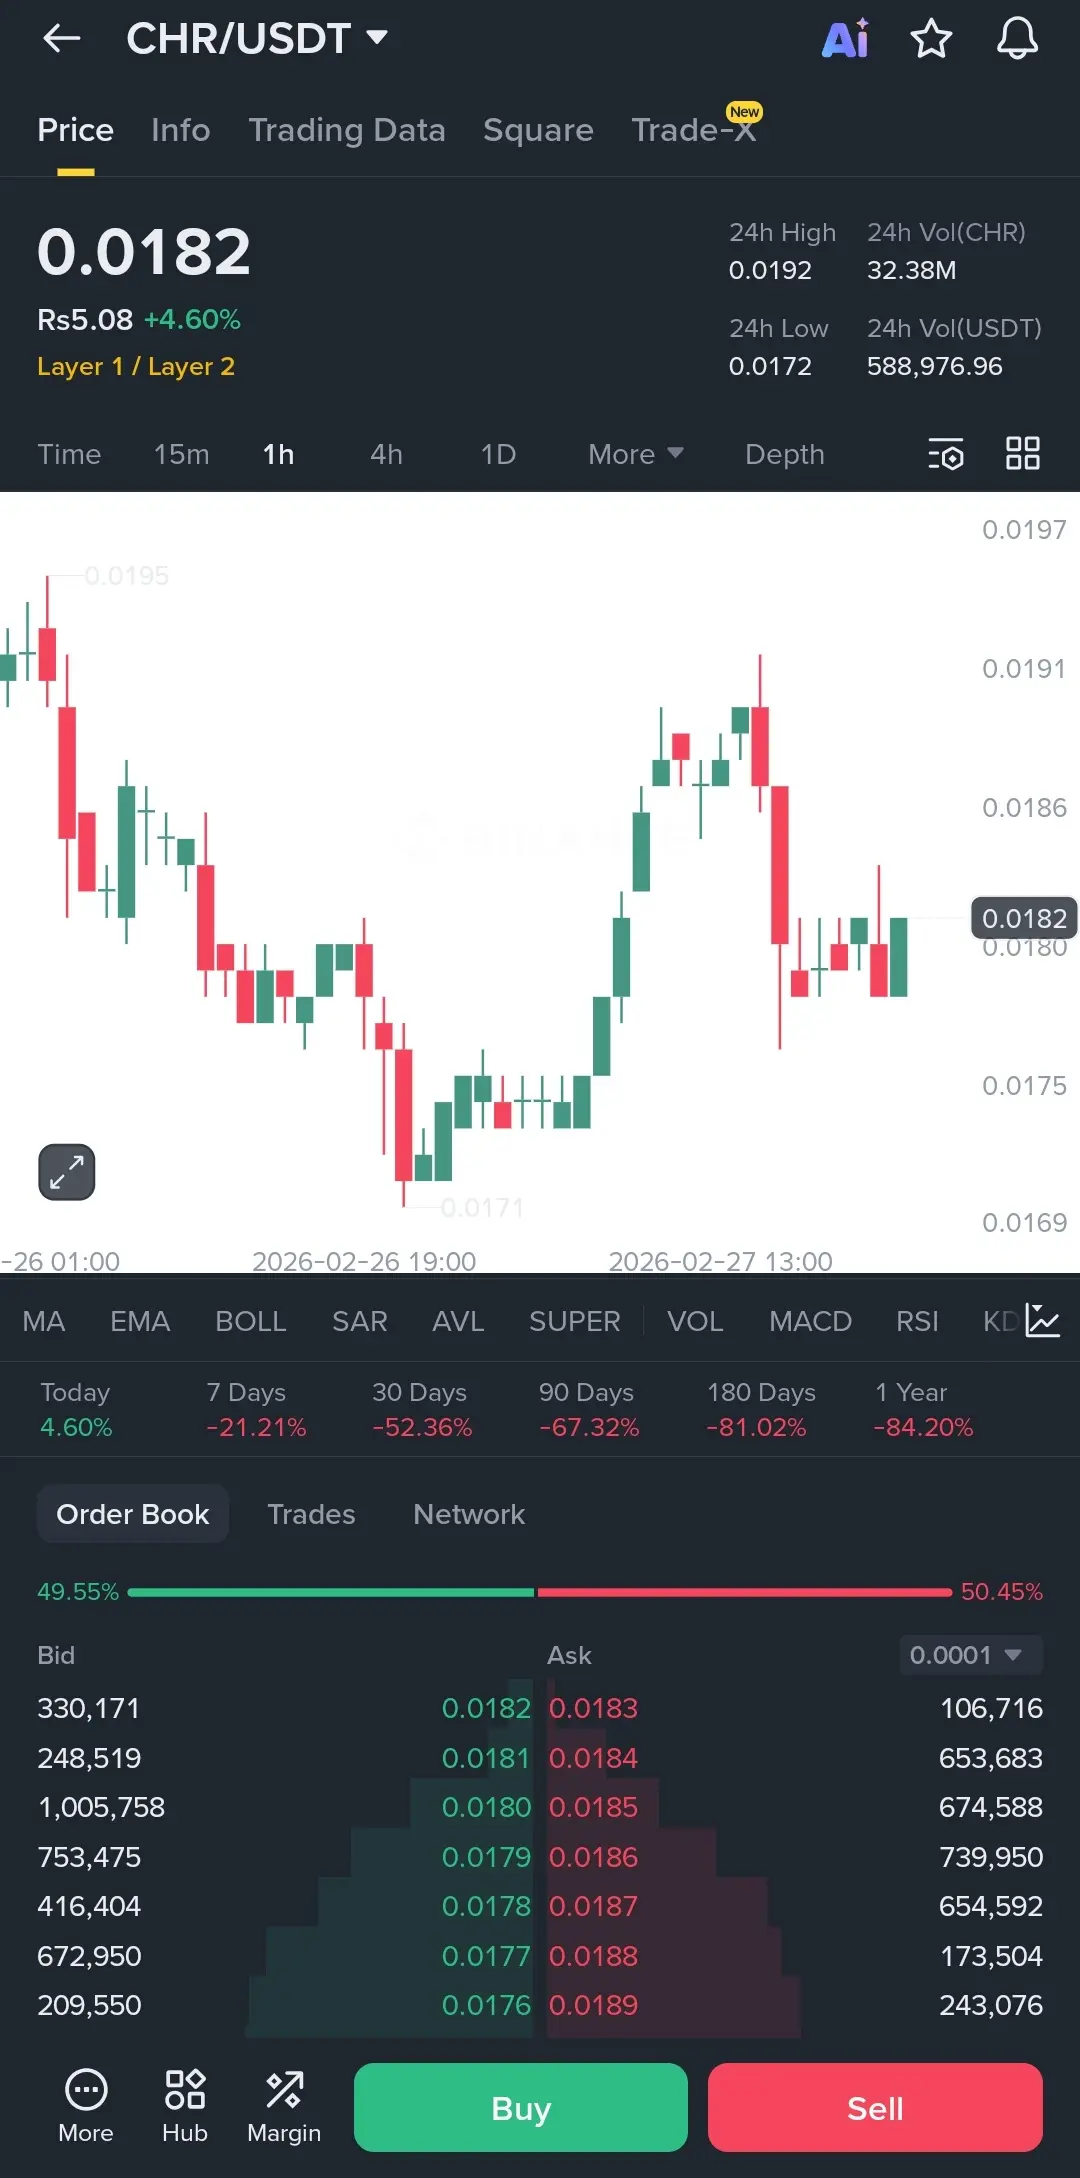
Wait, did $CHR just pull a fast one on everyone?
Looking at the 1h chart, it finally caught a bit of a bounce after that nasty dip to 0.0171. It tried to push past 0.0190 but got rejected pretty quickly. Now it’s just hovering around 0.0182.
The order book is almost a perfect 50/50 split right now. It feels like the market is holding its breath. If we can’t hold this 0.0180 area as support, we might be heading back down to test that bottom again.
I’m watching the volume closely because it’s still a bit dry. No big moves until we see some real conviction from the buyers.
#CanBitcoinReclaim$
CHR5.09%

- Reward
- 2
- Comment
- Repost
- Share
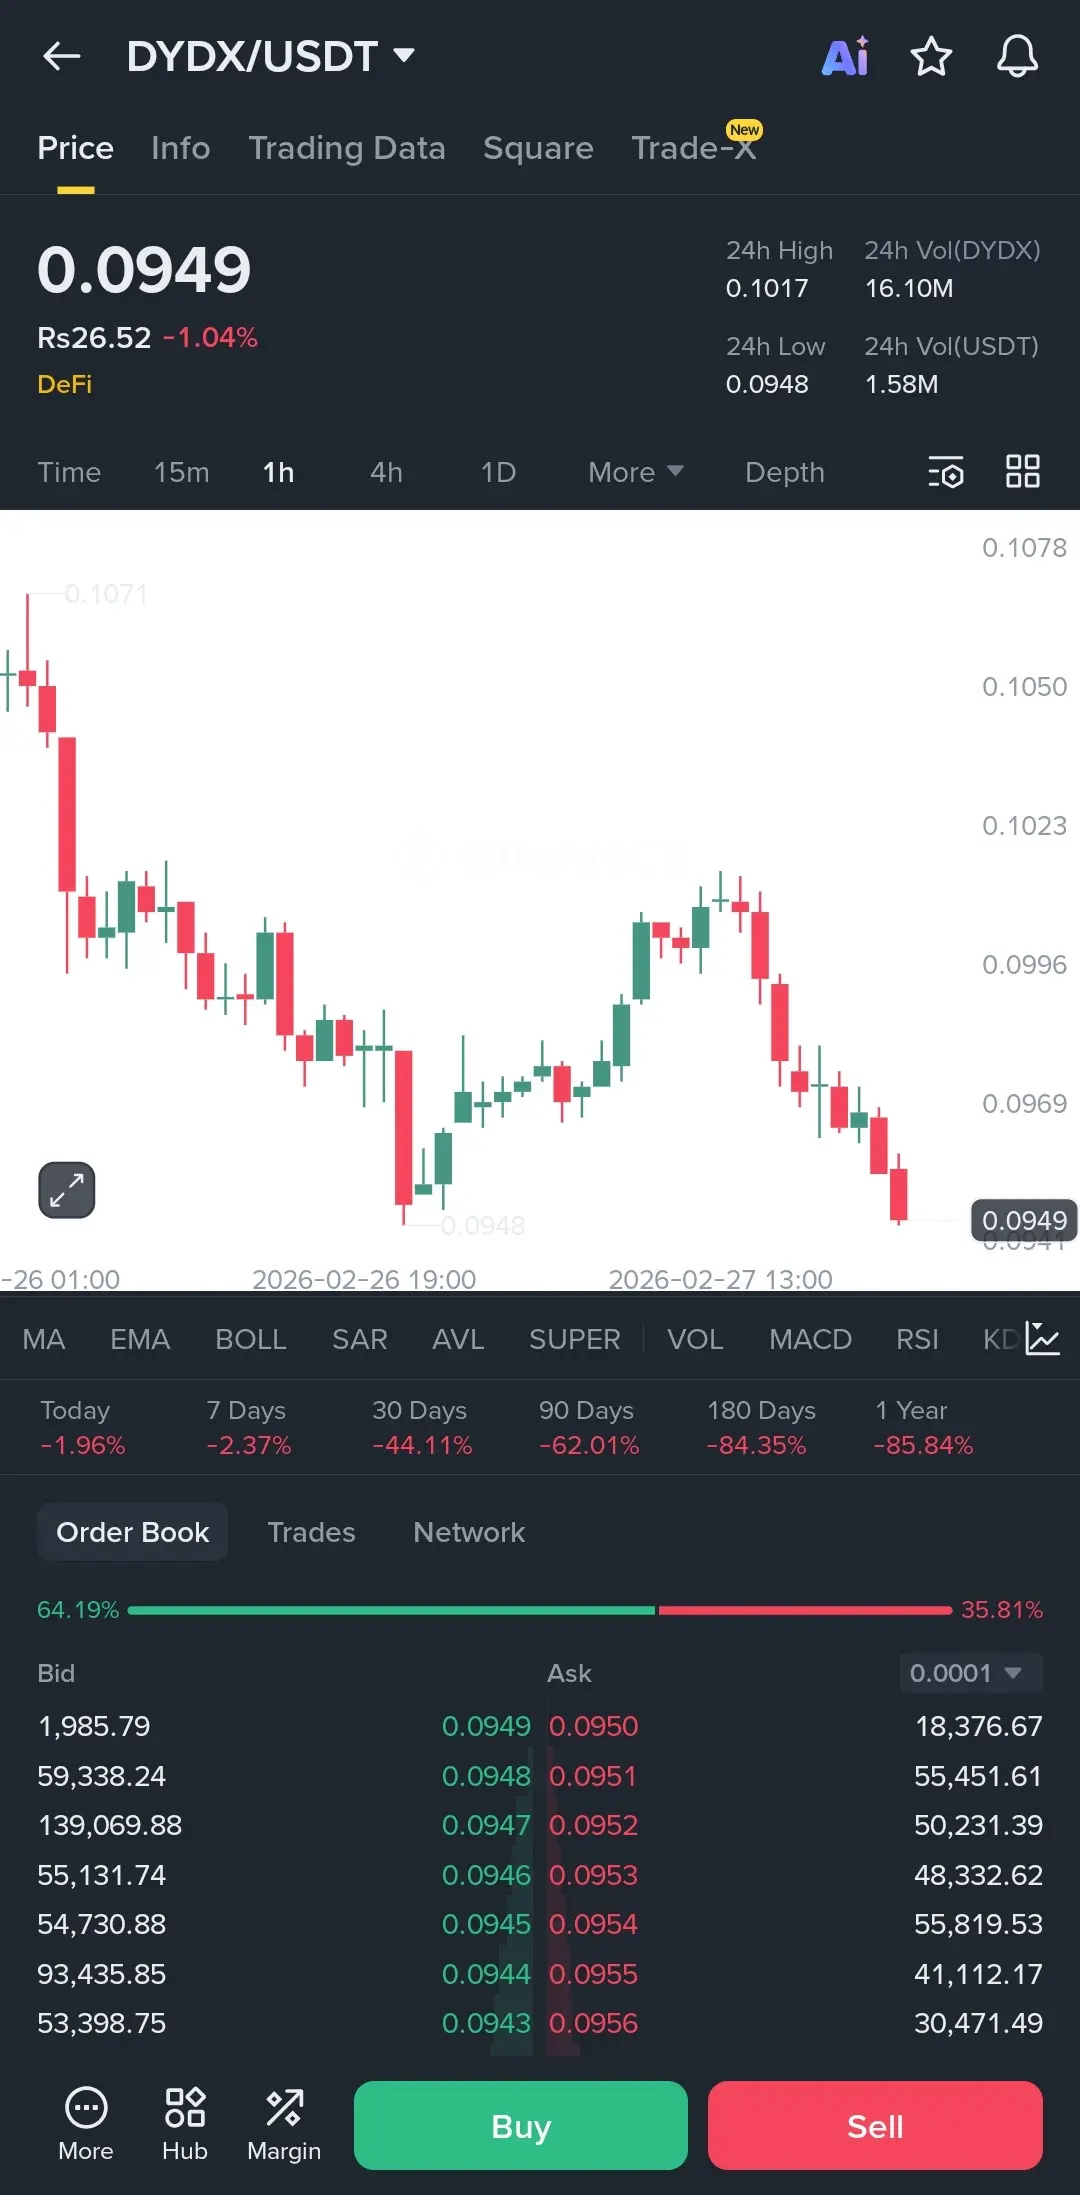
Something’s not adding up with $DYDX here.
It’s sitting right on that 0.0948 level, and the way it’s bleeding is making me nervous. Every time it tries to bounce, the sellers just hammer it back down.
If this support doesn't hold, we’re looking at a fresh leg down because the buy side looks pretty thin on the order book.
I’m staying hands off until I see a real sign of life. If we break below this, it’s going to get ugly fast.
#BuyTheDipOrWaitNow?
DYDX-2.45%

- Reward
- 1
- Comment
- Repost
- Share
Trending Topics
View More355.67K Popularity
21.44K Popularity
62.99K Popularity
15.32K Popularity
465.28K Popularity
Pin