Trade
Basic
Futures
Futures
Hundreds of contracts settled in USDT or BTC
TradFi
Gold
Trade global traditional assets with USDT in one place
Options
Hot
Trade European-style vanilla options
Unified Account
Maximize your capital efficiency
Demo Trading
Futures Kickoff
Get prepared for your futures trading
Futures Events
Participate in events to win generous rewards
Demo Trading
Use virtual funds to experience risk-free trading
Earn
Launch
CandyDrop
Collect candies to earn airdrops
Launchpool
Quick staking, earn potential new tokens
HODLer Airdrop
Hold GT and get massive airdrops for free
Launchpad
Be early to the next big token project
Alpha Points
Trade on-chain assets and enjoy airdrop rewards!
Futures Points
Earn futures points and claim airdrop rewards
Investment
Simple Earn
Earn interests with idle tokens
Auto-Invest
Auto-invest on a regular basis
Dual Investment
Buy low and sell high to take profits from price fluctuations
Soft Staking
Earn rewards with flexible staking
Crypto Loan
0 Fees
Pledge one crypto to borrow another
Lending Center
One-stop lending hub
VIP Wealth Hub
Customized wealth management empowers your assets growth
Private Wealth Management
Customized asset management to grow your digital assets
Quant Fund
Top asset management team helps you profit without hassle
Staking
Stake cryptos to earn in PoS products
Smart Leverage
New
No forced liquidation before maturity, worry-free leveraged gains
GUSD Minting
Use USDT/USDC to mint GUSD for treasury-level yields
More
# technicalanalysis
31.18K
MissCrypto
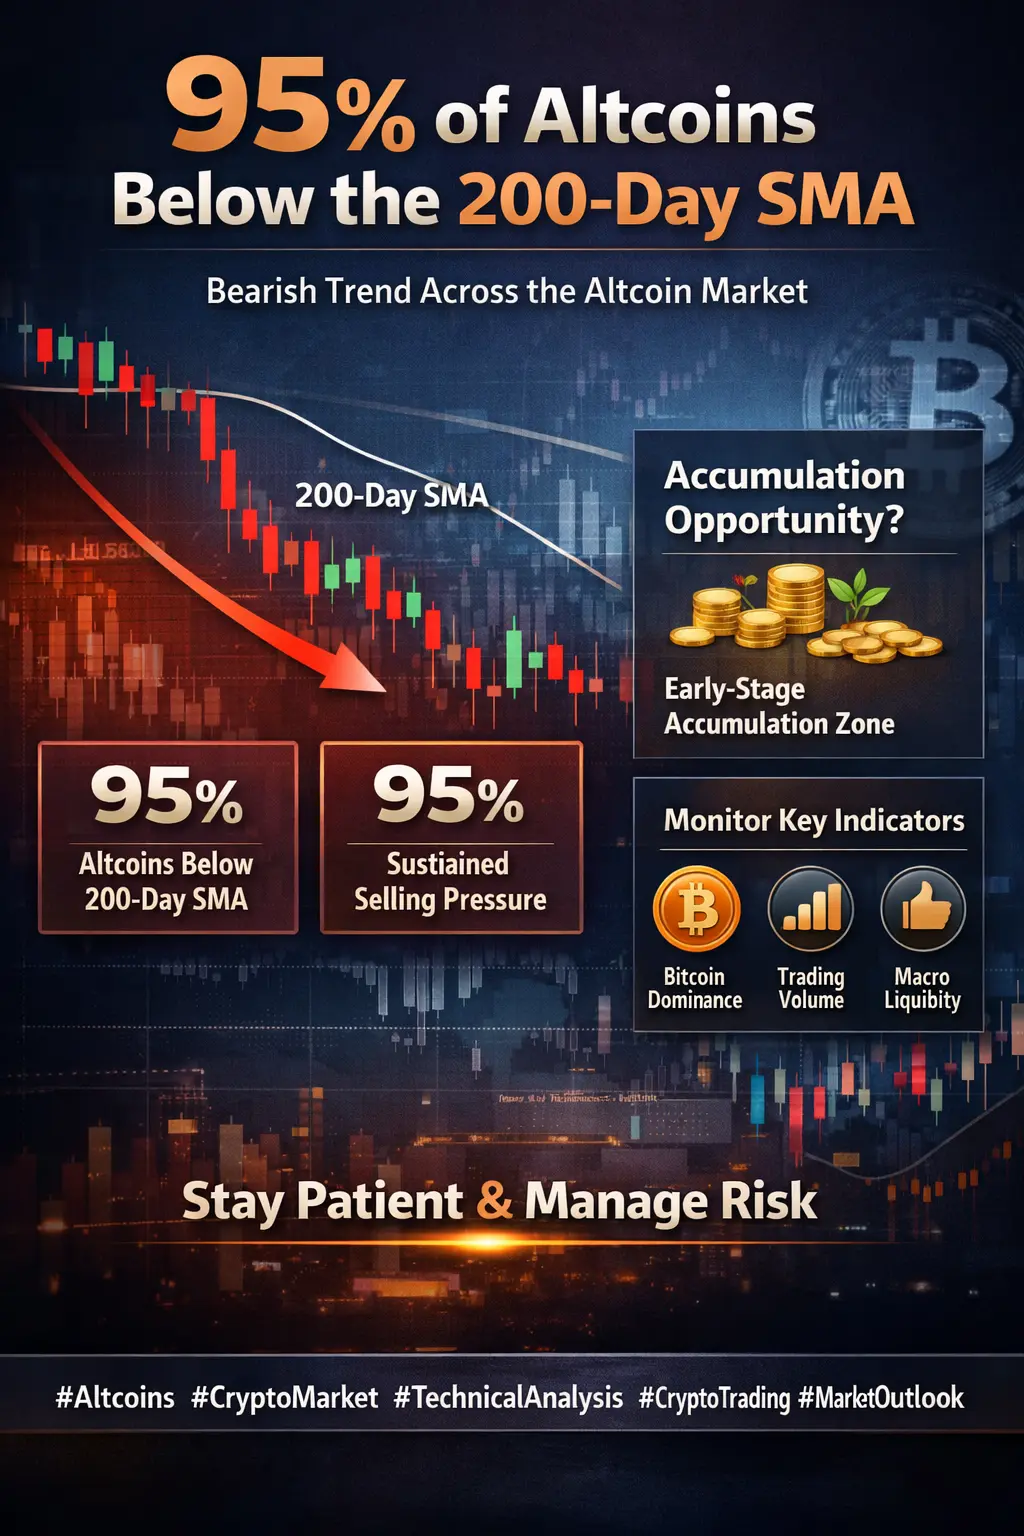
200-Day SMA
The latest market data reveals a striking trend: nearly 95% of altcoins are currently trading below their 200-day Simple Moving Average (SMA). This technical signal typically reflects a broad bearish phase across the altcoin market, indicating sustained selling pressure and weakened momentum. When such a large portion of the market remains under this key long-term indicator, it often suggests that recovery may take time and that risk management is essential for traders.
However, periods like this can also represent early-stage accumulation zones for long-term investors. Historicall
BTC-1.66%
- Reward
- 3
- 2
- Repost
- Share
HighAmbition :
:
2026 GOGOGO 👊View More
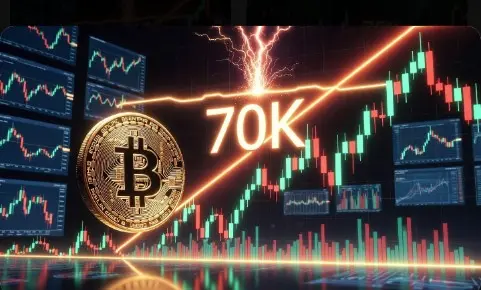
#CanBitcoinReclaim$70K?
$70K isn’t just a number — it’s a psychological and liquidity battleground. This level carries trapped shorts, breakout buyers, and institutional positioning all at once.
Here’s the real breakdown 👇
1️⃣ Market Structure Matters
On the higher timeframes (Daily / Weekly):
If Bitcoin is still holding Higher Lows, a reclaim is structurally possible.
If Lower Highs are forming near $70K, this level may act as a strong supply zone.
A true reclaim isn’t just a wick above — it requires a strong close above resistance with continuation volume.
2️⃣ Liquidity Above $70K
Above th
BTC-1.66%

- Reward
- 7
- 4
- Repost
- Share
SheenCrypto:
2026 GOGOGO 👊View More
#CanBitcoinReclaim$70K? The Weekend Showdown ⚔️📈
As of Feb 28, 2026, Bitcoin is trading near $66,000, down roughly 2% in the last 24 hours as markets digest this week’s options expiry volatility.
The $70K level is still in play — but it’s not going to be easy.
📊 The Technical Battlefield
Resistance Zone:
$68,000–$69,800 remains a heavy liquidity cluster. Multiple rejections here show active supply.
Weekly Close Focus:
The 200-week EMA near $68,300 is a critical structural level. A strong close above it would significantly improve breakout probability.
Support Structure:
$65,200 is the short-
BTC-1.66%


- Reward
- 6
- 16
- Repost
- Share
SheenCrypto:
LFG 🔥View More
$JCT – Falling Wedge Breakout + Retest
Price broke out of the falling wedge.
Now we’re seeing the retest.
This is where weak hands hesitate…
And smart money watches confirmation.
A clean breakout + successful retest
= structure shift
= momentum potential
No hype.
No noise.
Just structure.
Good charts never lie.
Only emotions do.
#JCT #TechnicalAnalysis #Breakout #PriceAction
- Reward
- like
- Comment
- Repost
- Share
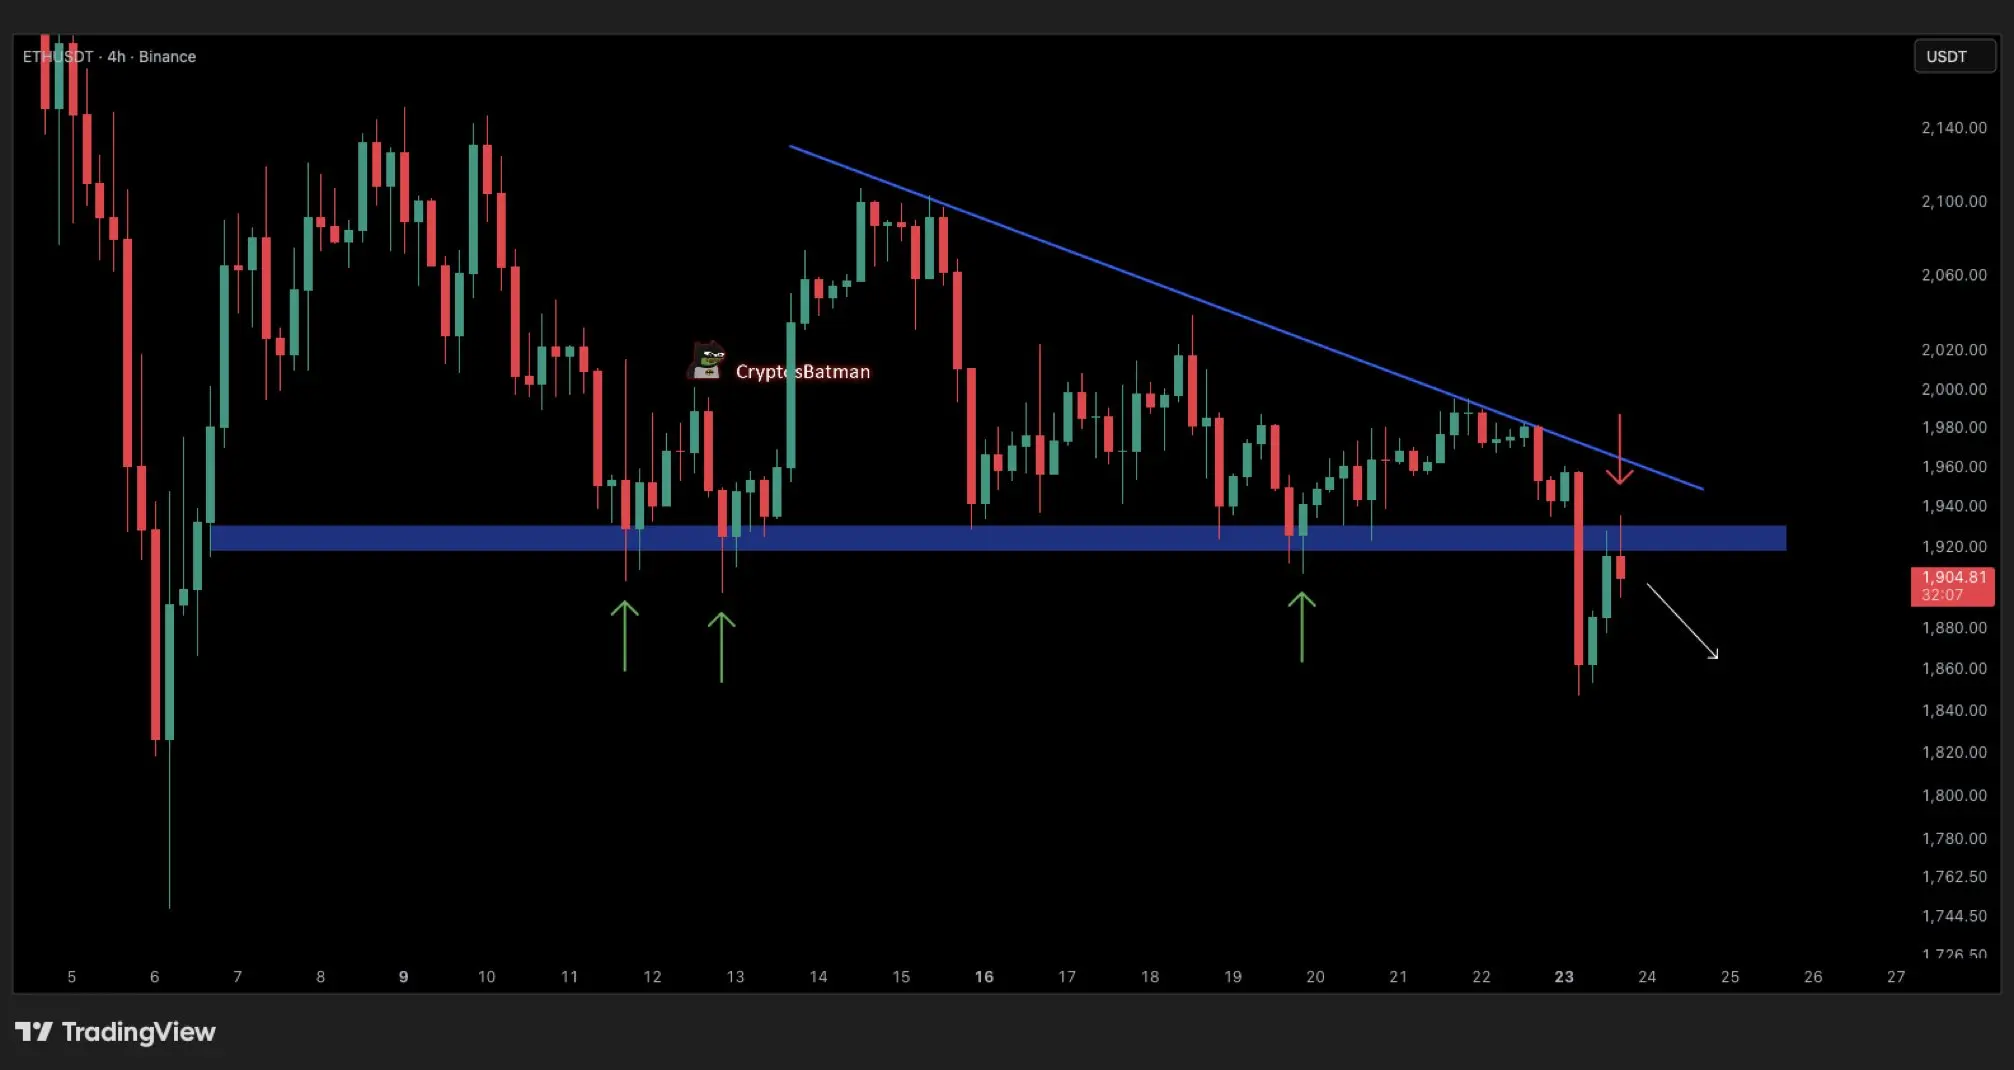
$ETH
Structure is speaking clearly.
Descending trendline intact.
Multiple lower highs.
Major support finally cracked after repeated tests.
Now we’re seeing a classic S/R flip retest.
If this level rejects → momentum likely expands toward the 1.85k liquidity pocket.
If bulls reclaim and close back above the zone → breakdown turns into deviation.
Bias remains bearish below resistance.
React. Don’t predict.
#ETH #Ethereum #Crypto #CryptoTrading #TechnicalAnalysis
ETH-2.6%
- Reward
- like
- Comment
- Repost
- Share
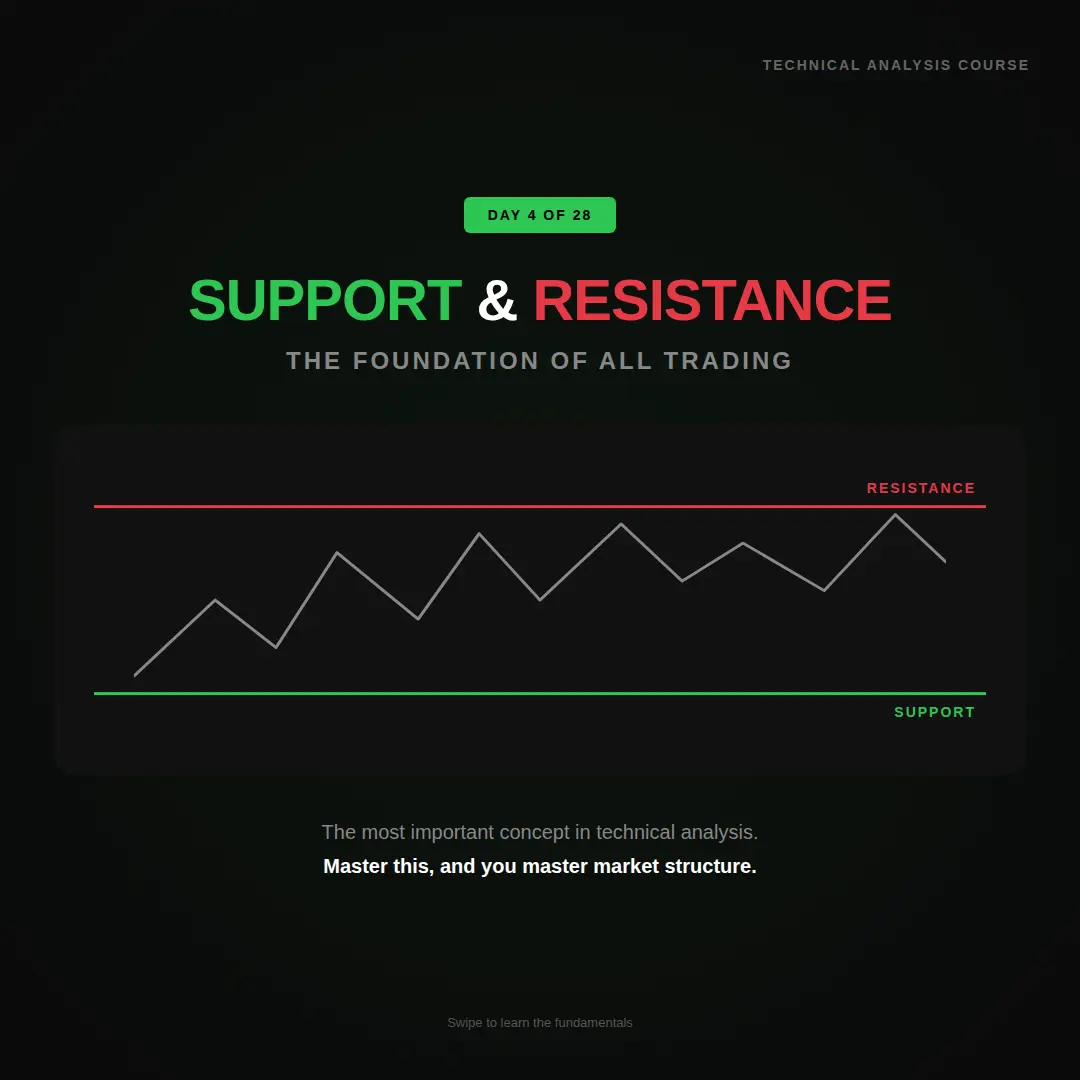
TECHNICAL ANALYSIS MASTERY - DAY 4: SUPPORT & RESISTANCE
The Foundation of All Trading
The Most Important Concept In Technical Analysis.
Master This, And You Master Market Structure.
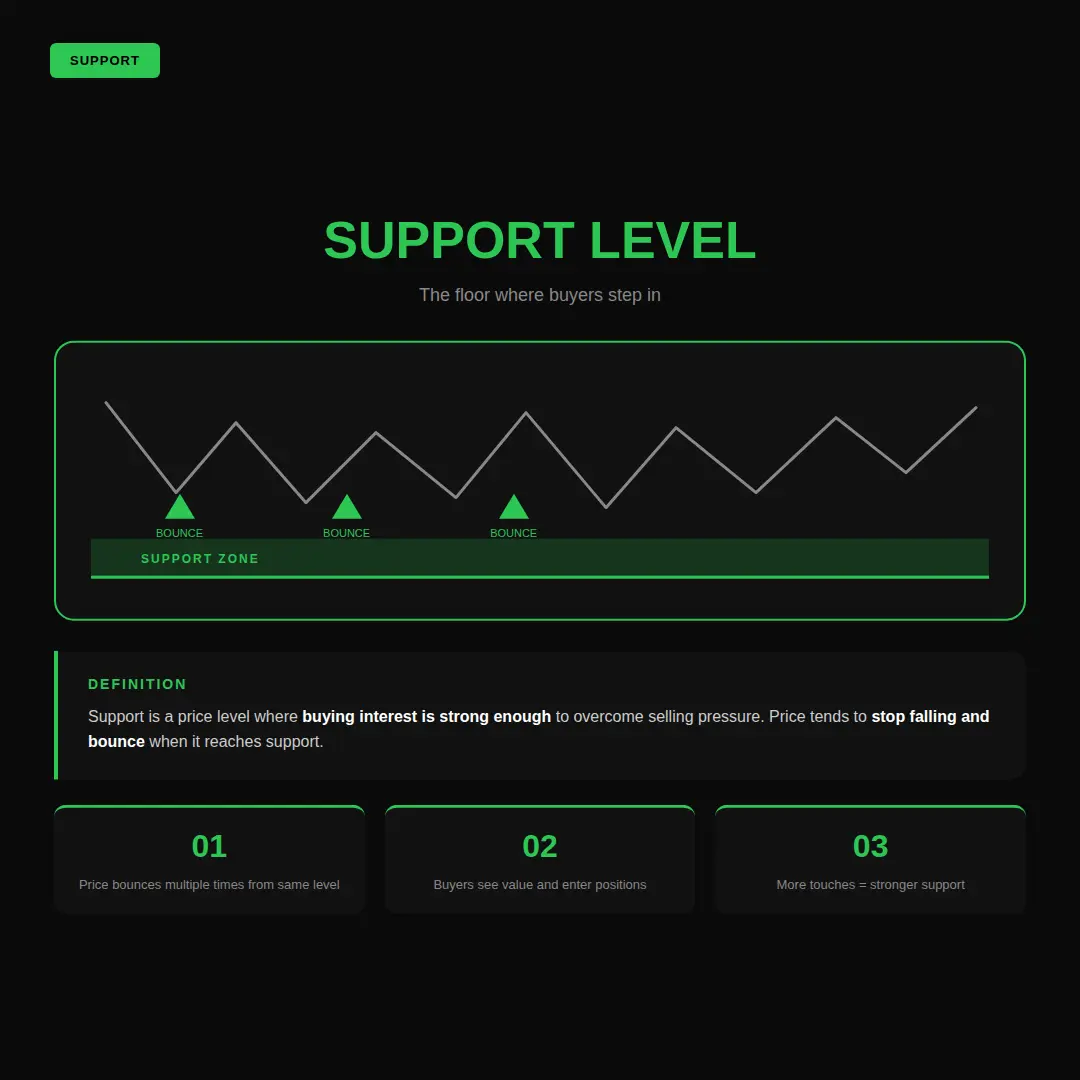
SUPPORT LEVEL
The Floor Where Buyers Step in.
DEFINITION:
Support Is A Price Level Where Buying Interest Is Strong Enough To Overcome Selling Pressure. Price Tends To Stop Falling And Bounce When It Reaches Support.
KEY POINTS:
1️⃣ Price Bounces Multiple Times From Same Level
2️⃣ Buyers See Value And Enter Positions
3️⃣ More Touches = Stronger Support
RESISTANCE LEVEL
The Ceiling Where Sellers Step in.
DEFINITION
The Foundation of All Trading
The Most Important Concept In Technical Analysis.
Master This, And You Master Market Structure.
SUPPORT LEVEL
The Floor Where Buyers Step in.
DEFINITION:
Support Is A Price Level Where Buying Interest Is Strong Enough To Overcome Selling Pressure. Price Tends To Stop Falling And Bounce When It Reaches Support.
KEY POINTS:
1️⃣ Price Bounces Multiple Times From Same Level
2️⃣ Buyers See Value And Enter Positions
3️⃣ More Touches = Stronger Support
RESISTANCE LEVEL
The Ceiling Where Sellers Step in.
DEFINITION


- Reward
- 2
- Comment
- Repost
- Share
**$2000 Breached. Bears in Full Control.**
After a brief consolidation between $2150 and $1740, #Ethereum has cracked below the psychological $2K level again.
Currently trading at **$1964**.
**The Bearish Case:**
🔻 CMP below all key EMAs (55, 200, 365)
🔻 CCI remains negative at -45
🔻 ADX showing weak momentum (10.4) – market waiting for a direction, but structure leans down.
**The Strategy:**
🟥 Sell rallies into resistance.
🎯 Key Sell Zone: **$2068–$2070**
🛑 Stop Loss: **$2200**
✅ Targets: **$1750 / $1500**
A move above **$2150** is needed to invalidate the bearish view. Until then, upsi
ETH-2.6%
- Reward
- 2
- 1
- Repost
- Share
BTC1iqbal:
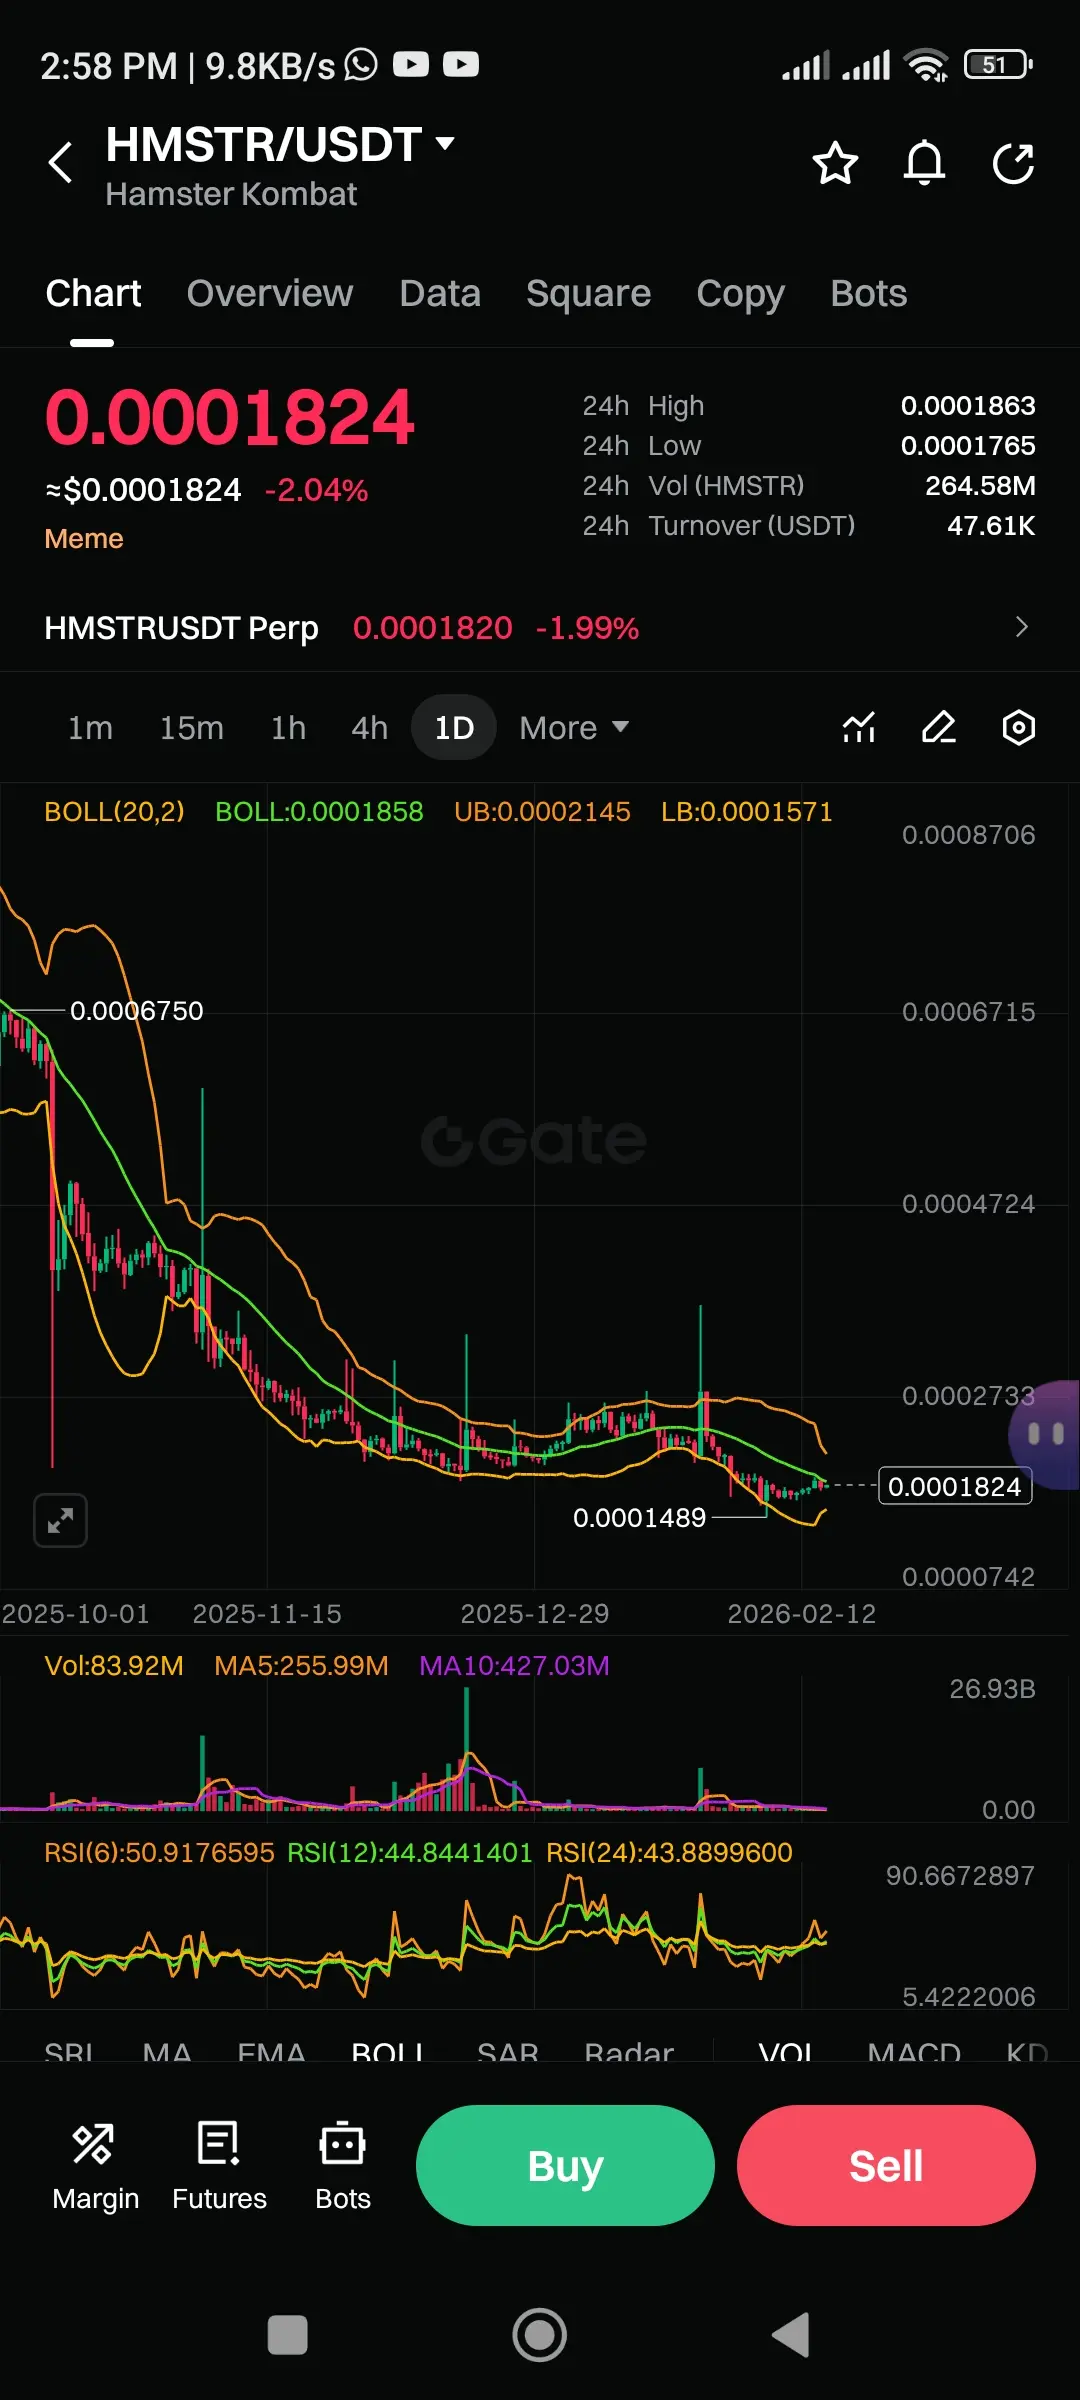
note that🐹 $HMSTR /USDT: Hanging On But Is a Turn Coming?
Let's be real HMSTR has had a rough few months. The chart tells the story clearly: a steep slide from 0.0006750 all the way down to where we are today at 0.0001824. That's a painful drop. But here's the thing the way a coin falls matters just as much as the fall itself. And right now, there are a few quiet signals worth watching.
Where does price stand today?
HMSTR is trading at 0.0001824, down about 2% on the day. It's been bouncing between a 24-hour low of 0.0001765 and a high of 0.0001863 a pretty tight range. That kind of sideways moveme
HMSTR-6.01%
- Reward
- 2
- Comment
- Repost
- Share
$PI "Pi Network is officially in its 'Momentum Reload' phase! After smashing the $0.20 barrier, the RSI has successfully cooled down from overbought levels, giving the chart room to breathe. This healthy consolidation is turning previous resistance into a rock-solid floor. With the RSI reset and volume stabilizing, we are now primed for the next major leg up. The target is locked: $0.25 is the next destination. Get ready for the quarter-dollar rally! 📈🔋 #PiNetwork #TechnicalAnalysis #RSI"
PI-1.41%
- Reward
- 2
- Comment
- Repost
- Share
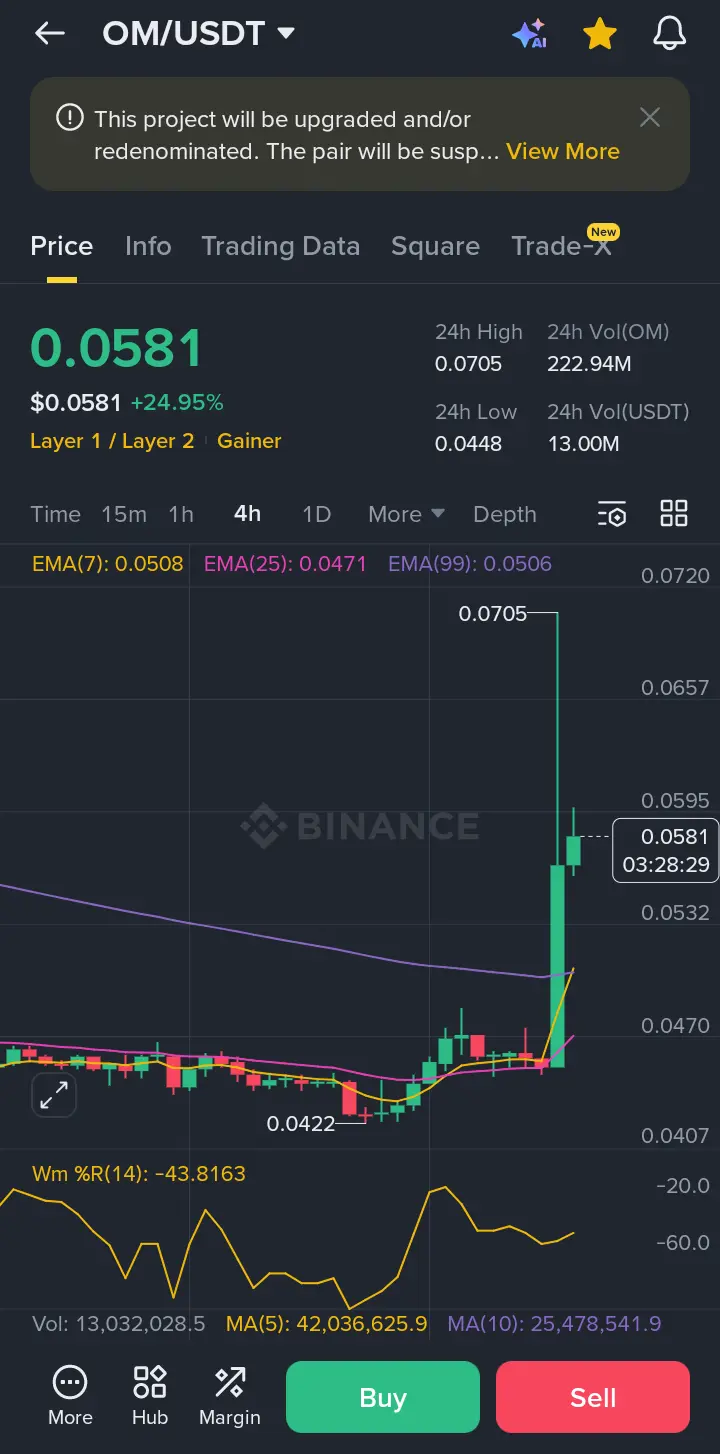
📊 OM/USDT – Momentum Breakout & Technical Outlook (4H)
Current Price: ~$0.0581
24H Change: +24%
Context: Strong volatility expansion after prolonged consolidation
🔍 Market Structure
OM spent a significant period in range-bound accumulation, followed by a high-momentum breakout.
Price has now expanded well above EMA(7), EMA(25), and EMA(99), confirming a trend shift to bullish on the 4H timeframe.
The impulsive candle suggests aggressive participation, often seen at the start of a new directional move.
📈 Momentum & Indicators
Williams %R (~ −44):
Momentum is neutral-to-strong, not yet overbo
OM5.9%
- Reward
- like
- Comment
- Repost
- Share
Load More
Join 40M users in our growing community
⚡️ Join 40M users in the crypto craze discussion
💬 Engage with your favorite top creators
👍 See what interests you
Trending Topics
42.46M Popularity
151.22K Popularity
97.65K Popularity
1.66M Popularity
494.79K Popularity
9.39K Popularity
8.11K Popularity
21.74K Popularity
4.61K Popularity
366.43K Popularity
45.72K Popularity
103.2K Popularity
17.61K Popularity
70.63K Popularity
8.26K Popularity
News
View MoreIranian Foreign Minister: Iran does not have the capability to strike the U.S. mainland and will not develop missiles capable of targeting the United States.
25 m
Newly Created Wallet Opens Leveraged Long Positions on SILVER and GOLD Tokens
27 m
Data shows: You need to hold Bitcoin for at least three years to avoid losses
36 m
Polymarket users bet that the US and Israel would not strike Iran, and after earning over $2 million in two months, they experienced a single-day loss of $6.5 million
36 m
BTC breaks through 65,000 USDT
1 h
Pin