AR vs FLOW: Exploring the Future of Immersive Technologies in Retail

Introduction: AR vs FLOW Investment Comparison
In the cryptocurrency market, AR vs FLOW comparison has always been a topic that investors cannot avoid. The two not only have significant differences in market cap ranking, application scenarios, and price performance, but also represent different positioning of crypto assets.
Arweave (AR): Since its launch in 2018, it has gained market recognition for its blockchain-based permanent storage solution.
Flow (FLOW): Introduced in 2020, it has been hailed as a fast, decentralized, and developer-friendly blockchain designed for the next generation of apps, games, and digital assets.
This article will comprehensively analyze the investment value comparison between AR and FLOW, focusing on historical price trends, supply mechanisms, institutional adoption, technical ecosystems, and future predictions, and attempt to answer the question that investors are most concerned about:
"Which is the better buy right now?"
I. Price History Comparison and Current Market Status
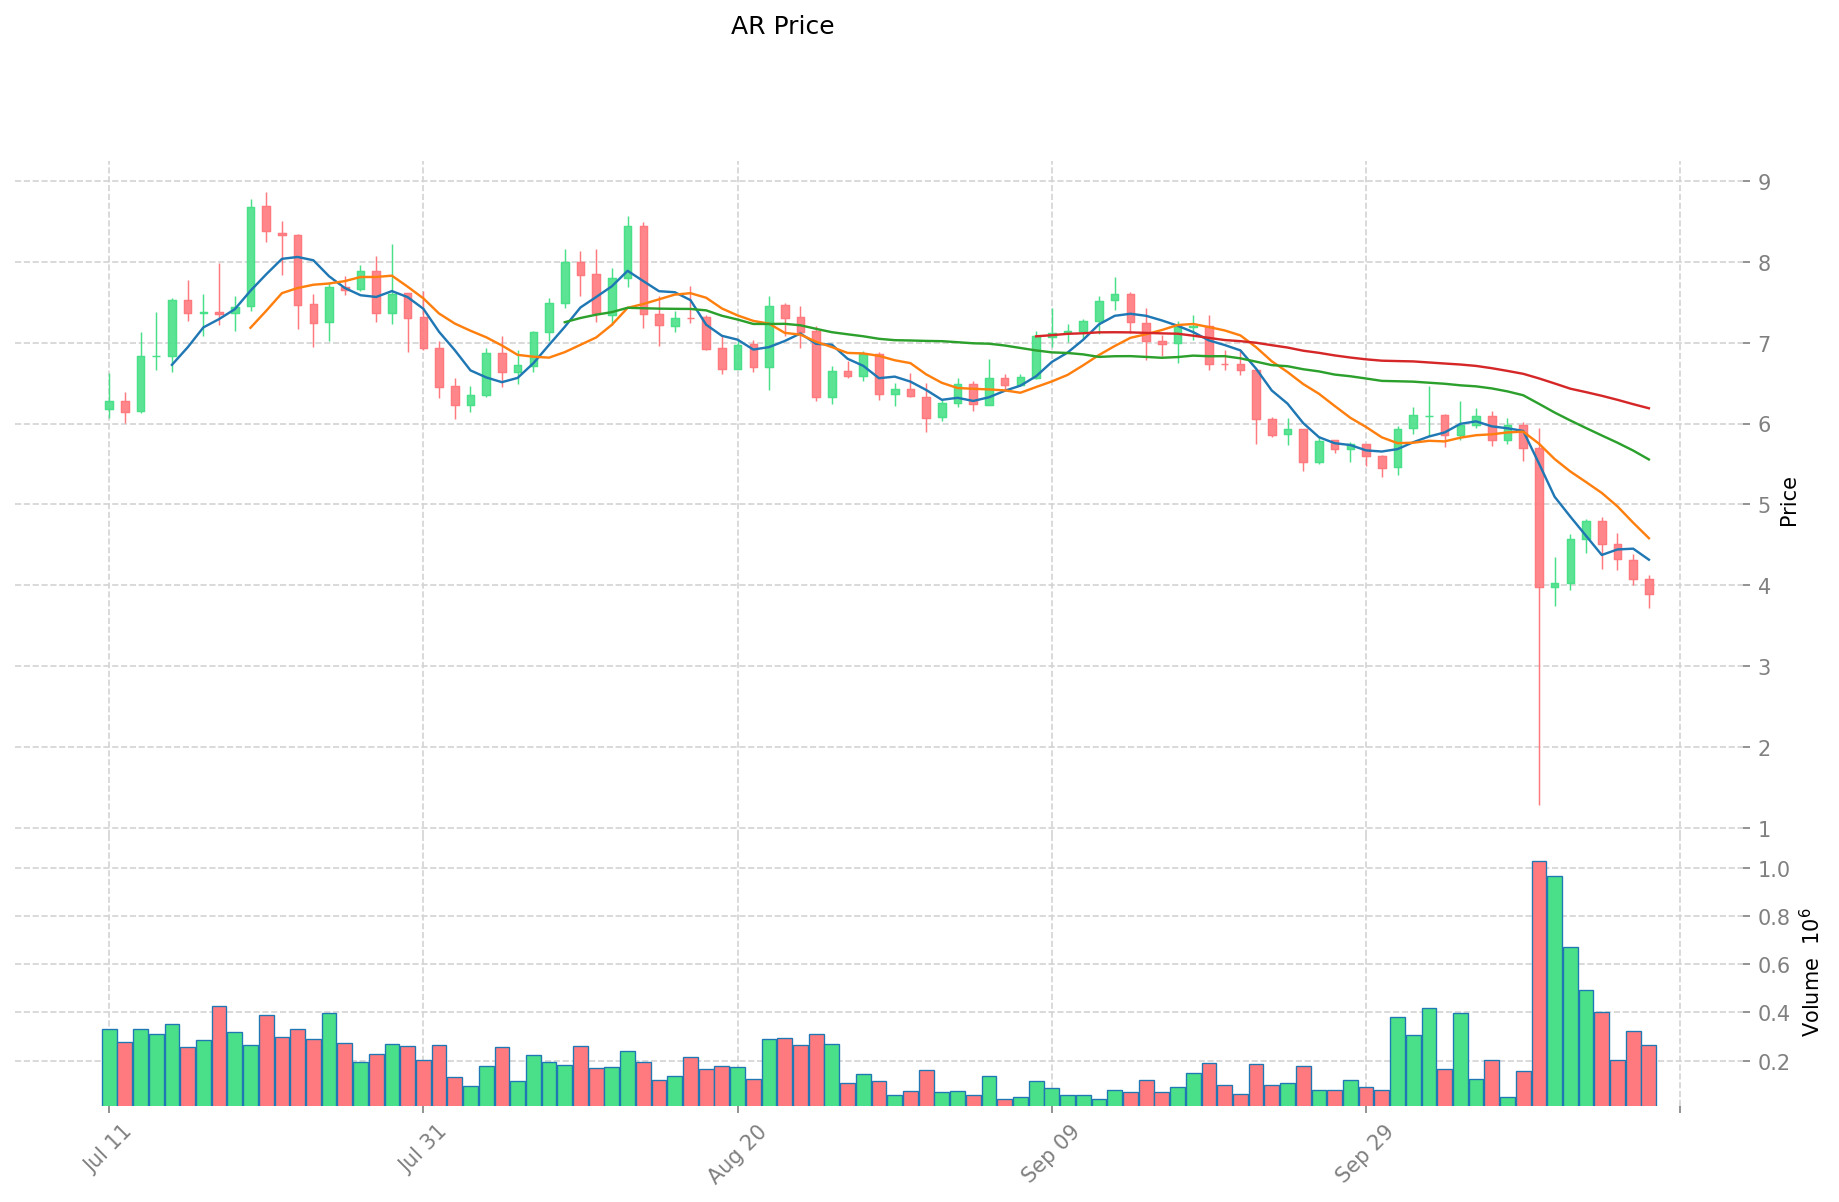
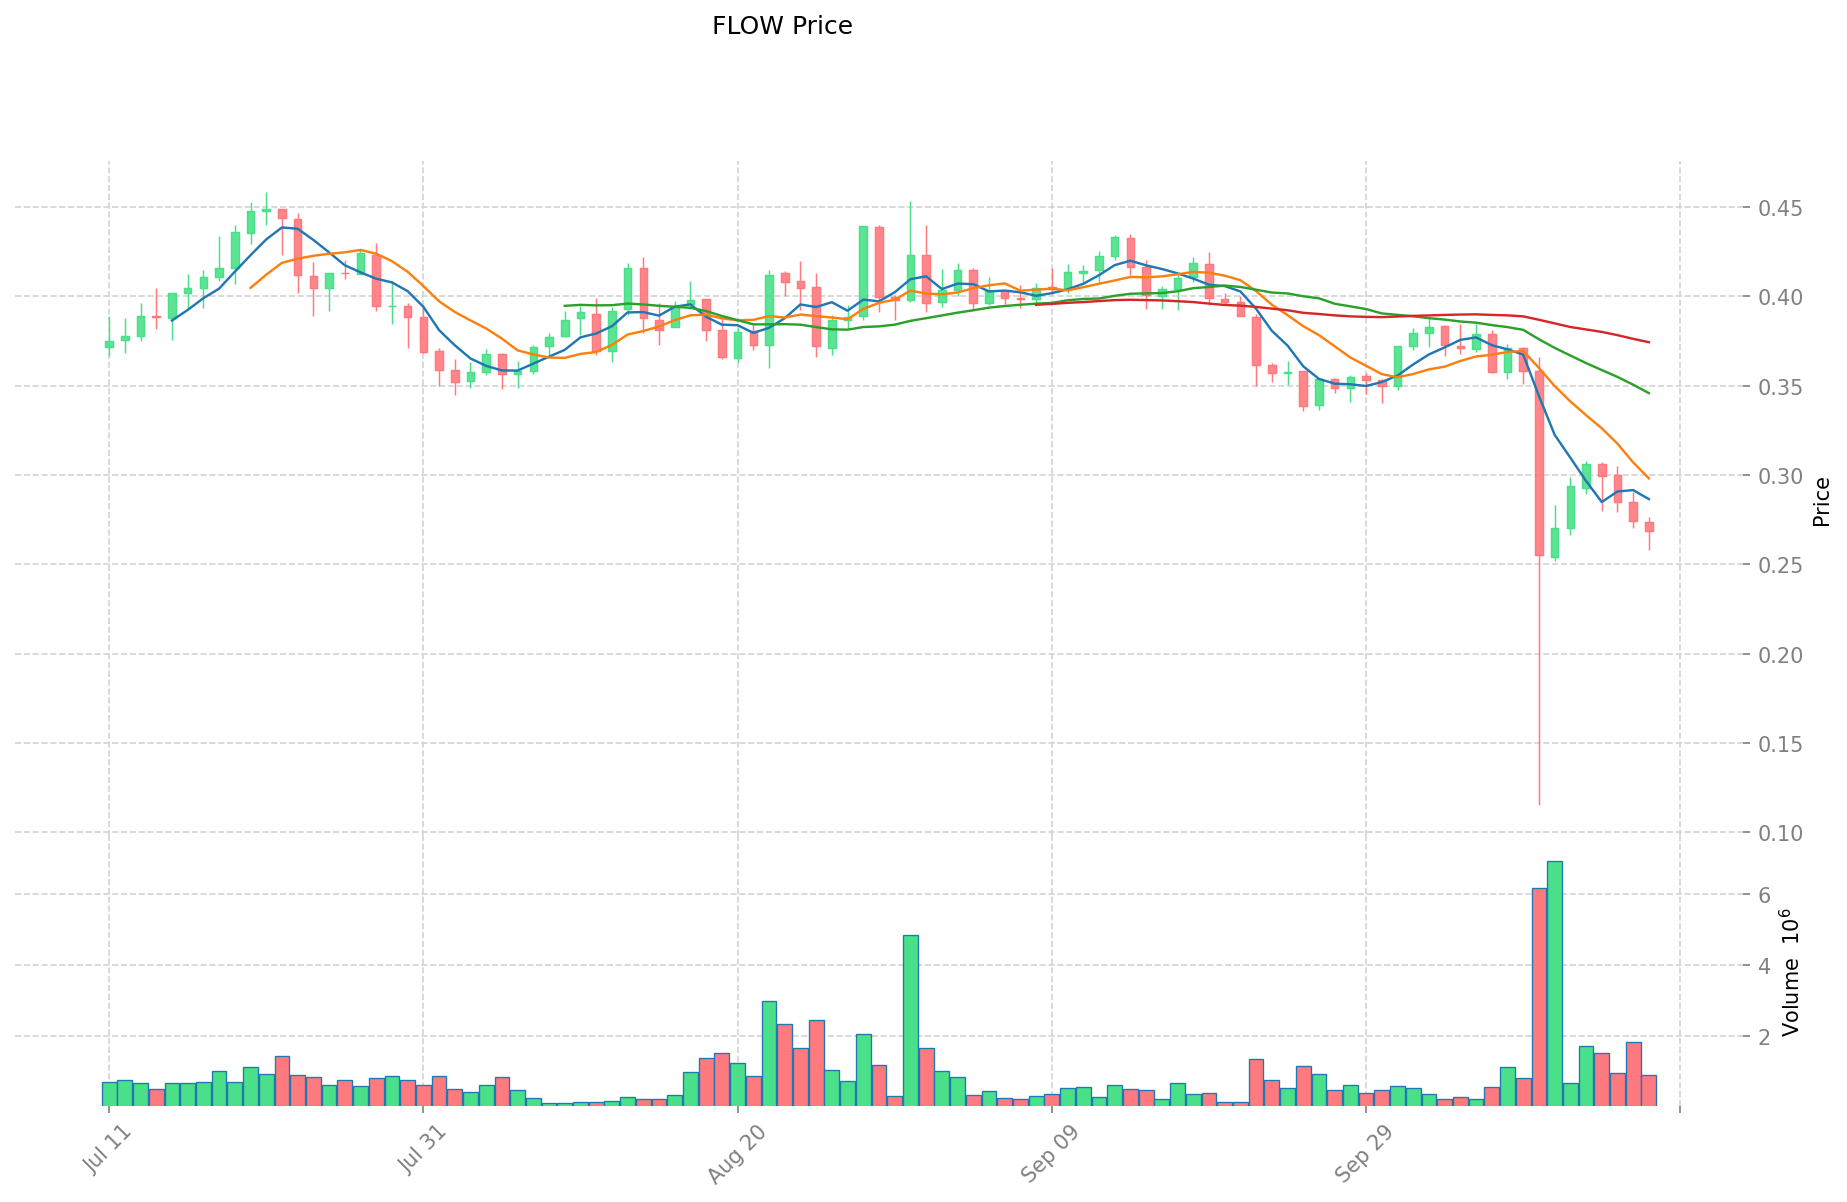
AR (Arweave) and FLOW (Flow) Historical Price Trends
- 2021: AR reached its all-time high of $89.24 on November 5, 2021, likely due to increased interest in decentralized storage solutions.
- 2021: FLOW hit its all-time high of $42.40 on April 5, 2021, possibly influenced by the growing popularity of NFTs and blockchain gaming.
- Comparative analysis: Since their respective peaks, AR has fallen from $89.24 to $3.876, while FLOW has dropped from $42.40 to $0.2687, both experiencing significant declines in the current market cycle.
Current Market Situation (2025-10-18)
- AR current price: $3.876
- FLOW current price: $0.2687
- 24-hour trading volume: AR $1,029,418.79 vs FLOW $244,624.66
- Market Sentiment Index (Fear & Greed Index): 22 (Extreme Fear)
Click to view real-time prices:
- Check AR current price Market Price
- Check FLOW current price Market Price
II. Core Factors Affecting AR vs FLOW Investment Value
Supply Mechanisms Comparison (Tokenomics)
- AR: Fixed maximum supply of 66 million tokens, with a supply schedule spanning over 329 years. Around 51 million AR tokens are currently in circulation.
- FLOW: Inflationary tokenomics with an initial supply of 1.25 billion tokens. Annual inflation rate starts at 3.75% and decreases over time.
- 📌 Historical pattern: AR's capped supply model tends to create scarcity value during high demand periods, while FLOW's inflationary model requires sustained adoption to maintain price stability.
Institutional Adoption and Market Applications
- Institutional holdings: AR has seen investment from Coinbase Ventures, USV, and a16z, while FLOW has backing from major players like Warner Music Group, NBA, and Andreessen Horowitz.
- Enterprise adoption: AR focuses on permanent data storage applications across industries, while FLOW targets entertainment and consumer experiences, particularly in NFTs and gaming.
- Regulatory landscape: Both projects maintain compliance with regulations but operate in different regulatory contexts based on their use cases.
Technical Development and Ecosystem Building
- AR technical upgrades: Enhancements to the permaweb infrastructure, improvements in data storage efficiency, and integration with other Web3 platforms.
- FLOW technical development: Focus on user-friendly onboarding, scalable infrastructure for NFTs, and developer tools for consumer applications.
- Ecosystem comparison: AR excels in decentralized storage applications and permanent web hosting, while FLOW dominates in NFT marketplaces, gaming, and entertainment partnerships.
Macroeconomic and Market Cycles
- Performance during inflation: AR's fixed supply model potentially positions it as a better inflation hedge compared to FLOW's inflationary tokenomics.
- Monetary policy impacts: Both tokens show sensitivity to broader crypto market trends, though AR's utility as a storage payment method may provide some stability.
- Geopolitical factors: AR's censorship-resistant storage provides value during information control periods, while FLOW's entertainment focus makes it more dependent on consumer discretionary spending during economic uncertainty.
III. 2025-2030 Price Prediction: AR vs FLOW
Short-term Prediction (2025)
- AR: Conservative $2.77 - $3.90 | Optimistic $3.90 - $4.56
- FLOW: Conservative $0.26 - $0.27 | Optimistic $0.27 - $0.39
Mid-term Prediction (2027)
- AR may enter a growth phase, with expected prices $4.18 - $5.71
- FLOW may enter a growth phase, with expected prices $0.28 - $0.49
- Key drivers: Institutional capital inflow, ETFs, ecosystem development
Long-term Prediction (2030)
- AR: Base scenario $5.18 - $6.64 | Optimistic scenario $6.64 - $7.44
- FLOW: Base scenario $0.54 - $0.58 | Optimistic scenario $0.58 - $0.82
Disclaimer
AR:
| 年份 | 预测最高价 | 预测平均价格 | 预测最低价 | 涨跌幅 |
|---|---|---|---|---|
| 2025 | 4.56183 | 3.899 | 2.76829 | 0 |
| 2026 | 5.37262705 | 4.230415 | 3.25741955 | 9 |
| 2027 | 5.71381001975 | 4.801521025 | 4.17732329175 | 23 |
| 2028 | 5.62570210894125 | 5.257665522375 | 4.7318989701375 | 35 |
| 2029 | 7.8360246945477 | 5.441683815658125 | 3.700344994647525 | 40 |
| 2030 | 7.435516765715262 | 6.638854255102912 | 5.178306318980271 | 71 |
FLOW:
| 年份 | 预测最高价 | 预测平均价格 | 预测最低价 | 涨跌幅 |
|---|---|---|---|---|
| 2025 | 0.39063 | 0.2694 | 0.258624 | 0 |
| 2026 | 0.41251875 | 0.330015 | 0.28051275 | 22 |
| 2027 | 0.49378494375 | 0.371266875 | 0.282162825 | 38 |
| 2028 | 0.570934200375 | 0.432525909375 | 0.38494805934375 | 60 |
| 2029 | 0.66730097298375 | 0.501730054875 | 0.4716262515825 | 86 |
| 2030 | 0.818321719501125 | 0.584515513929375 | 0.543599427954318 | 117 |
IV. Investment Strategy Comparison: AR vs FLOW
Long-term vs Short-term Investment Strategies
- AR: Suitable for investors focused on decentralized storage solutions and long-term data preservation
- FLOW: Suitable for investors interested in NFTs, gaming, and entertainment blockchain applications
Risk Management and Asset Allocation
- Conservative investors: AR: 60% vs FLOW: 40%
- Aggressive investors: AR: 70% vs FLOW: 30%
- Hedging tools: Stablecoin allocation, options, cross-currency portfolio
V. Potential Risk Comparison
Market Risk
- AR: Potential volatility due to fixed supply and demand fluctuations
- FLOW: Inflationary tokenomics may lead to price pressure without sustained adoption
Technical Risk
- AR: Scalability, network stability
- FLOW: Centralization concerns, security vulnerabilities
Regulatory Risk
- Global regulatory policies may impact both differently, with AR potentially facing data storage regulations and FLOW dealing with NFT and gaming-related policies
VI. Conclusion: Which Is the Better Buy?
📌 Investment Value Summary:
- AR advantages: Fixed supply, permanent data storage utility, institutional backing
- FLOW advantages: Strong partnerships in entertainment and gaming, focus on user-friendly blockchain experiences
✅ Investment Advice:
- New investors: Consider a balanced approach, leaning towards AR for its utility in data storage
- Experienced investors: Explore opportunities in both, with a slight preference for AR due to its fixed supply model
- Institutional investors: Evaluate AR for long-term holdings and FLOW for exposure to NFT and gaming markets
⚠️ Risk Warning: Cryptocurrency markets are highly volatile. This article does not constitute investment advice. None
VII. FAQ
Q1: What are the key differences between AR and FLOW? A: AR focuses on permanent data storage with a fixed supply of tokens, while FLOW targets entertainment and consumer experiences with an inflationary token model. AR is designed for decentralized storage applications, whereas FLOW specializes in NFTs, gaming, and entertainment partnerships.
Q2: Which token has performed better historically? A: Both tokens have seen significant declines from their all-time highs. AR peaked at $89.24 in November 2021 and is currently at $3.876. FLOW reached $42.40 in April 2021 and is now at $0.2687. Proportionally, FLOW has experienced a steeper decline.
Q3: How do the supply mechanisms of AR and FLOW differ? A: AR has a fixed maximum supply of 66 million tokens, with about 51 million currently in circulation. FLOW has an inflationary model with an initial supply of 1.25 billion tokens and an annual inflation rate starting at 3.75% that decreases over time.
Q4: Which token is better suited for long-term investment? A: AR may be better suited for long-term investment due to its fixed supply model and focus on permanent data storage, which could create scarcity value. However, FLOW's potential in the growing NFT and gaming markets could also offer long-term growth opportunities.
Q5: What are the main risks associated with investing in AR and FLOW? A: For AR, risks include potential volatility due to fixed supply and demand fluctuations, as well as scalability and network stability issues. FLOW faces risks from its inflationary tokenomics, centralization concerns, and potential security vulnerabilities.
Q6: How do institutional adoptions compare between AR and FLOW? A: AR has investments from Coinbase Ventures, USV, and a16z, while FLOW is backed by major players like Warner Music Group, NBA, and Andreessen Horowitz. FLOW appears to have more high-profile partnerships in the entertainment and sports industries.
Q7: What are the price predictions for AR and FLOW by 2030? A: By 2030, AR is predicted to reach a base scenario of $5.18 - $6.64, with an optimistic scenario of $6.64 - $7.44. FLOW is expected to reach a base scenario of $0.54 - $0.58, with an optimistic scenario of $0.58 - $0.82. However, these predictions are speculative and subject to market conditions.
Share
Content
Introduction: AR vs FLOW Investment Comparison
I. Price History Comparison and Current Market Status
II. Core Factors Affecting AR vs FLOW Investment Value
III. 2025-2030 Price Prediction: AR vs FLOW
IV. Investment Strategy Comparison: AR vs FLOW
V. Potential Risk Comparison
VI. Conclusion: Which Is the Better Buy?
VII. FAQ
How to Buy Cryptocurrency


Trending Cryptocurrencies


2025 LOOKS Price Prediction: Analyzing Key Market Factors and Long-term Growth Potential for the NFT Platform Token

Is APENFT (NFT) a good investment?: Exploring the potential and risks of this digital art token

2025 MUSE Price Prediction: Analyzing Trends and Factors Shaping the Future of the Digital Music Token
Is OPEN Ticketing Ecosystem (OPN1) a good investment?: Analyzing the Potential and Risks of This Blockchain-Based Ticketing Platform

2025 ROA Price Prediction: Analyzing Potential Growth and Market Trends for Real Options Associates
Is LooksRare (LOOKS) a Good Investment?: Analyzing the NFT Marketplace Token's Potential in a Volatile Crypto Market

How Does SXT Compare to The Graph in Blockchain Data Infrastructure Performance and Market Cap?

How to Measure Crypto Community and Ecosystem Activity: Twitter Followers, Developer Contribution, and DApp Growth
Is Basenji (BENJI) a good investment?: A Comprehensive Analysis of Price Potential, Market Fundamentals, and Risk Factors for 2024
Is XL1 (XL1) a good investment?: A Comprehensive Analysis of Market Performance, Risk Factors, and Future Growth Potential

Is Thetanuts Finance (NUTS) a good investment?: A Comprehensive Analysis of Returns, Risks, and Market Potential