2025 EDEN Price Prediction: Expert Analysis and Market Forecast for the Next Year

Introduction: EDEN's Market Position and Investment Value
OpenEden (EDEN) operates as a leading real-world asset (RWA) tokenization platform, renowned for its unmatched focus on regulatory standards and advanced financial technology. Since its inception in 2022, OpenEden has established itself as a bridge between traditional and decentralized finance through its regulated entities in the BVI and Bermuda. As of December 2025, EDEN has achieved a market capitalization of approximately $64.36 million, with a circulating supply of around 183.87 million tokens, currently trading at approximately $0.0644. This asset, recognized as a compliance-driven innovation leader in the RWA sector, is playing an increasingly critical role in redefining financial access through tokenization.
This article will provide a comprehensive analysis of EDEN's price trajectory through 2030, integrating historical patterns, market supply-demand dynamics, ecosystem development, and macroeconomic conditions to deliver professional price forecasts and practical investment strategies for investors.
I. EDEN Price History Review and Current Market Status
EDEN Historical Price Trajectory
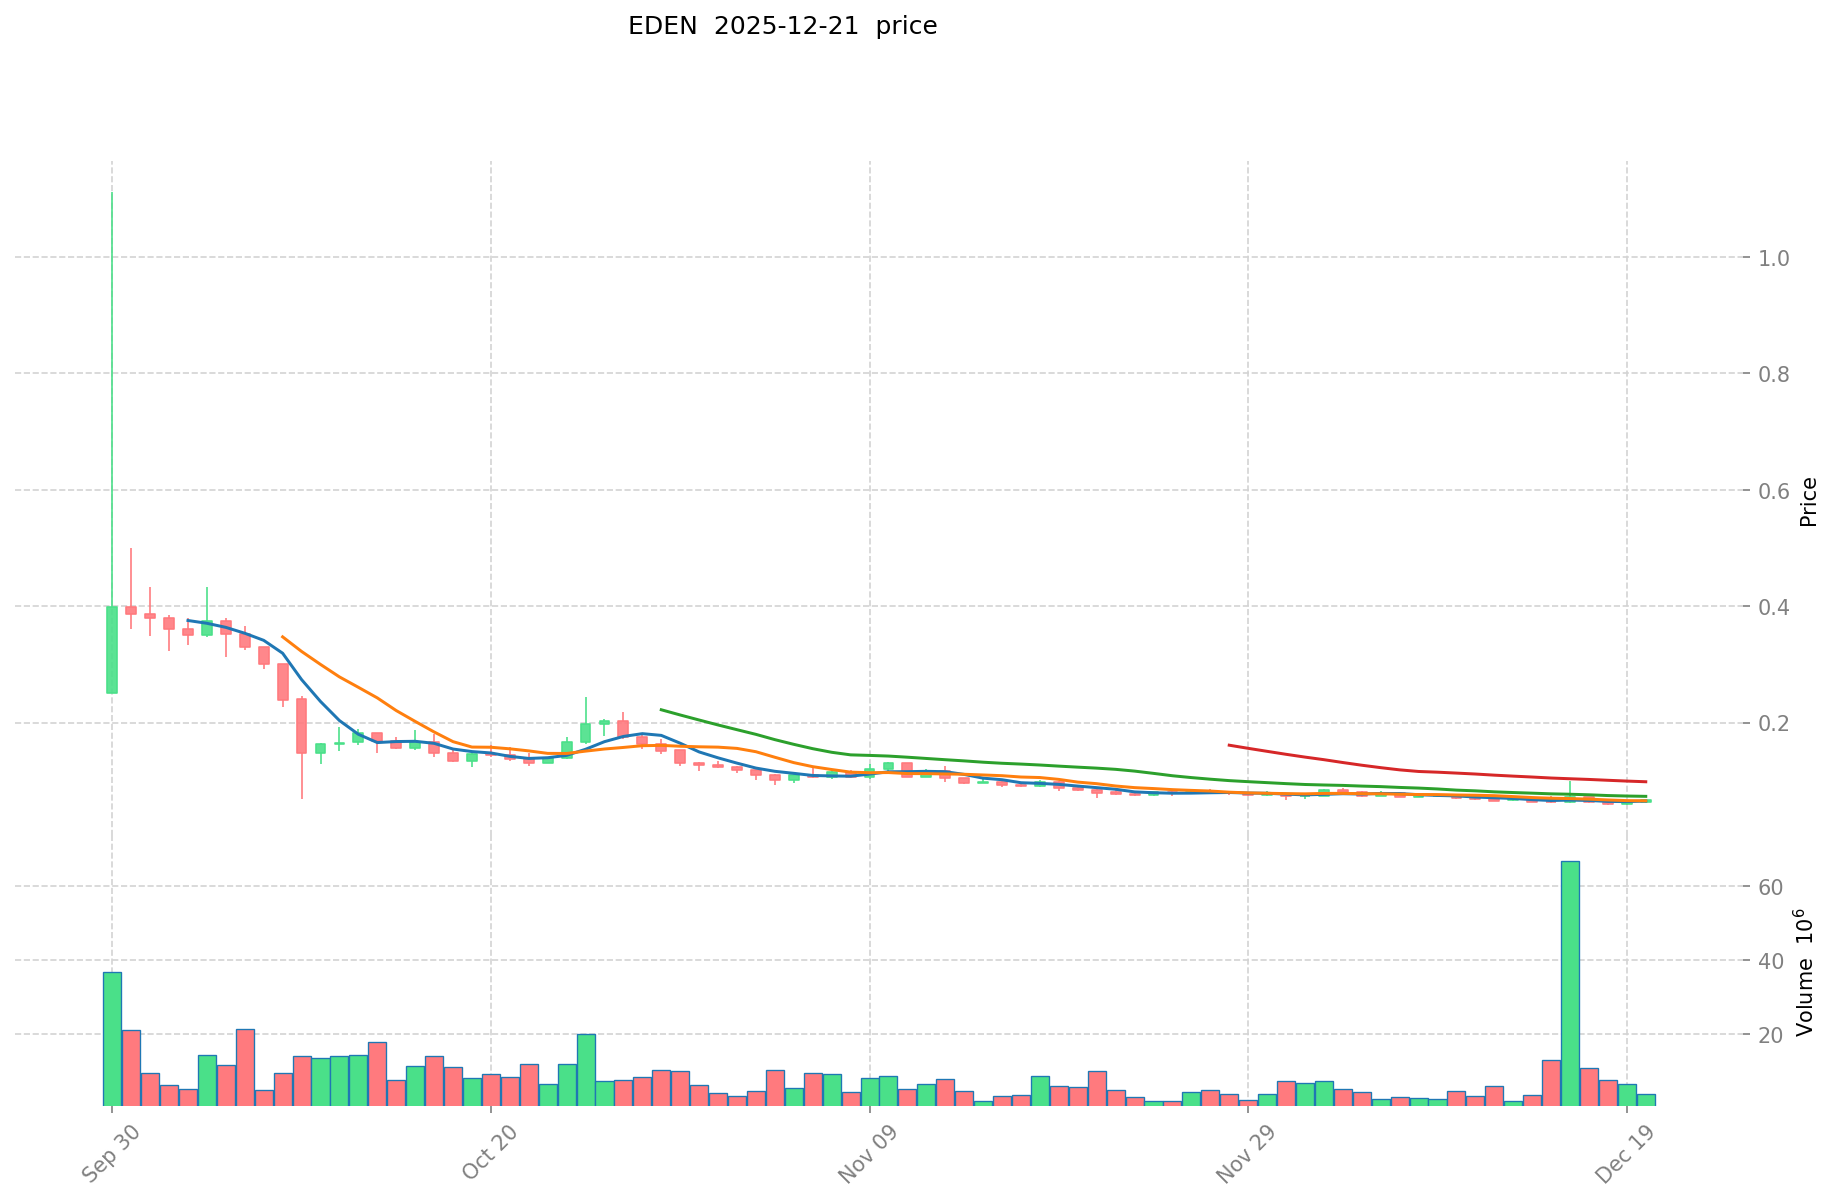
EDEN reached its all-time high (ATH) of $1.1123 on September 30, 2025, representing a significant peak in the token's trading history. Subsequently, the token experienced a substantial decline, falling to its all-time low (ATL) of $0.0576 on December 18, 2025. This represents a dramatic depreciation of approximately 93.59% over the one-year period, reflecting significant volatility and downward pressure on the asset.
EDEN Current Market Conditions
As of December 21, 2025, EDEN is trading at $0.06436, positioned near its recent low levels. The 24-hour trading volume stands at $371,714.72, with the token experiencing a marginal upward movement of 0.6% in the past 24 hours. However, short-term momentum remains negative, with the token declining 2.18% over the past hour and 2.79% over the past seven days. The 30-day performance further reflects weakness, with a 16.7% decline recorded over this period.
The token's market capitalization is valued at approximately $11.83 million, with a fully diluted valuation (FDV) of $64.36 million. EDEN maintains a circulating supply of 183.87 million tokens out of a maximum supply of 1 billion tokens, representing an 18.39% circulation ratio. The token is currently ranked #1091 by market capitalization and maintains a market dominance of 0.0020%. With 5,198 token holders and listing on 22 exchanges, EDEN demonstrates a growing but still developing ecosystem presence.
Click to view current EDEN market price
EDEN Market Sentiment Index
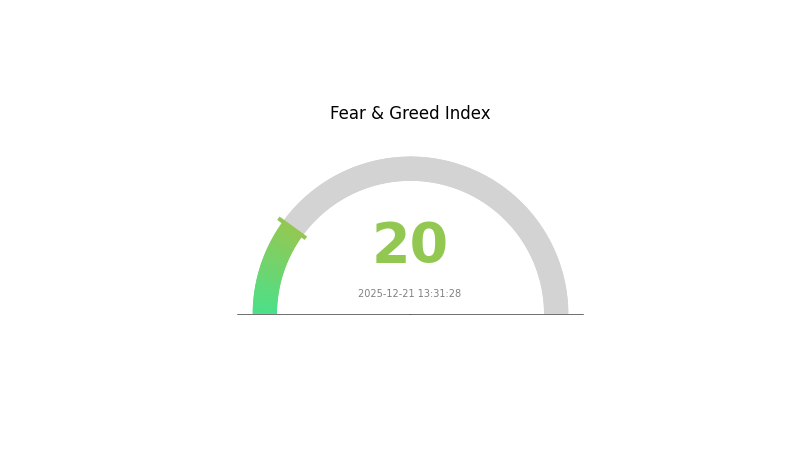
2025-12-21 Fear and Greed Index: 20 (Extreme Fear)
Click to view current Fear & Greed Index
The cryptocurrency market is experiencing extreme fear sentiment today, with the index dropping to 20. This reading signals significant market anxiety and pessimistic investor outlook. Such extreme fear often presents contrarian opportunities for long-term investors, as excessive pessimism typically precedes market recoveries. However, traders should exercise caution and implement proper risk management strategies. Monitor key support levels closely and consider gradually accumulating positions only after confirming stabilization signals. Stay informed through Gate.com's market data tools to make well-timed investment decisions during this volatile period.
EDEN Holdings Distribution
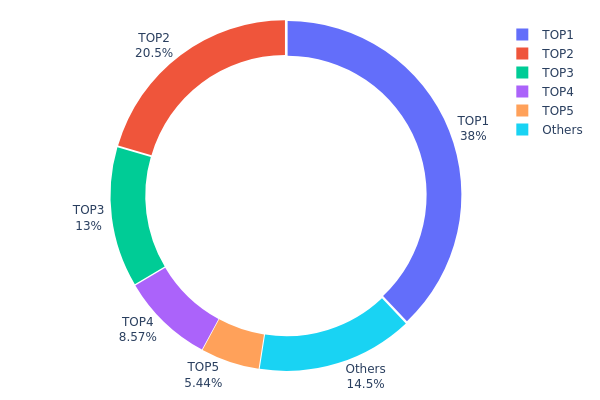
The holdings distribution chart illustrates the concentration of EDEN tokens across blockchain addresses, revealing the degree of decentralization and potential market manipulation risks within the token ecosystem. By analyzing the top addresses and their respective shareholding percentages, stakeholders can assess the vulnerability of the protocol to whale activities and sudden liquidity shifts.
EDEN exhibits pronounced concentration characteristics, with the top five addresses collectively commanding 85.46% of the total token supply. The leading address alone holds 37.95% of all EDEN tokens, representing a significant concentration that raises concerns regarding centralization risks. The second and third-largest holders control 20.49% and 13.02% respectively, further consolidating power within a limited number of entities. This distribution pattern indicates that the token has not achieved optimal decentralization, as the majority of voting power and liquidity control remain concentrated among a small cohort of addresses. Only 14.54% of tokens are distributed among remaining holders, suggesting an asymmetrical market structure.
Such extreme concentration poses material risks to market stability and price integrity. The top three addresses alone control 71.46% of the circulating supply, granting these entities substantial influence over protocol governance, liquidity provision, and price discovery mechanisms. In scenarios of coordinated token movements or forced liquidations, these large holders could induce significant price volatility. Additionally, the concentrated distribution may hinder organic market participation and reduce the resilience of the ecosystem against potential attacks or governance manipulation. The current holder structure reflects early-stage token distribution dynamics, where initial allocations to core teams, venture capitalists, or strategic partners remain incompletely distributed to broader market participants, thereby limiting true decentralization and increasing systemic fragility.
Click to view current EDEN holdings distribution
| Top | Address | Holding Qty | Holding (%) |
|---|---|---|---|
| 1 | 0x80aa...0afbe8 | 352800.00K | 37.95% |
| 2 | 0x7ffd...d5ec66 | 190559.64K | 20.49% |
| 3 | 0x7e6c...65af23 | 121038.88K | 13.02% |
| 4 | 0xad11...d7e7ff | 79666.67K | 8.56% |
| 5 | 0xf64b...7263cc | 50616.66K | 5.44% |
| - | Others | 134946.08K | 14.54% |
II. Core Factors Affecting EDEN's Future Price Movement
Supply Mechanism
- Staking and Reward Mechanism: The introduction of staking opportunities is expected to influence short-term price trends. As more staking mechanisms become available, they may attract additional capital inflows and affect price volatility in the near term.
Market Dynamics and Investor Sentiment
-
Community Participation: EDEN's price movement is primarily influenced by community engagement and cultural trends rather than technical or economic fundamentals. The strength of community participation directly impacts price movements.
-
Market Speculation: Market speculation plays a significant role in determining price trends. Investor sentiment and market momentum are key factors driving short-term price fluctuations.
-
Market Momentum: Market momentum and investor emotion serve as critical indicators for predicting future price directions. Changes in market sentiment can rapidly shift the trajectory of EDEN's value.
III. 2025-2030 EDEN Price Forecast
2025 Outlook
- Conservative Forecast: $0.05199 - $0.06419
- Neutral Forecast: $0.06419
- Optimistic Forecast: $0.08794 (requiring sustained market interest and positive ecosystem developments)
2026-2028 Mid-term Outlook
- Market Stage Expectation: Recovery and consolidation phase with gradual appreciation potential
- Price Range Forecasts:
- 2026: $0.05325 - $0.10497 (18% upside potential)
- 2027: $0.07603 - $0.09414 (40% cumulative gains)
- 2028: $0.04893 - $0.1071 (43% cumulative gains)
- Key Catalysts: Protocol upgrades, increased institutional adoption, expanded use cases within the EDEN ecosystem, and overall market sentiment improvement in the digital asset sector
2029-2030 Long-term Outlook
- Base Case Scenario: $0.0688 - $0.10769 by 2029 (54% cumulative appreciation from 2025 levels)
- Optimistic Scenario: $0.10059 - $0.13067 by 2030 (61% cumulative gains, assuming sustained ecosystem growth and mainstream adoption acceleration)
- Transformation Scenario: $0.13067+ (contingent on breakthrough developments in tokenomics, strategic partnerships, and breakthrough technological innovations)
Note: All price predictions represent technical analysis estimates and should not be considered investment advice. Market participants are encouraged to conduct independent research on Gate.com and other platforms before making investment decisions. Cryptocurrency markets remain highly volatile and subject to regulatory changes.
| 年份 | 预测最高价 | 预测平均价格 | 预测最低价 | 涨跌幅 |
|---|---|---|---|---|
| 2025 | 0.08794 | 0.06419 | 0.05199 | 0 |
| 2026 | 0.10497 | 0.07607 | 0.05325 | 18 |
| 2027 | 0.09414 | 0.09052 | 0.07603 | 40 |
| 2028 | 0.1071 | 0.09233 | 0.04893 | 43 |
| 2029 | 0.10769 | 0.09971 | 0.0688 | 54 |
| 2030 | 0.13067 | 0.1037 | 0.10059 | 61 |
EDEN Token Investment Strategy and Risk Management Report
IV. EDEN Professional Investment Strategy and Risk Management
EDEN Investment Methodology
(1) Long-term Holding Strategy
- Suitable Investors: Risk-averse investors, institutional participants, and those seeking exposure to RWA tokenization trends
- Operational Recommendations:
- Accumulate EDEN during market downturns to average entry costs
- Hold positions through regulatory clarity phases in the RWA sector
- Monitor OpenEden's platform growth and adoption metrics to assess fundamentals
(2) Active Trading Strategy
- Technical Analysis Tools:
- Support and Resistance Levels: Identify key price points at $0.06346 (24H low) and $0.06907 (24H high) for entry and exit decisions
- Volume Analysis: Track the 24-hour trading volume of $371,714.72 to assess liquidity and momentum shifts
- Range Trading Key Points:
- Execute buy orders near established support levels with disciplined stop-loss orders
- Take profit opportunities when price approaches resistance levels, particularly given recent -2.79% 7-day performance
EDEN Risk Management Framework
(1) Asset Allocation Principles
- Conservative Investors: 1-2% of portfolio allocation
- Active Investors: 3-5% of portfolio allocation
- Professional Investors: 5-10% of portfolio allocation
(2) Risk Hedging Solutions
- Position Sizing: Limit individual trade exposure to 2-3% of total capital to mitigate concentrated losses
- Diversification Strategy: Balance EDEN holdings with other RWA tokens and established digital assets to reduce sector-specific risk
(3) Secure Storage Solutions
- Hot Wallet Approach: Use Gate.com Web3 Wallet for frequent trading and active portfolio management
- Cold Storage Option: Transfer long-term holdings to hardware-based solutions for enhanced security
- Security Considerations: Enable two-factor authentication, regularly audit wallet permissions, avoid phishing attempts, and never share private keys or recovery phrases
V. EDEN Potential Risks and Challenges
EDEN Market Risk
- Extreme Volatility: EDEN has experienced a -93.59% decline over one year, indicating substantial price instability and potential for further downside movements
- Low Liquidity Concerns: With only $371,714.71 in 24-hour trading volume and a market cap of $11.83 million, liquidity may constrain large position entries or exits
- Market Sentiment Deterioration: The token has declined -16.7% over 30 days and -2.79% over 7 days, suggesting ongoing negative market sentiment
EDEN Regulatory Risk
- Evolving RWA Frameworks: Regulatory treatment of tokenized real-world assets remains in development globally, creating uncertainty for OpenEden's business model and EDEN token utility
- Jurisdiction Compliance: While OpenEden operates through regulated entities in BVI and Bermuda, changes in these jurisdictions' crypto regulations could impact operations
- DeFi Integration Challenges: Regulatory scrutiny on DeFi platforms and tokenized asset trading could restrict EDEN's utility or trading venues
EDEN Technical Risk
- Blockchain Dependency: EDEN operates on multiple chains (Ethereum and BSC); cross-chain vulnerabilities or network congestion could affect token functionality
- Smart Contract Exposure: Any vulnerabilities in OpenEden's smart contracts could lead to token loss or platform disruption
- Limited Diversification: With only 22 exchange listings, EDEN faces concentration risk in trading venues and reduced accessibility for global participants
VI. Conclusion and Action Recommendations
EDEN Investment Value Assessment
OpenEden operates in the promising RWA tokenization sector, positioning EDEN as exposure to a potentially transformative financial infrastructure. However, the token's significant 93.59% annual decline, limited market capitalization of $11.83 million, and ongoing regulatory uncertainty present substantial challenges. The platform's focus on compliance and traditional finance integration offers long-term potential, but near-term price pressure and low trading volumes suggest elevated risk. Investors should view EDEN as a speculative, high-risk holding requiring careful position management.
EDEN Investment Recommendations
✅ Beginners: Start with minimal allocations (0.5-1% of portfolio) through dollar-cost averaging on Gate.com to reduce timing risk, avoiding large lump-sum purchases given volatility.
✅ Experienced Investors: Consider 3-5% allocations with active monitoring of RWA sector developments, OpenEden platform metrics, and regulatory announcements. Employ technical analysis around identified support/resistance levels.
✅ Institutional Investors: Evaluate 5-10% allocations within broader RWA exposure strategies, with direct engagement on compliance frameworks and potential partnerships with OpenEden's institutional infrastructure.
EDEN Trading Participation Methods
- Gate.com Spot Trading: Direct purchase and sale of EDEN tokens with real-time price discovery and order execution
- Limit Orders: Set predetermined buy and sell prices on Gate.com to automate entries at support levels and exits at resistance targets
- Portfolio Rebalancing: Periodically adjust EDEN positions relative to overall allocation targets as market conditions evolve
Cryptocurrency investments carry extreme risk. This report does not constitute investment advice. Investors must make decisions based on personal risk tolerance and should consult professional financial advisors. Never invest funds you cannot afford to lose completely.
FAQ
What is the future of Eden coin?
Eden coin is projected to reach ₹50.0590 by 2027 with a 10.25% growth rate. Based on current market trends, Eden shows strong potential for long-term appreciation and adoption in the Web3 ecosystem.
Will Magic Eden go up?
Yes, Magic Eden is expected to experience price growth. Based on current market analysis and trends, the token shows positive momentum with predictions indicating upward movement in the coming months.
What is EDEN token and what is its current price?
EDEN token is a cryptocurrency asset. As of December 21, 2025, EDEN is priced at $0.063 USD with a 24-hour trading volume of $5.29 million.
What are the key factors that could affect EDEN's price in the future?
EDEN's price may be influenced by exchange listings, RWA sector momentum, institutional compliance adoption, macroeconomic data like U.S. CPI releases, and market rotation trends between cryptocurrencies.
How does EDEN compare to other tokens in the same ecosystem?
EDEN is the sole token in the Eden ecosystem, distinguishing it from competitors. Its unique position drives value from cross-chain initiatives and ecosystem development.
Share
Content
Introduction: EDEN's Market Position and Investment Value
I. EDEN Price History Review and Current Market Status
II. Core Factors Affecting EDEN's Future Price Movement
III. 2025-2030 EDEN Price Forecast
IV. EDEN Professional Investment Strategy and Risk Management
V. EDEN Potential Risks and Challenges
VI. Conclusion and Action Recommendations
FAQ
How to Buy Cryptocurrency


Trending Cryptocurrencies


2025 LINGO Price Prediction: Navigating the Future of Decentralized Linguistics

2025 LUNC Price Prediction: Analyzing Terra Luna Classic's Potential Recovery and Market Outlook in the Post-Crash Era

2025 HTX Price Prediction: Analyzing Market Trends and Growth Potential for the Digital Asset Exchange Token

2025 HBAR Price Prediction: Will Hedera Hashgraph Reach New Heights in the Crypto Market?
2025 CFX Price Prediction: Analysis of Market Trends and Potential Growth Factors for Conflux Network

2025 LTCPrice Prediction: Analyzing Market Trends and Potential Growth Factors for Litecoin

How to Use Memefi with a Digital Asset Wallet: A Simple Guide

Exploring BlockDAG: The Future of Blockchain Innovation
Exploring Swell Network: The Ultimate Guide to Liquid Staking in Crypto

Exploring THORChain: The Ultimate Cross-Chain Liquidity Solution

Exploring the Fundamentals of Web3 Technology